 Fourplex
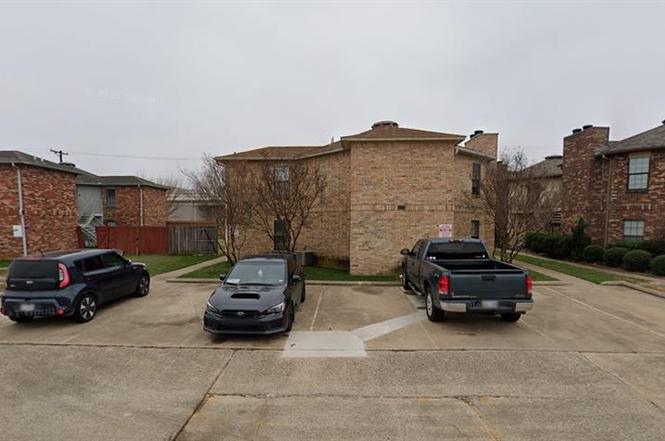
734 Bluebonnet Dr · Keller, TX
Flood risk 1/10 · Minimal
- FEMA flood zone
- X (unshaded)
- Chance of flooding over 30 yrs
- 0.0%
- Est. flood insurance / yr
- $507 – $1,088
Fire risk 4/10 · Minor
- Est. fire insurance / yr
- $1,222 – $2,270
Heat risk 7/10 · Major
- Hot days now (above 109°F)
- 7 days/yr
- Hot days in 30 yrs
- 25 days/yr
Wind risk 4/10 · Minor
- Chance of severe wind over 30 yrs
- 20.0%
Air-quality risk 3/10 · Minor
- Unhealthy air days now
- 3 days/yr
- Unhealthy air days in 30 yrs
- 4 days/yr
Risk factors via First Street. Map © Google.
Why this score? — see what drove the D grade
The composite is a weighted blend of 9 inputs, each scored 0–100. Each bar is that input's sub-score; the figure is the points it added to the 100-point composite (weight × sub-score).
- Cash flow +12.6/30.0
- ARV discount +9.9/15.0
- Schools +4.8/10.0
- Livability +4.1/5.0
- DSCR +3.7/10.0
- 1% rule +3.2/10.0
- Rent growth +3.0/5.0
- Condition / age +2.5/5.0
- Appreciation +0.0/10.0
$785,000
🖨 Deal sheet (PDF) 📄 Offer letter ✓ Due diligence
Multi-family units
County records classify this as Multi-Family (2-4 Unit). Listing-text estimate: 4 units. confirmed
Listing remarks MLS
Rare fourplex in Keller!!! 100% occupied! Near Keller High School. Units rented for $650 each. Notice big price reduction.
Key facts
- 8,189 sq ft lot
- 4 parking spots
- Built 1984
Property features AI
Finance
- Other: 1 building with 4 total units; 100% occupancy
- Financial info: Gross annual income: $67,200; Gross annual expenses: $12,500; Insurance expense: $12,000; Net operating income: $54,700; Capitalization rate: 6.97%
- HOA & community: No association
Exterior
- Parking: Assigned parking; 4 parking spaces
- Utilities: Cable available; City water; City sewer; Not in a municipal utility district
- Home design: Residential income property (quadruplex); Two levels; Complex name: 734 Bluebonnet; Subdivision: Meadowlands Add
- Construction: Built in 1984; Brick and siding construction; Asphalt roof; Slab foundation
- Exterior features: City water; City sewer
Interior
- Kitchen: Dishwasher; Disposal; Electric range
- Bedrooms: 8 bedrooms
- Flooring: Laminate flooring
- Bathrooms: 8 full bathrooms
- Heating & cooling: Central heating; Central air conditioning
- Interior features: Cable TV available
Neighborhood map
What this means for you Summary
Snapshot
- This is a 4 × 2-bed/2.0-bath units multifamily listed at $785k.
Deal economics
- At list price, monthly cash flow is $-106 ($-1k/yr) — negative. Per door: $-26/mo.
- To cash-flow at today's rent, offer at most $766k (2.4% below list).
- To meet the 1% rule (rent ≥ 1% of price), the offer needs to be $647k (17.5% below list).
- Recommended offer: $647k (17.5% below list) — sets the bar for 1% rule.
- Cap rate 6.1% vs local median 2.4% in Keller — top-decile yield for the area; either an underpriced asset or a hidden risk that comps aren't pricing in. Stress-test before assuming the spread holds.
Location & tenants
- Location reads 82/100 on livability (#15 in TX, #1,130 nationally) — a professional / high-income tenant draw. Strengths: crime A+, amenities A+, employment A+; Watch: commute F, cost of living F.
- Keller ISD (urban): math 50% / reading 54% proficiency, ranked #91 of 826 in TX (top 11%) — acceptable for families but not a draw, mixed tenant base, ~2y average lease; only 19% free/reduced lunch — higher-income household profile.
- Zoned schools: Keller-Harvel El (math 57% / reading 52%, grade C, #621 of 4,322 statewide, top 15%, 484 students, 28% FRL); Keller Middle (math 68% / reading 70%, grade A, #69 of 1,662 statewide, top 4%, 921 students, 10% FRL); Keller H S (math 68% / reading 83%, grade A-, #78 of 1,632 statewide, top 5%, 3,089 students, 8% FRL) — zoned schools at 15% FRL track the district average.
- Zoned-school proficiency averages 66% at this address vs 52% district-wide (+14 pts) — the actual schools serving this property are materially stronger than the Keller ISD average implies; a family-tenant draw the district grade alone would hide.
- Market conditions: Rents rising (+2.1%/yr); 250 active listings in the ZIP; high-income renter base; 18,938 units permitted in Tarrant County in 2024 (8,336 in 5+ unit buildings).
- At $6,474/mo this rent would consume 45% of the median local household income ($172k/yr) (locally 816% of renters already pay >50% of income on rent) — very limited rent-growth headroom before tenants either downsize or default.
Forward outlook
- Local home prices are declining (-3.0%/yr); year-one equity from $5k of loan paydown is wiped out by about $24k of value loss. Plan a longer hold.
- Tarrant County population projected at +41% by 2050 — long-run rental-demand tailwind backs the buy-and-hold thesis.
Negotiation context
- It's been on market 90 days — a 6% lower offer ($738k) is reasonable based on typical stale-listing flexibility.
- 5 sale attempts since 21y ago; this cycle's ask is 5% above the opening price — seller raised mid-cycle; expect resistance to lowballs.
Risks & watch-outs
- Climate carrying-cost: extreme-heat days projected 7→25/yr by 2055 (HVAC capex compounding) — expect insurance premiums to compound above CPI over the hold.
Questions for the listing agent
- What do current leases actually rent for vs. the listed asking? Can we see a recent rent roll and the last 12 months of T-12 income?
- It's been on market 90 days. Have you received any prior offers? Is the seller open to a 18% concession, seller financing, or rate buy-down credit?
- Can we see the unit-by-unit rent roll, current vacancy, and any below-market leases? What's the average tenancy length?
- What capital expenditures (roof, boiler, parking lot, exteriors) have been made in the last 5 years, and what's planned in the next 2?
- Why hasn't it sold? Are there any deal-killer items the seller is aware of (foundation, flood, title, zoning, code violations)?
- Is there a deadline driving the sale (1031 exchange, divorce, estate, relocation)? That informs how much negotiation room exists.
- Schools are A-rated — typically a magnet for longer-tenancy family renters. What's the average tenant stay here, and is there a school-zone premium baked into asking?
- The area grade is low — what's the realistic commute time and amenity access for the typical tenant pool here? Any planned neighborhood developments (good or bad) we should know about?
- What's the average days-on-market for RENTAL listings here right now (not sales)? A rising rental-DOM trend means longer vacancies and softer asking-rent achievability than the comps imply.
- What's the recent tenant-quality profile in this submarket — average credit score on applications, eviction rate, late-payment / NSF rate, and stable-employment percentage? A property-management company in the area should have these aggregated.
- How much new apartment / multifamily construction is in the pipeline within 1–3 miles? Heavy new supply (>2% of stock underway) typically softens rents 12–24 months out; light construction supports rent growth.
Investment metrics
- 1% rule
- 0.82% ✗
- Cap rate
- 6.13%
- Cash-on-cash
- -0.58%
- DSCR
- 0.97
- GRM
- 10.1
CMA / ARV
- ARV (on-the-fly)
- $829,472
- Comps found
- 2
Show comp detail 2 sales within ~0.75 mi
| Address | Dist | Beds/Ba | Sqft | Sold | Price | $/sf | Match |
|---|---|---|---|---|---|---|---|
| 730 Bluebonnet Dr | 0.04mi | 8/6.0 | 3,878 (-8%) | 13mo | $759,900 | $196 | 66 |
| 207 Pate Orr Rd N | 0.11mi | 8/6.0 | 3,878 (-8%) | 21mo | $745,000 | $192 | 56 |
Match score weights: distance 35% · size 25% · config 20% · recency 20%. Top-matched comps best support the ARV.
Projected returns pro-forma
-3.0% appreciation · 2.14% rent growth · sell at horizon
- IRR
- -18.2%
- Equity multiple
- 0.37×
- Total profit
- $-139,517
- Equity at exit
- $117,046
- IRR
- -12.2%
- Equity multiple
- 0.31×
- Total profit
- $-152,671
- Equity at exit
- $67,872
Cash invested: $219,800 (down + closing). Projections, not guarantees.
Landlord ↔ Tenant lean methodology
- Overall (STATE)
- 87 Strongly Landlord-Friendly
- State Texas
- 87 Strongly Landlord-Friendly · R+5
- County
- — inherits STATE
- City
- — inherits STATE
ZIP-level market 76248
- Rents YoY
- 2.1%
- Active inventory
- 250
- Price-to-rent
- 40.4×
Monthly cashflow live
- Estimated rent
- $6,474 high interval (Pro) →
- Mortgage (P&I)
- −$4,117
- Tax from tax record
- −$776 /mo · $9,317/yr
- Insurance
- −$327
- HOA
- −$0
- Vacancy / Maint / Mgmt
- −$1,360
- Net cashflow
- $-106
Break-even live
Sensitivity live
| Price | -10% $339 | -5% $117 | +0% $-106 | +5% $-328 | +10% $-550 |
|---|---|---|---|---|---|
| Rent | -10% $-617 | -5% $-361 | +0% $-106 | +5% $150 | +10% $406 |
| Rate | -1.0pp $290 | -0.5pp $94 | base $-106 | +0.5pp $-309 | +1.0pp $-516 |
4-unit breakdown (identical units grouped — click to expand)
| Units | Beds | Baths | Est. rent |
|---|---|---|---|
| 4× units | 2 | 2 | $6,476 |
| #1 | 2 | 2 | $1,619 |
| #2 | 2 | 2 | $1,619 |
| #3 | 2 | 2 | $1,619 |
| #4 | 2 | 2 | $1,619 |
| Total (4 units) | $6,474 | ||
UW: 25.0% down · 7.5% · 30yr · 1.5% tax · 5.0% vac · 8.0% maint · 8.0% mgmt
Financing live
Cash to close
- Down payment
- $196,250
- Closing costs
- $23,550
- Reserves months
- —
- Total cash needed
- —
Loan-product check · same deal, 3 products live
Conventional
25% down · 7.5% · 30yr
- Down + closing
- —
- Monthly P&I
- —
- Monthly cashflow
- —
- DSCR
- —
- Eligible?
- —
Personal DTI + credit; lowest rate.
DSCR
20% down · 8.5% · 30yr
- Down + closing
- —
- Monthly P&I
- —
- Monthly cashflow
- —
- DSCR
- —
- Eligible?
- —
No personal income docs; deal must DSCR.
Hard money
10% down · 12.0% · 12mo
- Down + closing
- —
- Monthly P&I
- —
- Monthly cashflow
- —
- DSCR
- —
- Eligible?
- —
Short-term bridge; refi at stabilization.
Listing history 6 events
-
2026-06-21days on market $785,000 Active 90 DOM
-
2026-06-18days on market $785,000 Active 87 DOM
-
2026-06-17days on market $785,000 Active 86 DOM
-
2026-06-16days on market $785,000 Active 85 DOM
-
2026-06-15remarks 189-char remark
-
2026-06-15$785,000 Active 84 DOM
ⓘ Source: listings_history table (triggers on properties + properties_extension) + one-shot
backfill from property_details.listing_events for pre-trigger history.
Tax reassessment forecast TX · Resets to sale price
- Current annual tax
- $9,317 · $776/mo
- Projected year-2 tax
- $14,366 · $1,197/mo
- Expected delta
- +$5,048/yr (+$421/mo · 54.2%)
ⓘ Screening estimate from a state-policy table — verify with the county assessor before closing.
Climate risk First Street
- Flood 1/10 Low FEMA zone X (unshaded) · 0% chance over 30 yrs
- Wildfire 4/10 Moderate
- Heat 7/10 Severe 7 d/yr ≥109°F today · 25 d/yr by 30 yrs out
- Wind 4/10 Moderate 20% chance of damaging wind over 30 yrs
- Air quality 3/10 Moderate 3 unhealthy d/yr today · 4 by 30 yrs out
Nearby sold comps map
Loading sold comps map…
Walkable amenities ~0.75 mi
Loading nearby amenities…
Taxation est. · year 1
- Rental income
- $77,688
- − Mortgage interest
- −$43,972
- − Property taxes
- −$9,317
- − Insurance
- −$3,925
- − Repairs & maintenance
- −$6,215
- − Management
- −$6,215
- − Depreciation
- −$22,836
- Taxable loss
- −$14,793
- Est. tax savings @ 24.0%
- +$3,550
- After-tax cash flow
- $2,282/yr
For passive investors: Depreciation is non-cash, so a rental often shows a tax loss while cash-flowing — sheltering income. Rental losses are passive: they offset passive income freely, and up to $25,000/yr can offset ordinary (W-2) income if you actively participate and your MAGI is under $100k (phasing out to $0 by $150k); unused losses carry forward. On sale, claimed depreciation is recaptured at up to 25%, and gains may owe capital-gains tax (a 1031 exchange can defer both). Figures are a year-1 estimate at your 24.0% rate — not tax advice; consult a CPA.
Schools (NCES district)
- District
- Keller ISD
- NCES district ID
- 4825260
- Math proficiency
- 50% ▼ -14.00%
- Reading proficiency
- 54% ▼ -9.00%
- Median HH income
- $92,106
- Composite
- 48.46/100
- National rank
- #2131
- State rank
- #91 of 826 in TX
Livability — Keller
- Score
- 82/100
- State rank
- #15
- US rank
- #1130
Category grades
Schools grade is shown separately in the Schools card above.
Census & demographics
- Census place
- Keller, TX
- County
- Tarrant County · 2,033,669 people
- City population
- 40,936
- Metro
- Dallas-Fort Worth-Arlington, TX
- Population (ZIP)
- 40,936
- Household income
- $171,804
- Rent vs Own
- Severe rent burden
- 816.0
Population outlook (Tarrant County) Hauer SSP2
- Today (2025)
- 2,380,417 people
- By 2030
- 2,578,900 · +8.3%
- By 2040
- 2,974,995 · +25.0%
- By 2050
- 3,350,489 · +40.8%
- By 2075
- 4,216,909 · +77.2%
- By 2100
- 4,741,527 · +99.2%
Race, ethnicity, and origin ACS 2023
- Neighborhood character
- Predominantly White (76%)
- Race & ethnicity
- White 76% Hispanic / Latino 11% Two or more races 8% Asian 7% Black 3%
- Hispanic origin (detail)
- Mexican 8%
- Common ancestry
- Lithuanian 3% Italian 3% Romanian 2%
- Foreign-born
- 12% · Canada, Vietnam, China
- Languages at home
- 85% English-only · Spanish 8% Other Asian/Pacific 2% Other Indo-European 2%
Political lean MEDSL · Tarrant
- 2024 margin
- Lean R (+5.1) · D 46.7% · R 51.9% · Other 1.4%
- 2008→2024 swing
- +6.6pp toward D · 2008: -11.7pp · 2024: -5.1pp
- All cycles
- 2024: R+5.1 2020: D+0.2 2016: R+8.7 2012: R+15.7 2008: R+11.7
Not yet ingested
- Civics
- —
Market trends
- HPI YoY
- ▼ -190.93%
- Current HPI
- 265.7163
- Rent YoY
- ▲ 2.14%
- Metro
- Dallas-Fort Worth-Arlington, TX
- State GDP YoY
- ▲ 3.95%
- F500 in state
- 110
Industry mix (Fortune 500 HQ in TX)
| Industry | F500 HQs | Revenue |
|---|---|---|
| Energy | 16 | $1,198B |
|
||
| Technology | 5 | $198B |
|
||
| Engineering / Construction | 4 | $72B |
|
||
| Energy Services | 3 | $60B |
|
||
| Utilities | 3 | $41B |
|
||
| Healthcare | 2 | $330B |
|
||
Price history
+202.5% since first listed15 events — show timeline
- 2026-06-15 Price Changed $785,000 NTREIS
- 2026-06-15 Relisted — NTREIS
- 2026-01-22 Listed $745,000 NTREIS
- 2024-07-28 Rental Removed $1,495 APPFOLIO
- 2024-06-07 Listed for Rent $1,495 APPFOLIO
- 2008-08-18 Sold (Public Records) — Public Records
- 2008-08-18 Sold (MLS) — NTREIS
- 2008-07-28 Listing Removed — NTREIS
- 2008-07-10 Listed $255,000 NTREIS
- 2006-01-05 Sold (Public Records) — Public Records
- 2005-12-29 Sold (MLS) — NTREIS
- 2005-11-01 Listing Removed — NTREIS
- 2005-09-10 Listed $259,500 NTREIS
- 1987-10-14 Sold (Public Records) — Public Records
- 1986-04-03 Sold (Public Records) — Public Records
Property tax history
+3.5%/yrLatest (2025): $9,317 · -25.4% YoY. Source: county tax records.
Cash-flow waterfall
monthlySold comps — $/sqft
last 12 mo · ≤1 miLoading sold comps…