50 Sandy Brook Dr · Hamlin, NY
Flood risk 1/10 · Minimal
- FEMA flood zone
- X (unshaded)
- Chance of flooding over 30 yrs
- 0.0%
- Est. flood insurance / yr
- $507 – $1,088
Fire risk 1/10 · Minimal
- Est. fire insurance / yr
- $691 – $1,283
Heat risk 2/10 · Minimal
- Hot days now (above 95°F)
- 7 days/yr
- Hot days in 30 yrs
- 15 days/yr
Wind risk 1/10 · Minimal
- Chance of severe wind over 30 yrs
- —
Air-quality risk 2/10 · Minimal
- Unhealthy air days now
- 1 days/yr
- Unhealthy air days in 30 yrs
- 2 days/yr
Risk factors via First Street. Map © Google.
Why this score? — see what drove the B- grade
The composite is a weighted blend of 9 inputs, each scored 0–100. Each bar is that input's sub-score; the figure is the points it added to the 100-point composite (weight × sub-score).
- Cash flow +30.0/30.0
- 1% rule +10.0/10.0
- DSCR +10.0/10.0
- Schools +4.3/10.0
- Condition / age +3.8/5.0
- Livability +3.4/5.0
- Rent growth +2.5/5.0
- ARV discount +1.6/15.0
- Appreciation +0.0/10.0
$44,900
🖨 Deal sheet 📄 Offer letter ✓ Due diligence
Listing remarks MLS
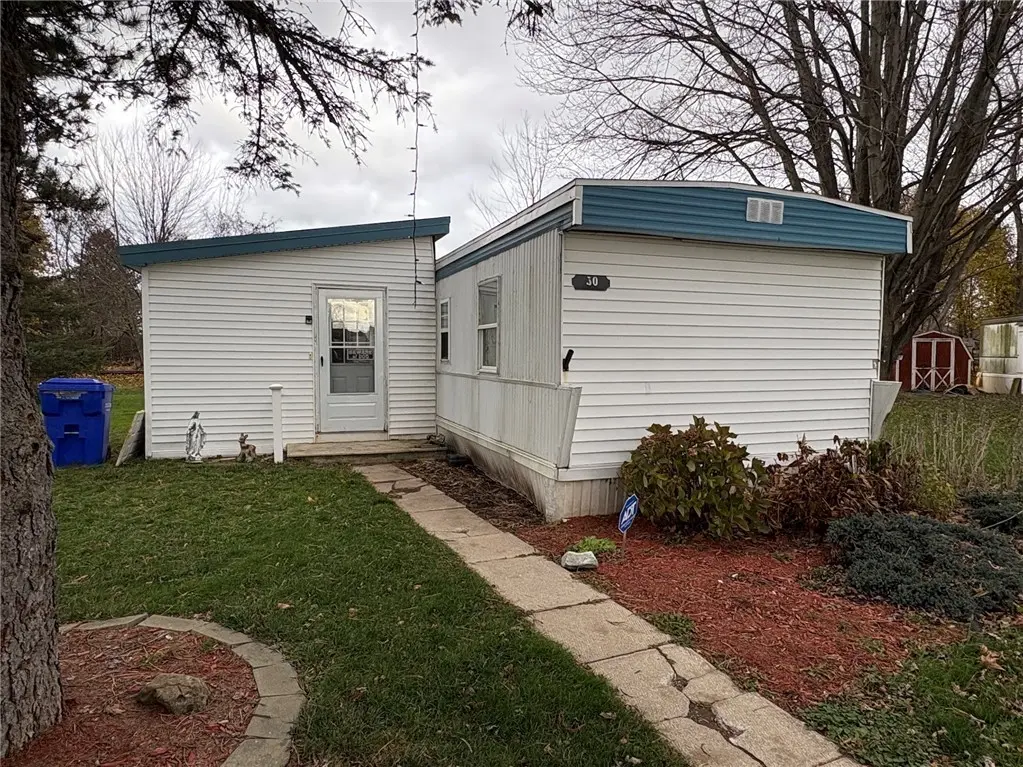
Welcome to this updated manufactured home in the Hidden Creek neighborhood, offering a flexible layout and improvements throughout. A current office can easily serve as a 3rd bedroom, and recent additions include an extra living area and a large mudroom. Updates include vinyl windows, a newer roof with transferable warranty, new R13 insulation throughout and underneath, full drywall, and a new furnace installed in 2022. Outside, you'll find two patios, an oversized storage shed and a spacious, private backyard!
Key facts
- Extra living area
- Vinyl windows
- Newer roof
Tags
Neighborhood map
What this means for you Summary
Snapshot
- This is a 2-bed/1.0-bath manufactured listed at $45k. Condition is rated good.
Deal economics
- At list price, monthly cash flow is $573 ($7k/yr) — positive.
- The deal already cash-flows at list — no discount required.
- Meets the 1% rule at list price ($1k rent vs $45k).
- Recommended offer: $41k (9.0% below list) — sets the bar for market timing.
- Cap rate 21.6% vs local median 4.1% in Hamlin — top-decile yield for the area; either an underpriced asset or a hidden risk that comps aren't pricing in. Stress-test before assuming the spread holds.
Location & tenants
- Location reads 68/100 on livability (#557 in NY) — a middle-class / working-renter tenant base. Strengths: housing A+, cost of living A; Watch: employment C-, crime D, schools F.
- Brockport Central School District (town): math 45% / reading 55% proficiency, ranked #369 of 590 in NY (top 62%) — acceptable for families but not a draw, mixed tenant base, ~2y average lease.
- Market conditions: 51 active listings in the ZIP; 1,169 units permitted in Monroe County in 2024 (591 in 5+ unit buildings).
Forward outlook
- Local home prices are declining (-3.0%/yr); year-one equity from $310 of loan paydown is wiped out by about $1k of value loss. Plan a longer hold.
- Monroe County population projected to shrink 6% by 2050 — rents likely to lag national; underwrite the cash flow, not the appreciation.
- At projected returns (-3.0% appreciation + 3.0% rent growth), your $13k cash investment doubles in ~3 years — after that, you're playing with house money.
Negotiation context
- It's been on market 120 days — a 9% lower offer ($41k) is reasonable based on typical stale-listing flexibility.
- 2 sale attempts; this cycle's ask has dropped $5k (10%) from the opening price — seller is motivated, your offer sets the floor, not the list.
Questions for the listing agent
- It's been on market 120 days. Have you received any prior offers? Is the seller open to a 9% concession, seller financing, or rate buy-down credit?
- Built in 1976 — when were the roof, HVAC, electrical panel, plumbing, and water heater last replaced?
- Why hasn't it sold? Are there any deal-killer items the seller is aware of (foundation, flood, title, zoning, code violations)?
- Is there a deadline driving the sale (1031 exchange, divorce, estate, relocation)? That informs how much negotiation room exists.
- Schools are F-rated, which usually means shorter tenancies and higher turnover. Who's the typical renter profile here, and what's been the actual vacancy rate?
- Crime grade is D in this area — have there been break-ins, vandalism, or insurance claims at this property in the last 3 years? What carrier currently insures it and at what premium?
- What's the average days-on-market for RENTAL listings here right now (not sales)? A rising rental-DOM trend means longer vacancies and softer asking-rent achievability than the comps imply.
- What's the recent tenant-quality profile in this submarket — average credit score on applications, eviction rate, late-payment / NSF rate, and stable-employment percentage? A property-management company in the area should have these aggregated.
- How much new for-sale + rental construction is in the pipeline within 1–3 miles? Heavy new supply typically softens prices + rents 12–24 months out; constrained supply supports both.
Investment metrics
- 1% rule
- 2.49% ✓
- Cap rate
- 21.61%
- Cash-on-cash
- 54.72%
- DSCR
- 3.43
- GRM
- 3.3
CMA / ARV
- ARV (median comp)
- $39,668
- List price
- $44,900
- Delta
- 13.19%
- Verdict
- OVERPRICED
- Comps
- 9 within 1.0 mi
Show comp detail 9 sales within ~0.75 mi
| Address | Dist | Beds/Ba | Sqft | Sold | Price | $/sf | Match |
|---|---|---|---|---|---|---|---|
| 69 Sandybrook Dr | 0.07mi | 3/1.0 (+1) | 960 (-11%) | 2mo | $38,000 | $40 | 72 |
| 349 Sandybrook Dr | 0.26mi | 3/2.0 (+1) | 1,064 (-2%) | 12mo | $55,000 | $52 | 66 |
| 49 Sandybrook Dr | 0.06mi | 3/2.0 (+1) | 952 (-12%) | 4mo | $32,000 | $34 | 66 |
| 306 Sandy Brook Dr | 0.15mi | 2/2.0 | 1,188 (+10%) | 13mo | $40,000 | $34 | 61 |
| 345 Sandy Brook Dr | 0.23mi | 3/2.0 (+1) | 952 (-12%) | 2mo | $29,777 | $31 | 58 |
| 29 Chestnut Dr | 0.52mi | 2/2.0 | 1,140 (+6%) | 10mo | $37,900 | $33 | 54 |
| 41 Roadside Dr | 0.44mi | 3/2.0 (+1) | 983 (-9%) | 5mo | $80,000 | $81 | 51 |
| 99 Locust Dr | 0.58mi | 2/1.0 | 924 (-14%) | 11mo | $39,900 | $43 | 40 |
| 5 Oak Dr | 0.56mi | 3/2.0 (+1) | 1,216 (+13%) | 20mo | $107,000 | $88 | 28 |
Match score weights: distance 35% · size 25% · config 20% · recency 20%. Top-matched comps best support the ARV.
Projected returns pro-forma
-3.0% appreciation · 3.0% rent growth · sell at horizon
- IRR
- 52.9%
- Equity multiple
- 3.33×
- Total profit
- $29,252
- Equity at exit
- $6,695
- IRR
- 58.2%
- Equity multiple
- 6.77×
- Total profit
- $72,554
- Equity at exit
- $3,882
Cash invested: $12,572 (down + closing). Projections, not guarantees.
Landlord ↔ Tenant lean methodology
- Overall (STATE)
- 15 Strongly Tenant-Friendly
- State New York
- 15 Strongly Tenant-Friendly · D+10
- County
- — inherits STATE
- City
- — inherits STATE
ZIP-level market 14464
- Home prices YoY
- -15.0%
- Active inventory
- 51
- Price-to-rent
- 3.3×
Monthly cashflow live
- Estimated rent
- $1,118 medium interval (Pro) →
- Mortgage (P&I)
- −$235
- Tax est. 1.5%
- −$56 /mo · $674/yr
- Insurance
- −$19
- HOA
- −$0
- Vacancy / Maint / Mgmt
- −$235
- Net cashflow
- $573
Break-even live
UW: 25.0% down · 7.5% · 30yr · 1.5% tax · 5.0% vac · 8.0% maint · 8.0% mgmt
Financing live
Cash to close
- Down payment
- $11,225
- Closing costs
- $1,347
- Reserves months
- —
- Total cash needed
- —
Loan-product check · same deal, 3 products live
Conventional
25% down · 7.5% · 30yr
- Down + closing
- —
- Monthly P&I
- —
- Monthly cashflow
- —
- DSCR
- —
- Eligible?
- —
Personal DTI + credit; lowest rate.
DSCR
20% down · 8.5% · 30yr
- Down + closing
- —
- Monthly P&I
- —
- Monthly cashflow
- —
- DSCR
- —
- Eligible?
- —
No personal income docs; deal must DSCR.
Hard money
10% down · 12.0% · 12mo
- Down + closing
- —
- Monthly P&I
- —
- Monthly cashflow
- —
- DSCR
- —
- Eligible?
- —
Short-term bridge; refi at stabilization.
Listing history 12 events
-
2026-06-13statusdays on market $44,900 Pending 120 DOM
-
2026-06-10days on market $44,900 Active 118 DOM
-
2026-06-09days on market $44,900 Active 117 DOM
-
2026-06-08days on market $44,900 Active 116 DOM
-
2026-06-07days on market $44,900 Active 115 DOM
-
2026-06-03days on market $44,900 Active 111 DOM
-
2026-06-03pricedays on market $44,900 Active 110 DOM
-
2026-06-01days on market $49,900 Active 109 DOM
-
2026-05-31days on market $49,900 Active 108 DOM
-
2026-05-04status Active 516-char remark
Show marketing remark (516 chars)
Welcome to this updated manufactured home in the Hidden Creek neighborhood, offering a flexible layout and improvements throughout. A current office can easily serve as a 3rd bedroom, and recent additions include an extra living area and a large mudroom. Updates include vinyl windows, a newer roof with transferable warranty, new R13 insulation throughout and underneath, full drywall, and a new furnace installed in 2022. Outside, you'll find two patios, an oversized storage shed and a spacious, private backyard!
-
2026-02-10status Pending 516-char remark
Show marketing remark (516 chars)
Welcome to this updated manufactured home in the Hidden Creek neighborhood, offering a flexible layout and improvements throughout. A current office can easily serve as a 3rd bedroom, and recent additions include an extra living area and a large mudroom. Updates include vinyl windows, a newer roof with transferable warranty, new R13 insulation throughout and underneath, full drywall, and a new furnace installed in 2022. Outside, you'll find two patios, an oversized storage shed and a spacious, private backyard!
-
2025-11-21$49,900 Active 516-char remark
Show marketing remark (516 chars)
Welcome to this updated manufactured home in the Hidden Creek neighborhood, offering a flexible layout and improvements throughout. A current office can easily serve as a 3rd bedroom, and recent additions include an extra living area and a large mudroom. Updates include vinyl windows, a newer roof with transferable warranty, new R13 insulation throughout and underneath, full drywall, and a new furnace installed in 2022. Outside, you'll find two patios, an oversized storage shed and a spacious, private backyard!
ⓘ Source: listings_history table (triggers on properties + properties_extension) + one-shot
backfill from property_details.listing_events for pre-trigger history.
Climate risk First Street
- Flood 1/10 Low FEMA zone X (unshaded) · 0% chance over 30 yrs
- Wildfire 1/10 Low
- Heat 2/10 Low 7 d/yr ≥95°F today · 15 d/yr by 30 yrs out
- Wind 1/10 Low
- Air quality 2/10 Low 1 unhealthy d/yr today · 2 by 30 yrs out
Nearby sold comps map
Loading sold comps map…
Walkable amenities ~0.75 mi
Loading nearby amenities…
Taxation est. · year 1
- Rental income
- $13,421
- − Mortgage interest
- −$2,515
- − Property taxes
- −$674
- − Insurance
- −$224
- − Repairs & maintenance
- −$1,074
- − Management
- −$1,074
- − Depreciation
- −$1,306
- Taxable income
- $6,554
- Est. tax owed @ 24.0%
- −$1,573
- After-tax cash flow
- $5,306/yr
For passive investors: Depreciation is non-cash, so a rental often shows a tax loss while cash-flowing — sheltering income. Rental losses are passive: they offset passive income freely, and up to $25,000/yr can offset ordinary (W-2) income if you actively participate and your MAGI is under $100k (phasing out to $0 by $150k); unused losses carry forward. On sale, claimed depreciation is recaptured at up to 25%, and gains may owe capital-gains tax (a 1031 exchange can defer both). Figures are a year-1 estimate at your 24.0% rate — not tax advice; consult a CPA.
Condition & rehab AI · 1 photo
This updated manufactured home in Hidden Creek is in good condition with recent improvements, making it a solid investment with potential for further value enhancement.
Value-add opportunities
- Both Painting the exterior — Enhances curb appeal and can increase both resale and rental value
- Both Landscaping improvements — Enhances curb appeal and can increase both resale and rental value
Renovation cost estimate screening
Value-add ROI direction
- Both Painting the exterior — Enhances curb appeal and can increase both resale and rental value ↑
- Both Landscaping improvements — Enhances curb appeal and can increase both resale and rental value ↑
ⓘ Cost ranges are severity-bucket heuristics (US national rule-of-thumb). Get contractor quotes + a written scope before underwriting a rehab budget.
Schools (NCES district)
- District
- Brockport Central School District
- NCES district ID
- 3605580
- Math proficiency
- 45% ▼ -14.00%
- Reading proficiency
- 55% ▲ 1.00%
- Median HH income
- $55,571
- Composite
- 43.28/100
- National rank
- #3044
- State rank
- #369 of 590 in NY
Livability — Hamlin
- Score
- 68/100
- State rank
- #557
- US rank
- #10030
Category grades
Schools grade is shown separately in the Schools card above.
Census & demographics
- Census place
- Hamlin, NY
- Population (ZIP)
- 6,725
Population outlook (Monroe County) Hauer SSP2
- Today (2025)
- 759,460 people
- By 2030
- 757,154 · -0.3%
- By 2040
- 740,644 · -2.5%
- By 2050
- 714,443 · -5.9%
- By 2075
- 645,883 · -15.0%
- By 2100
- 547,084 · -28.0%
Race, ethnicity, and origin ACS 2023
- Neighborhood character
- Predominantly White (95%)
- Race & ethnicity
- White 95% Two or more races 4% Black 2%
- Common ancestry
- Romanian 7% Slovak 4% Lithuanian 2%
- Foreign-born
- 0%
- Languages at home
- 99% English-only · Other Indo-European 1%
Political lean MEDSL · Monroe
- 2024 margin
- D (+19.1) · D 59.5% · R 40.5%
- 2008→2024 swing
- +1.4pp toward D · 2008: 17.7pp · 2024: 19.1pp
- All cycles
- 2024: D+19.1 2020: D+21.0 2016: D+14.1 2012: D+17.4 2008: D+17.7
Not yet ingested
- Civics
- —
Market trends
- HPI YoY
- ▼ -43.89%
- Current HPI
- 248.1985
- Rent YoY
- —
- Metro
- —
- State GDP YoY
- ▲ 2.60%
- F500 in state
- 92
Industry mix (Fortune 500 HQ in NY)
| Industry | F500 HQs | Revenue |
|---|---|---|
| Financial Services | 10 | $950B |
|
||
| Consumer Goods | 9 | $162B |
|
||
| Insurance | 4 | $225B |
|
||
| Telecommunications | 2 | $144B |
|
||
| Pharmaceuticals | 2 | $112B |
|
||
| Media / Entertainment | 2 | $69B |
|
||
Price history
3 events — show timeline
- 2026-05-04 Relisted — UNYREIS
- 2026-02-10 Pending — UNYREIS
- 2025-11-21 Listed $49,900 UNYREIS
Cash-flow waterfall
monthlySold comps — $/sqft
last 12 mo · ≤1 miLoading sold comps…