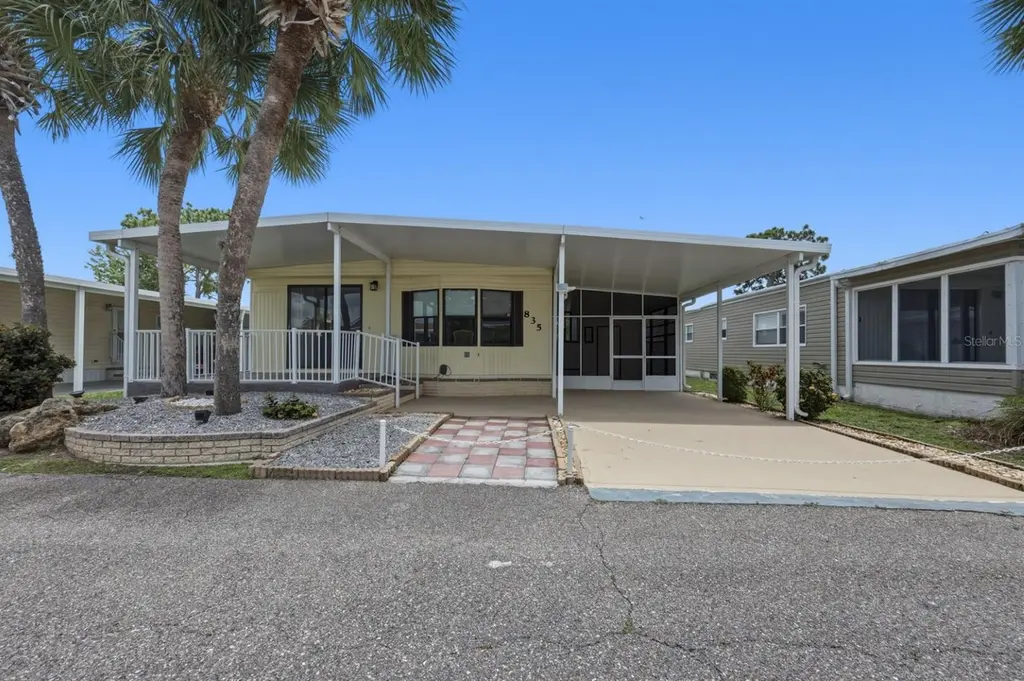
2100 Kings Hwy #835 · Port Charlotte, FL
Flood risk 5/10 · Moderate
- FEMA flood zone
- X (unshaded)
- Chance of flooding over 30 yrs
- 0.4%
- Est. flood insurance / yr
- $507 – $1,088
Fire risk 2/10 · Minimal
- Est. fire insurance / yr
- $947 – $1,759
Heat risk 10/10 · Severe
- Hot days now (above 107°F)
- 7 days/yr
- Hot days in 30 yrs
- 26 days/yr
Wind risk 10/10 · Severe
- Chance of severe wind over 30 yrs
- 99.0%
Air-quality risk 3/10 · Minor
- Unhealthy air days now
- 2 days/yr
- Unhealthy air days in 30 yrs
- 2 days/yr
Risk factors via First Street. Map © Google.
Why this score? — see what drove the D grade
The composite is a weighted blend of 9 inputs, each scored 0–100. Each bar is that input's sub-score; the figure is the points it added to the 100-point composite (weight × sub-score).
- Cash flow +16.8/30.0
- 1% rule +8.3/10.0
- DSCR +5.2/10.0
- Schools +4.6/10.0
- Livability +3.2/5.0
- Condition / age +2.5/5.0
- ARV discount +1.6/15.0
- Rent growth +1.5/5.0
- Appreciation +0.0/10.0
$139,000
🖨 Deal sheet 📄 Offer letter ✓ Due diligence
Listing remarks MLS
NICE HOME IN 55+ RESIDENT OWNED GATED COMMUNITY, 18 HOLE EXECUTIVE GOLF COURSE, COUNTRY CLUB, RESTAURANT, 3 COMMUNITY CENTERS, FITNESS CENTER, 4 SWIMMING POOLS, TENNIS, BOCCI LAWN BOWLING, MINI GOLF, HORSESHOES, SHUFFLEBOARD AND WOOD WORKING SHOP, SO MAY ACTIVITIES; TOO LITTLE TIME. PROPERTY IS FURNISHED AND READY TO MOVE IN. SOLD AS/IS WITH RIGHT TO INSPECT.
Key facts
- Premium interior lot
- Covered front patio
- Screened carport
Tags
Property features AI
Finance
- Other: Furnished; Clubhouse and community recreational facilities available
- Financial info: Total monthly fees (including association): $426; Total annual fees: $5,112; Lease restrictions apply
- HOA & community: Monthly association fee of $395; Association amenities include clubhouse, fitness center, pool, spa/hot tub, sauna, tennis and pickleball courts, shuffleboard, golf course access, recreation facilities, gated entry, security, street lights, community mailbox, deed restrictions, and private road maintenance; Association approval required; Buyer approval required to join community; Senior community; Pets allowed with restrictions
Exterior
- Parking: Covered parking; Driveway; Carport with 2 spaces
- Security: Gated community
- Utilities: Public water; Public sewer; Electricity connected; Water connected; Sewer connected; Cable available; Fiber optics available; Phone available; Underground utilities; Sprinkler recycled
- Home design: Manufactured double-wide home; Single-story; Northwest facing; Entry level: One
- Construction: Metal siding; Roof over; Crawlspace foundation; Completed condition; Built as a double wide
- Exterior features: Shed(s); In-ground heated pool; Heated spa; Paved road; Private maintained road
Interior
- Kitchen: Dishwasher; Microwave; Range hood; Refrigerator
- Bedrooms: 2 bedrooms
- Flooring: Laminate
- Bathrooms: 2 full bathrooms
- Heating & cooling: Central heating; Central air conditioning
- Interior features: Open floorplan; Sliding doors
- Laundry & utility: Washer; Dryer; Outside laundry area; Electric water heater
Neighborhood map
What this means for you Summary
Snapshot
- This is a 2-bed/2.0-bath manufactured listed at $139k.
Deal economics
- At list price, monthly cash flow is $88 ($1k/yr) — positive.
- The deal already cash-flows at list — no discount required.
- Meets the 1% rule at list price ($2k rent vs $139k).
- Cap rate 7.1% vs local median 4.4% in Port Charlotte — top-decile yield for the area; either an underpriced asset or a hidden risk that comps aren't pricing in. Stress-test before assuming the spread holds.
Location & tenants
- Location reads 65/100 on livability (#655 in FL) — a middle-class / working-renter tenant base. Strengths: cost of living A+, housing A+; Watch: employment D, amenities F, commute F.
- Charlotte (suburban): math 54% / reading 54% proficiency, ranked #22 of 73 in FL (top 30%) — acceptable for families but not a draw, mixed tenant base, ~2y average lease.
- Zoned schools: Kingsway Elementary School (math 55% / reading 53%, grade C, #936 of 2,144 statewide, top 44%, 596 students, 58% FRL); Charlotte High School (math 44% / reading 46%, grade D-, #228 of 667 statewide, top 35%, 1,994 students, 41% FRL) — zoned schools at 49% FRL track the district average.
- Market conditions: Rents falling (-4.0%/yr); 600 active listings in the ZIP; 9 comparable units currently listed for rent nearby; rentals at typical pace (median 21d on market — plan ~3-4 weeks tenant-placement turnaround); 4,585 units permitted in Charlotte County in 2024 (703 in 5+ unit buildings).
- This rent runs 35% of the median local income ($64k/yr) — at the standard rent-burdened threshold; future hikes will face affordability resistance.
Forward outlook
- Local home prices are declining (-3.0%/yr); year-one equity from $961 of loan paydown is wiped out by about $4k of value loss. Plan a longer hold.
- Charlotte County population projected at +24% by 2050 — long-run rental-demand tailwind backs the buy-and-hold thesis.
Negotiation context
- Only 14 days on market — expect competitive offers; lowballing is unlikely to land.
- 6 sale attempts since 17y ago with the ask held roughly flat each time — persistent listings suggest the price (not the market) is what's stuck; bring a comps-based counter.
- Current owner paid $67k; list at $139k implies a 107% gain — meaningful room to come down on a strong offer.
Risks & watch-outs
- Watch-outs: HOA is 23% of rent.
- Climate carrying-cost: moderate flood risk; severe wind risk, 99% chance of damaging wind over 30y; extreme-heat days projected 7→26/yr by 2055 (HVAC capex compounding) — expect insurance premiums to compound above CPI over the hold.
Questions for the listing agent
- What does the HOA fee cover, when was the last increase, and are there any pending special assessments or reserve-fund shortfalls?
- Is there a deadline driving the sale (1031 exchange, divorce, estate, relocation)? That informs how much negotiation room exists.
- Schools are D-rated, which usually means shorter tenancies and higher turnover. Who's the typical renter profile here, and what's been the actual vacancy rate?
- The area grade is low — what's the realistic commute time and amenity access for the typical tenant pool here? Any planned neighborhood developments (good or bad) we should know about?
- What's the average days-on-market for RENTAL listings here right now (not sales)? A rising rental-DOM trend means longer vacancies and softer asking-rent achievability than the comps imply.
- What's the recent tenant-quality profile in this submarket — average credit score on applications, eviction rate, late-payment / NSF rate, and stable-employment percentage? A property-management company in the area should have these aggregated.
- How much new for-sale + rental construction is in the pipeline within 1–3 miles? Heavy new supply typically softens prices + rents 12–24 months out; constrained supply supports both.
Investment metrics
- 1% rule
- 1.33% ✓
- Cap rate
- 7.06%
- Cash-on-cash
- 2.72%
- DSCR
- 1.12
- GRM
- 6.3
CMA / ARV
- ARV (on-the-fly)
- $122,880
- Comps found
- 8
Show comp detail 8 sales within ~0.75 mi
| Address | Dist | Beds/Ba | Sqft | Sold | Price | $/sf | Match |
|---|---|---|---|---|---|---|---|
| 2100 Kings Hwy #444 | 0.00mi | 2/2.0 | 1,008 (+5%) | 2mo | $118,000 | $117 | 90 |
| 2100 Kings Hwy #650 | 0.00mi | 2/2.0 | 1,056 (+10%) | 3mo | $135,000 | $128 | 81 |
| 2100 Kings Hwy #288 | 0.00mi | 2/2.0 | 864 (-10%) | 4mo | $77,500 | $90 | 80 |
| 2100 Kings Hwy #545 | 0.00mi | 2/2.0 | 864 (-10%) | 6mo | $51,000 | $59 | 78 |
| 2100 Kings Hwy #398 | 0.00mi | 2/2.0 | 1,084 (+13%) | 2mo | $160,000 | $148 | 77 |
| 2100 Kings Hwy #58 | 0.52mi | 2/2.0 | 912 (-5%) | 3mo | $125,000 | $137 | 65 |
| 2100 Kings Hwy #591 | 0.52mi | 2/2.0 | 864 (-10%) | 2mo | $105,000 | $122 | 58 |
| 2100 Kings Hwy #803 | 0.56mi | 2/2.0 | 1,008 (+5%) | 12mo | $180,000 | $179 | 55 |
Match score weights: distance 35% · size 25% · config 20% · recency 20%. Top-matched comps best support the ARV.
Projected returns pro-forma
-3.0% appreciation · 0.0% rent growth · sell at horizon
- IRR
- -16.6%
- Equity multiple
- 0.43×
- Total profit
- $-22,029
- Equity at exit
- $20,725
- IRR
- -18.7%
- Equity multiple
- 0.19×
- Total profit
- $-31,712
- Equity at exit
- $12,018
Cash invested: $38,920 (down + closing). Projections, not guarantees.
Landlord ↔ Tenant lean methodology
- Overall (STATE)
- 87 Strongly Landlord-Friendly
- State Florida
- 87 Strongly Landlord-Friendly · R+3
- County
- — inherits STATE
- City
- — inherits STATE
ZIP-level market 33980
- Home prices YoY
- -5.0%
- Rents YoY
- -4.0%
- Active inventory
- 600
- Price-to-rent
- 6.3×
Monthly cashflow live
- Estimated rent
- $1,846 high interval (Pro) →
- Mortgage (P&I)
- −$729
- Tax from tax record
- −$157 /mo · $1,889/yr
- Insurance
- −$58
- HOA
- −$426
- Vacancy / Maint / Mgmt
- −$388
- Net cashflow
- $88
Break-even live
UW: 25.0% down · 7.5% · 30yr · 1.5% tax · 5.0% vac · 8.0% maint · 8.0% mgmt
Financing live
Cash to close
- Down payment
- $34,750
- Closing costs
- $4,170
- Reserves months
- —
- Total cash needed
- —
Loan-product check · same deal, 3 products live
Conventional
25% down · 7.5% · 30yr
- Down + closing
- —
- Monthly P&I
- —
- Monthly cashflow
- —
- DSCR
- —
- Eligible?
- —
Personal DTI + credit; lowest rate.
DSCR
20% down · 8.5% · 30yr
- Down + closing
- —
- Monthly P&I
- —
- Monthly cashflow
- —
- DSCR
- —
- Eligible?
- —
No personal income docs; deal must DSCR.
Hard money
10% down · 12.0% · 12mo
- Down + closing
- —
- Monthly P&I
- —
- Monthly cashflow
- —
- DSCR
- —
- Eligible?
- —
Short-term bridge; refi at stabilization.
Rent comps 9 comps
| Address | Beds | Baths | Sqft | Rent | $/sqft | DOM | Units | Dist |
|---|---|---|---|---|---|---|---|---|
| 1999 Kings Hwy Port Charlotte, FL | 2.0 | 1.0–2.0 | 906 | $1,800 | $1.99 | 21d | 2 | 0.69mi |
| 1499 Capricorn Blvd Port Charlotte, FL | 2.0 | 2.0 | 980 | $1,495 | $1.53 | 21d | 1 | 0.70mi |
| 25225 Rampart Blvd Punta Gorda, FL | 2.0 | 2.0 | 886 | $1,925 | $2.17 | 21d | 5 | 0.81mi |
| 1200 Loveland Blvd Punta Gorda, FL | 1.0–3.0 | 1.0–2.0 | 1151 | $2,030 | $1.76 | 13d | 276 | 0.99mi |
| 2060 Willow Hammock Cir Unit D304 Punta Gorda, FL | 2.0 | 2.0 | 924 | $1,600 | $1.73 | 21d | 1 | 1.13mi |
| 2121 Heron Lake Dr #204 Punta Gorda, FL | 2.0 | 2.0 | 996 | $1,500 | $1.51 | 21d | 1 | 1.14mi |
| 25100 Sandhill Blvd Port Charlotte, FL | 2.0 | 2.0 | 860 | $1,788 | $2.08 | 21d | 2 | 1.41mi |
| 24151 Beatrix Blvd Port Charlotte, FL | 3.0 | 1.0–2.0 | 990 | $1,955 | $1.97 | 13d | 28 | 1.43mi |
| 25050 Sandhill Blvd Unit 5B1 Punta Gorda, FL | 2.0 | 2.0 | 900 | $1,500 | $1.67 | 21d | 1 | 1.46mi |
HOA detail
- Monthly dues
- $426 · $5,112/yr
- Likely covers
- poolgymsecurity
Listing history 12 events
-
2026-06-18days on market $139,000 Active 14 DOM
-
2026-06-17days on market $139,000 Active 13 DOM
-
2026-06-16days on market $139,000 Active 12 DOM
-
2026-06-15days on market $139,000 Active 11 DOM
-
2026-06-14days on market $139,000 Active 9 DOM
-
2026-06-13days on market $139,000 Active 8 DOM
-
2026-06-10days on market $139,000 Active 6 DOM
-
2026-06-09days on market $139,000 Active 5 DOM
-
2026-06-08days on market $139,000 Active 4 DOM
-
2026-06-07days on market $139,000 Active 3 DOM
-
2026-06-05remarks 695-char remark
-
2026-06-05$139,000 Active 1 DOM
ⓘ Source: listings_history table (triggers on properties + properties_extension) + one-shot
backfill from property_details.listing_events for pre-trigger history.
Tax reassessment forecast FL · Resets to sale price
- Current annual tax
- $1,889 · $157/mo
- Projected year-2 tax
- $1,889 · $157/mo
- Expected delta
- $0/yr ($0/mo · 0.0%)
ⓘ Screening estimate from a state-policy table — verify with the county assessor before closing.
Climate risk First Street
- Flood 5/10 Major FEMA zone X (unshaded) · 40% chance over 30 yrs
- Wildfire 2/10 Low
- Heat 10/10 Extreme 7 d/yr ≥107°F today · 26 d/yr by 30 yrs out
- Wind 10/10 Extreme 99% chance of damaging wind over 30 yrs
- Air quality 3/10 Moderate 2 unhealthy d/yr today · 2 by 30 yrs out
Nearby sold comps map
Loading sold comps map…
Walkable amenities ~0.75 mi
Loading nearby amenities…
Taxation est. · year 1
- Rental income
- $22,156
- − Mortgage interest
- −$7,786
- − Property taxes
- −$1,889
- − Insurance
- −$695
- − Repairs & maintenance
- −$1,772
- − Management
- −$1,772
- − HOA
- −$5,112
- − Depreciation
- −$4,044
- Taxable loss
- −$915
- Est. tax savings @ 24.0%
- +$220
- After-tax cash flow
- $1,280/yr
For passive investors: Depreciation is non-cash, so a rental often shows a tax loss while cash-flowing — sheltering income. Rental losses are passive: they offset passive income freely, and up to $25,000/yr can offset ordinary (W-2) income if you actively participate and your MAGI is under $100k (phasing out to $0 by $150k); unused losses carry forward. On sale, claimed depreciation is recaptured at up to 25%, and gains may owe capital-gains tax (a 1031 exchange can defer both). Figures are a year-1 estimate at your 24.0% rate — not tax advice; consult a CPA.
Schools (NCES district)
- District
- Charlotte
- NCES district ID
- 1200240
- Math proficiency
- 54% ▼ -6.00%
- Reading proficiency
- 54% ▼ -1.00%
- Median HH income
- $44,864
- Composite
- 45.62/100
- National rank
- #2586
- State rank
- #22 of 73 in FL
Livability — Port Charlotte
- Score
- 65/100
- State rank
- #655
- US rank
- #13081
Category grades
Schools grade is shown separately in the Schools card above.
Census & demographics
- County
- Charlotte County · 196,994 people
- City population
- 102,180
- Metro
- Punta Gorda, FL
- Population (ZIP)
- 13,120
- Household income
- $63,591
- Rent vs Own
- Severe rent burden
- 612.0
Population outlook (Charlotte County) Hauer SSP2
- Today (2025)
- 198,646 people
- By 2030
- 210,507 · +6.0%
- By 2040
- 230,857 · +16.2%
- By 2050
- 247,148 · +24.4%
- By 2075
- 281,777 · +41.8%
- By 2100
- 293,609 · +47.8%
Race, ethnicity, and origin ACS 2023
- Neighborhood character
- Predominantly White (75%)
- Race & ethnicity
- White 75% Hispanic / Latino 10% Two or more races 10% Black 9%
- Hispanic origin (detail)
- Puerto Rican 3% Cuban 2% Dominican 2%
- Common ancestry
- Romanian 5% Hispanic 4% Slovak 3%
- Foreign-born
- 16% · Canada, Jamaica
- Languages at home
- 85% English-only · Spanish 8% French/Haitian/Cajun 5% German/W. Germanic 1%
Political lean MEDSL · Charlotte
- 2024 margin
- Solid R (+34.0) · D 32.7% · R 66.7%
- 2008→2024 swing
- -26.7pp toward R · 2008: -7.2pp · 2024: -34.0pp
- All cycles
- 2024: R+34.0 2020: R+26.6 2016: R+27.8 2012: R+14.3 2008: R+7.2
Not yet ingested
- Civics
- —
Market trends
- HPI YoY
- ▼ -16.02%
- Current HPI
- 306.3331
- Rent YoY
- ▼ -4.04%
- Metro
- Punta Gorda, FL
- State GDP YoY
- ▲ 3.28%
- F500 in state
- 36
Industry mix (Fortune 500 HQ in FL)
| Industry | F500 HQs | Revenue |
|---|---|---|
| Industrial Technology | 2 | $29B |
|
||
| Insurance | 2 | $17B |
|
||
| Retail | 1 | $60B |
|
||
| Technology Distribution | 1 | $58B |
|
||
| Homebuilding | 1 | $35B |
|
||
| Technology Manufacturing | 1 | $35B |
|
||
Price history
+57.1% since first listed16 events — show timeline
- 2026-06-04 Listed $139,000 Stellar MLS as Distributed by MLS Grid
- 2026-05-16 Listing Removed — Stellar MLS as Distributed by MLS Grid
- 2026-03-10 Price Changed $146,900 Stellar MLS as Distributed by MLS Grid
- 2026-02-15 Price Changed $151,900 Stellar MLS as Distributed by MLS Grid
- 2026-01-11 Price Changed $154,900 Stellar MLS as Distributed by MLS Grid
- 2025-05-19 Listed $159,900 Stellar MLS as Distributed by MLS Grid
- 2016-03-21 Sold (MLS) $67,000 Stellar MLS as Distributed by MLS Grid
- 2016-01-21 Pending — Stellar MLS as Distributed by MLS Grid
- 2015-12-21 Price Changed $72,500 Stellar MLS as Distributed by MLS Grid
- 2015-12-15 Relisted — Stellar MLS as Distributed by MLS Grid
- 2015-12-07 Pending — Stellar MLS as Distributed by MLS Grid
- 2015-05-13 Price Changed $74,500 Stellar MLS as Distributed by MLS Grid
- 2014-11-11 Listed $78,500 Stellar MLS as Distributed by MLS Grid
- 2011-10-27 Listed $82,500 Stellar MLS as Distributed by MLS Grid
- 2011-10-25 Listing Removed — Stellar MLS as Distributed by MLS Grid
- 2009-10-08 Listed $88,500 Stellar MLS as Distributed by MLS Grid
Property tax history
+2.0%/yrLatest (2025): $1,889 · -8.2% YoY. Source: county tax records.
Cash-flow waterfall
monthlySold comps — $/sqft
last 12 mo · ≤1 miLoading sold comps…