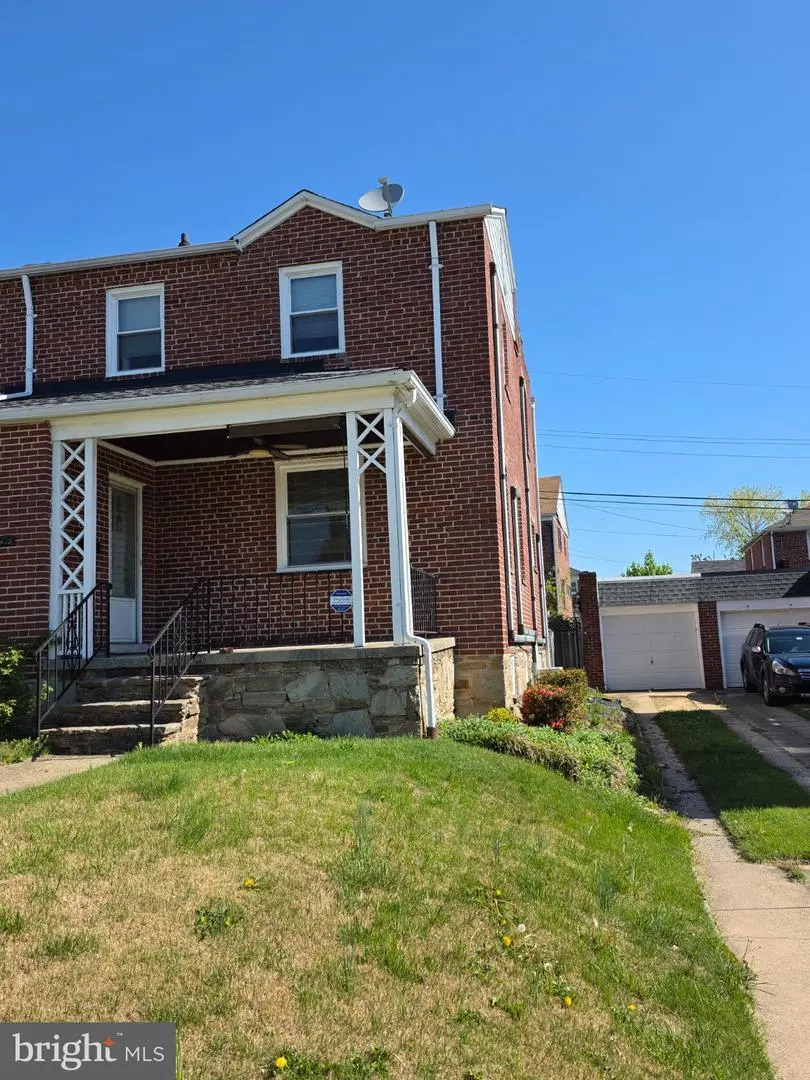
2922 Harview · Baltimore, MD
Flood risk 1/10 · Minimal
- FEMA flood zone
- X (unshaded)
- Chance of flooding over 30 yrs
- 0.0%
- Est. flood insurance / yr
- $473 – $860
Fire risk 1/10 · Minimal
- Est. fire insurance / yr
- $755 – $1,403
Heat risk 7/10 · Major
- Hot days now (above 104°F)
- 7 days/yr
- Hot days in 30 yrs
- 15 days/yr
Wind risk 6/10 · Moderate
- Chance of severe wind over 30 yrs
- 27.0%
Air-quality risk 4/10 · Minor
- Unhealthy air days now
- 5 days/yr
- Unhealthy air days in 30 yrs
- 7 days/yr
Risk factors via First Street. Map © Google.
Why this score? — see what drove the C+ grade
The composite is a weighted blend of 9 inputs, each scored 0–100. Each bar is that input's sub-score; the figure is the points it added to the 100-point composite (weight × sub-score).
- Cash flow +22.9/30.0
- ARV discount +15.0/15.0
- DSCR +7.4/10.0
- 1% rule +6.2/10.0
- Rent growth +4.2/5.0
- Livability +3.8/5.0
- Condition / age +2.5/5.0
- Schools +1.0/10.0
- Appreciation +0.0/10.0
$189,900
🖨 Deal sheet 📄 Offer letter ✓ Due diligence
Listing remarks MLS
Spacious 3 BR home in convenient location! Enjoy a backyard w/ garage and driveway. Hardwood floors and high ceilings, Built in corner hutch and gracious staircase w/ hardwood! Light and airy, replacement windows and much more! Tiled BR, Solid wood paneling in Rec Room. Fabulous workroom. Drafting table will stay. Lots of possibilities! Won't last long!
Key facts
- Solid brick
- Private driveway
- Mini-split systems
Tags
Property features AI
Finance
- Other: Ownership is fee simple; Property condition noted as below average; Below-grade finished area of 336 (assessor); Above-grade finished area of 1,392 (assessor)
Exterior
- Parking: Detached garage (front entry) with 1 garage space; Driveway parking for about 3 vehicles; Total of 4 garage/parking spaces
- Utilities: Public water; Public sewer; Electric service for cooling, heating fuel listed as electric/other
- Home design: Semi-detached home; Above-grade and below-grade finished space
- Construction: Brick construction; Concrete perimeter foundation; Estimated year built
- Exterior features: Lot dimensions approximately 34 x 92
Interior
- Bedrooms: Three bedrooms on the upper level
- Bathrooms: One full bathroom (upper level); One half bathroom (lower level)
- Heating & cooling: Radiator heating (electric/other); Ductless/mini-split cooling (electric); Electric hot water
- Interior features: Basement with daylight/partial exposure and connecting stairway; Living area information sourced from assessor
Neighborhood map
What this means for you Summary
Snapshot
- This is a 3-bed/1.0-bath townhouse listed at $190k.
Deal economics
- At list price, monthly cash flow is $335 ($4k/yr) — positive.
- The deal already cash-flows at list — no discount required.
- Meets the 1% rule at list price ($2k rent vs $190k).
- Cap rate 8.4% vs local median 6.0% in Baltimore — top-decile yield for the area; either an underpriced asset or a hidden risk that comps aren't pricing in. Stress-test before assuming the spread holds.
Location & tenants
- Location reads 76/100 on livability (#90 in MD, #3,396 nationally) — a middle-class / working-renter tenant base. Strengths: amenities A+, commute A+, housing A+; Watch: schools D, crime F.
- Baltimore City Public Schools (urban): math 7% / reading 16% proficiency, ranked #24 of 24 in MD (top 100%) — low school quality limits family demand, transient renter base, plan for 1-2y turnover; 79% free/reduced lunch — lower-income household profile, screen leases tightly.
- Market conditions: Rents rising fast (+6.7%/yr); 225 active listings in the ZIP; 27 comparable units currently listed for rent nearby; rentals lingering (median 44d on market — plan ~5-8 weeks vacancy on turnover, expect pricing pressure); 63% of comp listings sitting > 30 days — soft ceiling on asking rent; solid renter incomes; 1,273 units permitted in Baltimore city in 2024 (1,104 in 5+ unit buildings).
- This rent runs 30% of the median local income ($84k/yr) — at the standard rent-burdened threshold; future hikes will face affordability resistance.
Forward outlook
- Local home prices are declining (-3.0%/yr); year-one equity from $1k of loan paydown is wiped out by about $6k of value loss. Plan a longer hold.
- Baltimore County population projected to shrink 4% by 2050 — rents likely to lag national; underwrite the cash flow, not the appreciation.
- At projected returns (-3.0% appreciation + 6.7% rent growth), your $53k cash investment doubles in ~9 years — after that, you're playing with house money.
Negotiation context
- Only 6 days on market — expect competitive offers; lowballing is unlikely to land.
- 2 sale attempts since 23y ago with the ask held roughly flat each time — persistent listings suggest the price (not the market) is what's stuck; bring a comps-based counter.
- Current owner paid $102k; list at $190k implies a 86% gain — meaningful room to come down on a strong offer.
Risks & watch-outs
- Watch-outs: built in 1941 — expect roof / HVAC / electrical / plumbing capex.
- Climate carrying-cost: major wind risk, 27% chance of damaging wind over 30y; extreme-heat days projected 7→15/yr by 2055 (HVAC capex compounding) — expect insurance premiums to compound above CPI over the hold.
Questions for the listing agent
- Built in 1941 — when were the roof, HVAC, electrical panel, plumbing, and water heater last replaced?
- Is there a deadline driving the sale (1031 exchange, divorce, estate, relocation)? That informs how much negotiation room exists.
- Schools are D-rated, which usually means shorter tenancies and higher turnover. Who's the typical renter profile here, and what's been the actual vacancy rate?
- Crime grade is F in this area — have there been break-ins, vandalism, or insurance claims at this property in the last 3 years? What carrier currently insures it and at what premium?
- What's the average days-on-market for RENTAL listings here right now (not sales)? A rising rental-DOM trend means longer vacancies and softer asking-rent achievability than the comps imply.
- What's the recent tenant-quality profile in this submarket — average credit score on applications, eviction rate, late-payment / NSF rate, and stable-employment percentage? A property-management company in the area should have these aggregated.
- How much new for-sale + rental construction is in the pipeline within 1–3 miles? Heavy new supply typically softens prices + rents 12–24 months out; constrained supply supports both.
Investment metrics
- 1% rule
- 1.12% ✓
- Cap rate
- 8.41%
- Cash-on-cash
- 7.57%
- DSCR
- 1.34
- GRM
- 7.5
CMA / ARV
- ARV (on-the-fly)
- $276,480
- Comps found
- 12
Show comp detail 12 sales within ~0.75 mi
| Address | Dist | Beds/Ba | Sqft | Sold | Price | $/sf | Match |
|---|---|---|---|---|---|---|---|
| 2922 Harview | 0.00mi | 3/1.5 | 1,728 (0%) | 1mo | $190,000 | $110 | 97 |
| 2811 Harview Ave | 0.14mi | 2/1.5 (-1) | 1,728 (0%) | 10mo | $260,000 | $150 | 78 |
| 2901 Harview Ave | 0.07mi | 3/1.5 | 1,892 (+10%) | 2mo | $280,000 | $148 | 77 |
| 2818 Glendale Ave | 0.15mi | 3/1.0 | 1,550 (-10%) | 6mo | $160,000 | $103 | 71 |
| 2717 Kildaire Dr | 0.51mi | 3/1.5 | 1,560 (-10%) | 2mo | $264,900 | $170 | 56 |
| 7603 Daniels Ave | 0.41mi | 4/2.0 (+1) | 1,800 (+4%) | 13mo | $290,000 | $161 | 54 |
| 6910 Old Harford Rd | 0.50mi | 3/2.0 | 1,557 (-10%) | 3mo | $208,000 | $134 | 54 |
| 3126 Woodring Ave | 0.45mi | 3/1.0 | 1,500 (-13%) | 5mo | $172,780 | $115 | 53 |
| 3155 Woodring Ave | 0.52mi | 3/2.0 | 1,650 (-4%) | 14mo | $273,000 | $165 | 53 |
| 3158 Woodring Ave | 0.50mi | 3/1.5 | 1,500 (-13%) | 2mo | $239,900 | $160 | 51 |
| 3500 Northway Dr | 0.75mi | 3/2.0 | 1,800 (+4%) | 5mo | $288,500 | $160 | 50 |
| 3401 Woodring Ave | 0.67mi | 4/2.0 (+1) | 1,500 (-13%) | 11mo | $250,000 | $167 | 29 |
Match score weights: distance 35% · size 25% · config 20% · recency 20%. Top-matched comps best support the ARV.
Projected returns pro-forma
-3.0% appreciation · 6.68% rent growth · sell at horizon
- IRR
- -0.6%
- Equity multiple
- 0.98×
- Total profit
- $-1,236
- Equity at exit
- $28,315
- IRR
- 12.7%
- Equity multiple
- 2.18×
- Total profit
- $62,628
- Equity at exit
- $16,419
Cash invested: $53,172 (down + closing). Projections, not guarantees.
Landlord ↔ Tenant lean methodology
- Overall (CITY)
- 12 Strongly Tenant-Friendly
- State Maryland
- 27 Tenant-Leaning · D+14
- County
- — inherits STATE
- City Baltimore
- 12 Strongly Tenant-Friendly · D+58
ZIP-level market 21234
- Rents YoY
- 6.7%
- Active inventory
- 225
- Price-to-rent
- 7.5×
Monthly cashflow live
- Estimated rent
- $2,119 high interval (Pro) →
- Mortgage (P&I)
- −$996
- Tax from tax record
- −$264 /mo · $3,165/yr
- Insurance
- −$79
- HOA
- −$0
- Vacancy / Maint / Mgmt
- −$445
- Net cashflow
- $335
Break-even live
UW: 25.0% down · 7.5% · 30yr · 1.5% tax · 5.0% vac · 8.0% maint · 8.0% mgmt
Financing live
Cash to close
- Down payment
- $47,475
- Closing costs
- $5,697
- Reserves months
- —
- Total cash needed
- —
Loan-product check · same deal, 3 products live
Conventional
25% down · 7.5% · 30yr
- Down + closing
- —
- Monthly P&I
- —
- Monthly cashflow
- —
- DSCR
- —
- Eligible?
- —
Personal DTI + credit; lowest rate.
DSCR
20% down · 8.5% · 30yr
- Down + closing
- —
- Monthly P&I
- —
- Monthly cashflow
- —
- DSCR
- —
- Eligible?
- —
No personal income docs; deal must DSCR.
Hard money
10% down · 12.0% · 12mo
- Down + closing
- —
- Monthly P&I
- —
- Monthly cashflow
- —
- DSCR
- —
- Eligible?
- —
Short-term bridge; refi at stabilization.
Rent comps 27 comps
| Address | Beds | Baths | Sqft | Rent | $/sqft | DOM | Units | Dist |
|---|---|---|---|---|---|---|---|---|
| 3108 Glendale Ave Parkville, MD | 3.0 | 3.0 | 1224 | $2,550 | $2.08 | 23d | 1 | 0.19mi |
| 2518 Linwood Rd Parkville, MD | 3.0 | 1.5 | 1946 | $2,200 | $1.13 | 16d | 1 | 0.44mi |
| 3026 Lavender Ave Parkville, MD | 2.0 | 2.0 | 2000 | $1,850 | $0.93 | 23d | 1 | 0.45mi |
| 3158 Woodring Ave Parkville, MD | 3.0 | 1.5 | 1500 | $1,950 | $1.30 | 23d | 1 | 0.50mi |
| 2518 Moore Ave Parkville, MD | 4.0 | 1.5 | 1896 | $2,700 | $1.42 | 43d | 1 | 0.52mi |
| 2528 Wendover Rd Unit a Parkville, MD | 2.0 | 2.0 | 1704 | $1,950 | $1.14 | 43d | 1 | 0.59mi |
| 7839 Birmingham Ave Parkville, MD | 3.0 | 1.0 | 1136 | $1,775 | $1.56 | 43d | 1 | 0.78mi |
| 8204 Old Harford Rd Unit 2 Parkville, MD | 2.0 | 1.0 | 1146 | $1,850 | $1.61 | 43d | 1 | 0.78mi |
| 3412 Fleetwood Ave Baltimore, MD | 3.0 | 2.5 | 1620 | $2,195 | $1.35 | 43d | 1 | 0.79mi |
| 8206 Old Harford Rd Unit 2 Parkville, MD | 2.0 | 1.0 | 1146 | $1,850 | $1.61 | 43d | 1 | 0.79mi |
| 8206 Old Harford Rd Unit 1 Parkville, MD | 2.0 | 1.0 | 1146 | $1,750 | $1.53 | 43d | 1 | 0.79mi |
| 6612 Birchwood Ave Baltimore, MD | 3.0 | 2.0 | 1122 | $2,300 | $2.05 | 19d | 1 | 0.84mi |
| 6410 Walther Ave Baltimore, MD | 2.0 | 1.0–2.0 | 1195 | $1,995 | $1.67 | 43d | 7 | 0.96mi |
| 2804 Christopher Ave Baltimore, MD | 3.0 | 2.5 | 1280 | $2,200 | $1.72 | 23d | 1 | 1.01mi |
| 35-C Mopec Cir Nottingham, MD | 2.0 | 1.0 | 1100 | $1,445 | $1.31 | 2d | 10 | 1.04mi |
| 1629 Wentworth Ave Parkville, MD | 3.0 | 1.5 | 1152 | $1,895 | $1.64 | 43d | 1 | 1.14mi |
| 7202 Sindall Rd Unit 7202 Parkville, MD | 3.0 | 1.0 | 1350 | $1,850 | $1.37 | 43d | 1 | 1.15mi |
| 8503 Kings Ridge Rd Parkville, MD | 4.0 | 2.0 | 1200 | $2,100 | $1.75 | 4d | 1 | 1.16mi |
| 8500 Arry Pl Parkville, MD | 3.0 | 2.5 | 2100 | $2,500 | $1.19 | 43d | 1 | 1.18mi |
| 1376 Halstead Rd Parkville, MD | 3.0 | 1.0 | 1440 | $2,400 | $1.67 | 23d | 1 | 1.24mi |
| 7605 Hillendale Rd Parkville, MD | 2.0 | 1.0 | 1050 | $1,255 | $1.20 | 43d | 1 | 1.25mi |
| 5 Belhaven Dr Nottingham, MD | 4.0 | 1.5 | 1554 | $2,000 | $1.29 | 43d | 1 | 1.40mi |
| 2805 Hamilton Ave Baltimore, MD | 4.0 | 2.0 | 1416 | $2,300 | $1.62 | 43d | 1 | 1.43mi |
| 2106 Cloville Ave Baltimore, MD | 3.0 | 1.5 | 1080 | $1,700 | $1.57 | 43d | 1 | 1.43mi |
| 3617 Double Rock Ln Parkville, MD | 3.0 | 2.5 | 2000 | $2,395 | $1.20 | 4d | 1 | 1.44mi |
| 1329 Taylor Ave Parkville, MD | 2.0 | 1.0 | 1636 | $1,599 | $0.98 | 43d | 1 | 1.49mi |
| 1127 Deanwood Rd Parkville, MD | 3.0 | 2.0 | 1730 | $2,350 | $1.36 | 43d | 1 | 1.50mi |
Listing history 7 events
-
2026-04-29status Pending
-
2026-04-23$189,900 Active
-
2004-01-16soldstatus $102,000
-
2003-12-01soldstatus $102,000 355-char remark
Show marketing remark (355 chars)
Spacious 3 BR home in convenient location! Enjoy a backyard w/ garage and driveway. Hardwood floors and high ceilings, Built in corner hutch and gracious staircase w/ hardwood! Light and airy, replacement windows and much more! Tiled BR, Solid wood paneling in Rec Room. Fabulous workroom. Drafting table will stay. Lots of possibilities! Won't last long!
-
2003-10-19historical 355-char remark
Show marketing remark (355 chars)
Spacious 3 BR home in convenient location! Enjoy a backyard w/ garage and driveway. Hardwood floors and high ceilings, Built in corner hutch and gracious staircase w/ hardwood! Light and airy, replacement windows and much more! Tiled BR, Solid wood paneling in Rec Room. Fabulous workroom. Drafting table will stay. Lots of possibilities! Won't last long!
-
2003-10-15$103,900 355-char remark
Show marketing remark (355 chars)
Spacious 3 BR home in convenient location! Enjoy a backyard w/ garage and driveway. Hardwood floors and high ceilings, Built in corner hutch and gracious staircase w/ hardwood! Light and airy, replacement windows and much more! Tiled BR, Solid wood paneling in Rec Room. Fabulous workroom. Drafting table will stay. Lots of possibilities! Won't last long!
-
1993-09-23soldstatus $75,000
ⓘ Source: listings_history table (triggers on properties + properties_extension) + one-shot
backfill from property_details.listing_events for pre-trigger history.
Tax reassessment forecast MD · Partial reset (capped growth)
- Current annual tax
- $3,165 · $264/mo
- Projected year-2 tax
- $3,165 · $264/mo
- Expected delta
- $0/yr ($0/mo · 0.0%)
ⓘ Screening estimate from a state-policy table — verify with the county assessor before closing.
Climate risk First Street
- Flood 1/10 Low FEMA zone X (unshaded) · 0% chance over 30 yrs
- Wildfire 1/10 Low
- Heat 7/10 Severe 7 d/yr ≥104°F today · 15 d/yr by 30 yrs out
- Wind 6/10 Major 27% chance of damaging wind over 30 yrs
- Air quality 4/10 Moderate 5 unhealthy d/yr today · 7 by 30 yrs out
Nearby sold comps map
Loading sold comps map…
Walkable amenities ~0.75 mi
Loading nearby amenities…
Taxation est. · year 1
- Rental income
- $25,428
- − Mortgage interest
- −$10,637
- − Property taxes
- −$3,165
- − Insurance
- −$950
- − Repairs & maintenance
- −$2,034
- − Management
- −$2,034
- − Depreciation
- −$5,524
- Taxable income
- $1,083
- Est. tax owed @ 24.0%
- −$260
- After-tax cash flow
- $3,763/yr
For passive investors: Depreciation is non-cash, so a rental often shows a tax loss while cash-flowing — sheltering income. Rental losses are passive: they offset passive income freely, and up to $25,000/yr can offset ordinary (W-2) income if you actively participate and your MAGI is under $100k (phasing out to $0 by $150k); unused losses carry forward. On sale, claimed depreciation is recaptured at up to 25%, and gains may owe capital-gains tax (a 1031 exchange can defer both). Figures are a year-1 estimate at your 24.0% rate — not tax advice; consult a CPA.
Schools (NCES district)
- District
- Baltimore City Public Schools
- NCES district ID
- 2400090
- Math proficiency
- 7% ▼ -9.00%
- Reading proficiency
- 16% ▼ -5.00%
- Median HH income
- $42,108
- Composite
- 10.08/100
- National rank
- #9805
- State rank
- #24 of 24 in MD
Livability — Baltimore
- Score
- 76/100
- State rank
- #90
- US rank
- #3396
Category grades
Schools grade is shown separately in the Schools card above.
Census & demographics
- Census place
- Baltimore, MD
- County
- Baltimore County · 769,527 people
- City population
- 588,727
- Metro
- Baltimore-Columbia-Towson, MD
- Population (ZIP)
- 66,334
- Household income
- $83,517
- Rent vs Own
- Severe rent burden
- 2719.0
Population outlook (Baltimore County) Hauer SSP2
- Today (2025)
- 624,249 people
- By 2030
- 621,541 · -0.4%
- By 2040
- 609,756 · -2.3%
- By 2050
- 597,249 · -4.3%
- By 2075
- 552,236 · -11.5%
- By 2100
- 513,934 · -17.7%
Race, ethnicity, and origin ACS 2023
- Neighborhood character
- Diverse neighborhood (Simpson 0.58)
- Race & ethnicity
- White 58% Black 28% Asian 5% Hispanic / Latino 5% Two or more races 5%
- Common ancestry
- Romanian 5% Lithuanian 1% Italian 1%
- Foreign-born
- 10% · Canada, China, South Korea
- Languages at home
- 89% English-only · Spanish 3% Other Indo-European 2% Tagalog/Filipino 1%
Political lean MEDSL · Baltimore
- 2024 margin
- Solid D (+73.0) · D 85.2% · R 12.2% · Other 2.6%
- 2008→2024 swing
- -2.5pp toward R · 2008: 75.5pp · 2024: 73.0pp
- All cycles
- 2024: D+73.0 2020: D+76.6 2016: D+74.6 2012: D+76.4 2008: D+75.5
Not yet ingested
- Civics
- —
Market trends
- HPI YoY
- ▼ -247.04%
- Current HPI
- 254.3824
- Rent YoY
- ▲ 6.68%
- Metro
- Baltimore-Columbia-Towson, MD
- State GDP YoY
- ▲ 2.97%
- F500 in state
- 12
Industry mix (Fortune 500 HQ in MD)
| Industry | F500 HQs | Revenue |
|---|---|---|
| Aerospace / Defense | 1 | $71B |
|
||
| Utilities | 1 | $25B |
|
||
| Hotels | 1 | $24B |
|
||
| Consumer Goods | 1 | $7B |
|
||
| Real Estate | 1 | $6B |
|
||
| Chemicals | 1 | $2B |
|
||
Price history
+153.2% since first listed7 events — show timeline
- 2026-04-29 Pending — BRIGHT MLS
- 2026-04-23 Listed $189,900 BRIGHT MLS
- 2004-01-16 Sold (Public Records) $102,000 Public Records
- 2003-12-01 Sold (MLS) $102,000 MRIS
- 2003-10-19 Delisted — MRIS
- 2003-10-15 Listed $103,900 MRIS
- 1993-09-23 Sold (Public Records) $75,000 Public Records
Property tax history
-1.1%/yrLatest (2025): $3,165 · +2.8% YoY. Source: county tax records.
Cash-flow waterfall
monthlySold comps — $/sqft
last 12 mo · ≤1 miLoading sold comps…