 Multi-family
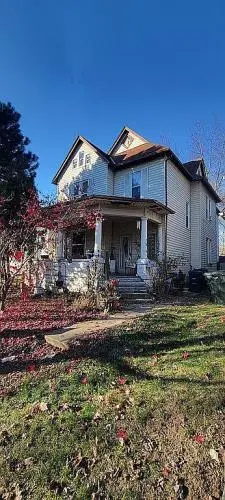
1005 Pennsylvania Ave · Columbus, OH
Flood risk 1/10 · Minimal
- FEMA flood zone
- X (unshaded)
- Chance of flooding over 30 yrs
- 0.0%
- Est. flood insurance / yr
- $473 – $860
Fire risk 1/10 · Minimal
- Est. fire insurance / yr
- $713 – $1,323
Heat risk 4/10 · Minor
- Hot days now (above 100°F)
- 7 days/yr
- Hot days in 30 yrs
- 18 days/yr
Wind risk 2/10 · Minimal
- Chance of severe wind over 30 yrs
- 1.0%
Air-quality risk 3/10 · Minor
- Unhealthy air days now
- 2 days/yr
- Unhealthy air days in 30 yrs
- 4 days/yr
Risk factors via First Street. Map © Google.
Why this score? — see what drove the D grade
The composite is a weighted blend of 9 inputs, each scored 0–100. Each bar is that input's sub-score; the figure is the points it added to the 100-point composite (weight × sub-score).
- ARV discount +15.0/15.0
- Cash flow +10.3/30.0
- Livability +4.0/5.0
- Rent growth +3.0/5.0
- DSCR +2.9/10.0
- 1% rule +2.7/10.0
- Condition / age +2.5/5.0
- Schools +1.7/10.0
- Appreciation +0.0/10.0
$499,000
🖨 Deal sheet 📄 Offer letter ✓ Due diligence
Multi-family units
County records classify this as Multi-Family (2-4 Unit). Listing-text estimate: 1 unit. estimate disagrees with records
Listing remarks MLS
It needs a little work, but can turn a big profit if flipped. My mom has lived in this house for over 20 years. She loved the safe neighborhood.
Key facts
- 3 garage spots
- Built 1910
- Listed 173 days
Neighborhood map
What this means for you Summary
Snapshot
- This is a 3-bed/2.0-bath multifamily listed at $499k.
Deal economics
- At list price, monthly cash flow is $-278 ($-3k/yr) — negative.
- To cash-flow at today's rent, offer at most $450k (9.8% below list).
- To meet the 1% rule (rent ≥ 1% of price), the offer needs to be $384k (23.1% below list).
- Recommended offer: $384k (23.1% below list) — sets the bar for 1% rule.
- Cap rate 5.6% vs local median 3.8% in Columbus — top-decile yield for the area; either an underpriced asset or a hidden risk that comps aren't pricing in. Stress-test before assuming the spread holds.
Location & tenants
- Location reads 81/100 on livability (#97 in OH, #1,491 nationally) — a professional / high-income tenant draw. Strengths: commute A+, cost of living A+, housing A+; Watch: employment C-, crime F.
- Columbus City School District (urban): math 15% / reading 26% proficiency, ranked #626 of 656 in OH (top 95%) — low school quality limits family demand, transient renter base, plan for 1-2y turnover; 72% free/reduced lunch — lower-income household profile, screen leases tightly.
- Market conditions: Rents rising (+2.1%/yr); 136 active listings in the ZIP; 15 comparable units currently listed for rent nearby; rentals at typical pace (median 17d on market — plan ~3-4 weeks tenant-placement turnaround); lower-income renter base — watch delinquency; 8,139 units permitted in Franklin County in 2024 (5,940 in 5+ unit buildings).
- At $3,839/mo this rent would consume 105% of the median local household income ($44k/yr) (locally 4913% of renters already pay >50% of income on rent) — very limited rent-growth headroom before tenants either downsize or default.
Forward outlook
- Local home prices are declining (-3.0%/yr); year-one equity from $3k of loan paydown is wiped out by about $15k of value loss. Plan a longer hold.
- Franklin County population projected at +34% by 2050 — long-run rental-demand tailwind backs the buy-and-hold thesis.
Negotiation context
- It's been on market 173 days — a 12% lower offer ($439k) is reasonable based on typical stale-listing flexibility.
- Current owner paid $315k; list at $499k implies a 58% gain — meaningful room to come down on a strong offer.
Risks & watch-outs
- Watch-outs: built in 1910 — expect roof / HVAC / electrical / plumbing capex.
Questions for the listing agent
- What do current leases actually rent for vs. the listed asking? Can we see a recent rent roll and the last 12 months of T-12 income?
- It's been on market 173 days. Have you received any prior offers? Is the seller open to a 23% concession, seller financing, or rate buy-down credit?
- Built in 1910 — when were the roof, HVAC, electrical panel, plumbing, and water heater last replaced?
- Why hasn't it sold? Are there any deal-killer items the seller is aware of (foundation, flood, title, zoning, code violations)?
- Is there a deadline driving the sale (1031 exchange, divorce, estate, relocation)? That informs how much negotiation room exists.
- Crime grade is F in this area — have there been break-ins, vandalism, or insurance claims at this property in the last 3 years? What carrier currently insures it and at what premium?
- The area grade is low — what's the realistic commute time and amenity access for the typical tenant pool here? Any planned neighborhood developments (good or bad) we should know about?
- What's the average days-on-market for RENTAL listings here right now (not sales)? A rising rental-DOM trend means longer vacancies and softer asking-rent achievability than the comps imply.
- What's the recent tenant-quality profile in this submarket — average credit score on applications, eviction rate, late-payment / NSF rate, and stable-employment percentage? A property-management company in the area should have these aggregated.
- How much new apartment / multifamily construction is in the pipeline within 1–3 miles? Heavy new supply (>2% of stock underway) typically softens rents 12–24 months out; light construction supports rent growth.
Investment metrics
- 1% rule
- 0.77% ✗
- Cap rate
- 5.62%
- Cash-on-cash
- -2.39%
- DSCR
- 0.89
- GRM
- 10.8
CMA / ARV
- ARV (median comp)
- $713,982
- List price
- $499,000
- Delta
- -30.11%
- Verdict
- UNDERPRICED
- Comps
- 20 within 1.0 mi
Show comp detail 3 sales within ~0.75 mi
| Address | Dist | Beds/Ba | Sqft | Sold | Price | $/sf | Match |
|---|---|---|---|---|---|---|---|
| 613 Dennison Ave #615 | 0.61mi | 3/— | 2,726 (-6%) | 15mo | $690,000 | $253 | 49 |
| 312 Wilber Ave | 0.22mi | 4/— (+1) | 2,557 (-12%) | 21mo | $730,000 | $285 | 47 |
| 820 Park St #818 | 0.59mi | 3/— | 2,614 (-10%) | 15mo | $550,000 | $210 | 43 |
Match score weights: distance 35% · size 25% · config 20% · recency 20%. Top-matched comps best support the ARV.
Projected returns pro-forma
-3.0% appreciation · 2.14% rent growth · sell at horizon
- IRR
- -21.2%
- Equity multiple
- 0.27×
- Total profit
- $-101,879
- Equity at exit
- $74,403
- IRR
- -16.7%
- Equity multiple
- 0.11×
- Total profit
- $-124,896
- Equity at exit
- $43,144
Cash invested: $139,720 (down + closing). Projections, not guarantees.
Landlord ↔ Tenant lean methodology
- Overall (STATE)
- 73 Landlord-Friendly
- State Ohio
- 73 Landlord-Friendly · R+6
- County
- — inherits STATE
- City
- — inherits STATE
ZIP-level market 43201
- Rents YoY
- 2.1%
- Active inventory
- 136
- Price-to-rent
- 10.8×
Monthly cashflow live
- Estimated rent
- $3,839 high interval (Pro) →
- Mortgage (P&I)
- −$2,617
- Tax from tax record
- −$486 /mo · $5,829/yr
- Insurance
- −$208
- HOA
- −$0
- Vacancy / Maint / Mgmt
- −$806
- Net cashflow
- $-278
Break-even live
UW: 25.0% down · 7.5% · 30yr · 1.5% tax · 5.0% vac · 8.0% maint · 8.0% mgmt
Financing live
Cash to close
- Down payment
- $124,750
- Closing costs
- $14,970
- Reserves months
- —
- Total cash needed
- —
Loan-product check · same deal, 3 products live
Conventional
25% down · 7.5% · 30yr
- Down + closing
- —
- Monthly P&I
- —
- Monthly cashflow
- —
- DSCR
- —
- Eligible?
- —
Personal DTI + credit; lowest rate.
DSCR
20% down · 8.5% · 30yr
- Down + closing
- —
- Monthly P&I
- —
- Monthly cashflow
- —
- DSCR
- —
- Eligible?
- —
No personal income docs; deal must DSCR.
Hard money
10% down · 12.0% · 12mo
- Down + closing
- —
- Monthly P&I
- —
- Monthly cashflow
- —
- DSCR
- —
- Eligible?
- —
Short-term bridge; refi at stabilization.
Rent comps 15 comps
| Address | Beds | Baths | Sqft | Rent | $/sqft | DOM | Units | Dist |
|---|---|---|---|---|---|---|---|---|
| 362 W 4th Ave Columbus, OH | 3.0 | 3.5 | 2000 | $3,249 | $1.62 | 23d | 1 | 0.27mi |
| 309 W 4th Ave Unit 1265630P Columbus, OH | 3.0 | 1.5 | 1991 | $5,024 | $2.52 | 2d | 1 | 0.27mi |
| 147 W Hubbard Ave Unit 149 Columbus, OH | 2.0 | 2.0 | 2101 | $3,595 | $1.71 | 7d | 1 | 0.50mi |
| 37 W 3rd Ave Columbus, OH | 4.0 | 3.5 | 2247 | $4,200 | $1.87 | 10d | 1 | 0.55mi |
| 1353 Highland St Unit D Columbus, OH | 2.0 | 1.0 | 4041 | $1,395 | $0.35 | 23d | 1 | 0.58mi |
| 640 Neil Ave Columbus, OH | 3.0 | 2.5 | 1926 | $3,350 | $1.74 | 44d | 1 | 0.59mi |
| 925 Mount Pleasant Ave Columbus, OH | 3.0 | 2.5 | 2365 | $3,700 | $1.56 | 43d | 1 | 0.67mi |
| 67 E 1st Ave Columbus, OH | 4.0 | 1.5 | 2074 | $3,200 | $1.54 | 3d | 1 | 0.73mi |
| 127 E 8th Ave Columbus, OH | 3.0 | 3.0 | 2000 | $3,800 | $1.90 | 43d | 1 | 0.98mi |
| 994 N 6th St Unit 1265652P Columbus, OH | 3.0 | 3.5 | 2895 | $6,169 | $2.13 | 7d | 1 | 0.99mi |
| 990 N 6th St Unit 1265640P Columbus, OH | 3.0 | 3.5 | 2895 | $5,553 | $1.92 | 2d | 1 | 0.99mi |
| 1027 W 6th Ave Columbus, OH | 4.0 | 2.5 | 2145 | $4,950 | $2.31 | 14d | 1 | 1.06mi |
| 250 W Spring St #1214 Columbus, OH | 2.0 | 2.5 | 2124 | $7,000 | $3.30 | 17d | 1 | 1.17mi |
| 1596 N 4th St Columbus, OH | 3.0 | 1.0 | 2736 | $1,875 | $0.69 | 43d | 1 | 1.32mi |
| 1594-1596 N 4th St Columbus, OH | 3.0 | 1.0 | 2736 | $1,875 | $0.69 | 43d | 1 | 1.32mi |
Listing history 17 events
-
2026-06-18days on market $499,000 Active 173 DOM
-
2026-06-17days on market $499,000 Active 172 DOM
-
2026-06-16days on market $499,000 Active 171 DOM
-
2026-06-15days on market $499,000 Active 170 DOM
-
2026-06-13days on market $499,000 Active 168 DOM
-
2026-06-13days on market $499,000 Active 167 DOM
-
2026-06-09days on market $499,000 Active 164 DOM
-
2026-06-08days on market $499,000 Active 163 DOM
-
2026-06-07days on market $499,000 Active 162 DOM
-
2026-06-05days on market $499,000 Active 159 DOM
-
2026-06-03days on market $499,000 Active 158 DOM
-
2026-06-02days on market $499,000 Active 157 DOM
-
2026-06-01days on market $499,000 Active 156 DOM
-
2026-05-31days on market $499,000 Active 155 DOM
-
2026-03-02soldstatus $315,000
-
2025-12-23$499,000 Active 144-char remark
Show marketing remark (144 chars)
It needs a little work, but can turn a big profit if flipped. My mom has lived in this house for over 20 years. She loved the safe neighborhood.
-
2001-07-11soldstatus $124,900
ⓘ Source: listings_history table (triggers on properties + properties_extension) + one-shot
backfill from property_details.listing_events for pre-trigger history.
Tax reassessment forecast OH · Partial reset (capped growth)
- Current annual tax
- $5,829 · $486/mo
- Projected year-2 tax
- $6,807 · $567/mo
- Expected delta
- +$978/yr (+$81/mo · 16.8%)
ⓘ Screening estimate from a state-policy table — verify with the county assessor before closing.
Climate risk First Street
- Flood 1/10 Low FEMA zone X (unshaded) · 0% chance over 30 yrs
- Wildfire 1/10 Low
- Heat 4/10 Moderate 7 d/yr ≥100°F today · 18 d/yr by 30 yrs out
- Wind 2/10 Low 100% chance of damaging wind over 30 yrs
- Air quality 3/10 Moderate 2 unhealthy d/yr today · 4 by 30 yrs out
Nearby sold comps map
Loading sold comps map…
Walkable amenities ~0.75 mi
Loading nearby amenities…
Taxation est. · year 1
- Rental income
- $46,065
- − Mortgage interest
- −$27,952
- − Property taxes
- −$5,829
- − Insurance
- −$2,495
- − Repairs & maintenance
- −$3,685
- − Management
- −$3,685
- − Depreciation
- −$14,516
- Taxable loss
- −$12,098
- Est. tax savings @ 24.0%
- +$2,903
- After-tax cash flow
- $-431/yr
For passive investors: Depreciation is non-cash, so a rental often shows a tax loss while cash-flowing — sheltering income. Rental losses are passive: they offset passive income freely, and up to $25,000/yr can offset ordinary (W-2) income if you actively participate and your MAGI is under $100k (phasing out to $0 by $150k); unused losses carry forward. On sale, claimed depreciation is recaptured at up to 25%, and gains may owe capital-gains tax (a 1031 exchange can defer both). Figures are a year-1 estimate at your 24.0% rate — not tax advice; consult a CPA.
Schools (NCES district)
- District
- Columbus City School District
- NCES district ID
- 3904380
- Math proficiency
- 15% ▼ -17.00%
- Reading proficiency
- 26% ▼ -12.00%
- Median HH income
- $38,483
- Composite
- 17.19/100
- National rank
- #9105
- State rank
- #626 of 656 in OH
Livability — Columbus
- Score
- 81/100
- State rank
- #97
- US rank
- #1491
Category grades
Schools grade is shown separately in the Schools card above.
Census & demographics
- Census place
- Columbus, OH
- County
- Franklin County · 1,351,780 people
- City population
- 612,189
- Metro
- Columbus, OH
- Population (ZIP)
- 34,322
- Household income
- $43,731
- Rent vs Own
- Severe rent burden
- 4913.0
Population outlook (Franklin County) Hauer SSP2
- Today (2025)
- 1,456,139 people
- By 2030
- 1,556,890 · +6.9%
- By 2040
- 1,757,349 · +20.7%
- By 2050
- 1,950,539 · +34.0%
- By 2075
- 2,376,171 · +63.2%
- By 2100
- 2,636,796 · +81.1%
Race, ethnicity, and origin ACS 2023
- Neighborhood character
- Predominantly White (68%)
- Race & ethnicity
- White 68% Black 14% Two or more races 8% Asian 7% Hispanic / Latino 5%
- Hispanic origin (detail)
- Mexican 1% Puerto Rican 1%
- Common ancestry
- Romanian 4% Lithuanian 2% Italian 2%
- Foreign-born
- 8% · Canada, China, Jamaica
- Languages at home
- 90% English-only · Chinese 3% Spanish 2% Other Indo-European 2%
Political lean MEDSL · Franklin
- 2024 margin
- Strong D (+28.4) · D 63.7% · R 35.3% · Other 1.0%
- 2008→2024 swing
- +7.7pp toward D · 2008: 20.7pp · 2024: 28.4pp
- All cycles
- 2024: D+28.4 2020: D+31.4 2016: D+25.9 2012: D+21.7 2008: D+20.7
Not yet ingested
- Civics
- —
Market trends
- HPI YoY
- ▼ -207.90%
- Current HPI
- 321.7282
- Rent YoY
- ▲ 2.14%
- Metro
- Columbus, OH
- State GDP YoY
- ▲ 1.98%
- F500 in state
- 48
Industry mix (Fortune 500 HQ in OH)
| Industry | F500 HQs | Revenue |
|---|---|---|
| Insurance | 3 | $145B |
|
||
| Industrial Machinery | 3 | $49B |
|
||
| Financial Services | 3 | $24B |
|
||
| Consumer Goods | 2 | $93B |
|
||
| Aerospace / Defense | 2 | $47B |
|
||
| Utilities | 2 | $33B |
|
||
Price history
+152.2% since first listed3 events — show timeline
- 2026-03-02 Sold (Public Records) $315,000 Public Records
- 2025-12-23 Listed $499,000 Fizber.com
- 2001-07-11 Sold (Public Records) $124,900 Public Records
Property tax history
+2.4%/yrLatest (2024): $5,829 · +0.8% YoY. Source: county tax records.
Cash-flow waterfall
monthlySold comps — $/sqft
last 12 mo · ≤1 miLoading sold comps…