797 Pinetree St · Slidell, LA
Flood risk No data
- FEMA flood zone
- —
- Chance of flooding over 30 yrs
- —
- Est. flood insurance / yr
- —
Fire risk No data
- Est. fire insurance / yr
- —
Heat risk No data
- Hot days now (above threshold)
- —
- Hot days in 30 yrs
- —
Wind risk No data
- Chance of severe wind over 30 yrs
- —
Air-quality risk No data
- Unhealthy air days now
- —
- Unhealthy air days in 30 yrs
- —
Risk factors via First Street. Map © Google.
Why this score? — see what drove the B+ grade
The composite is a weighted blend of 9 inputs, each scored 0–100. Each bar is that input's sub-score; the figure is the points it added to the 100-point composite (weight × sub-score).
- Cash flow +30.0/30.0
- ARV discount +15.0/15.0
- DSCR +10.0/10.0
- 1% rule +8.3/10.0
- Schools +4.3/10.0
- Livability +3.5/5.0
- Rent growth +2.9/5.0
- Condition / age +2.5/5.0
- Appreciation +0.0/10.0
$120,000
🖨 Deal sheet 📄 Offer letter ✓ Due diligence
Listing remarks MLS
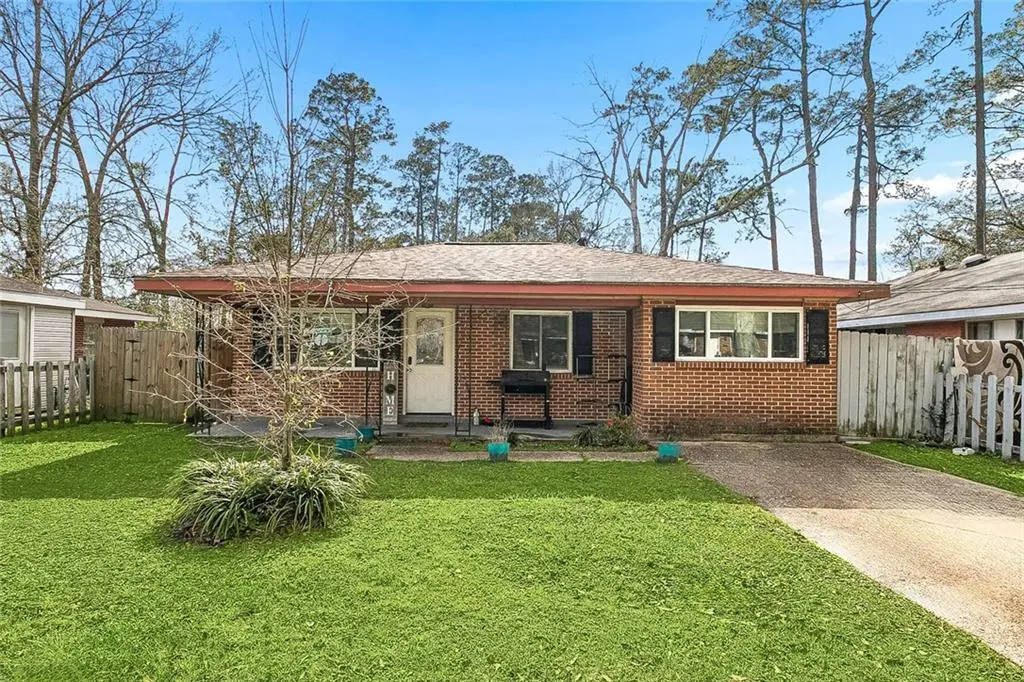
3-bedroom, 1-bath home located in a quiet neighborhood. This property offers a functional layout with good flow between the living, dining, and kitchen areas. The space is practical and easy to maintain. The home features a large backyard with plenty of room for outdoor activities, pets, or future improvements. A back patio provides a dedicated area for outdoor seating or entertaining. The front porch adds additional outdoor space and curb appeal.
Key facts
- Large backyard
- Front porch
- Back patio
Tags
Neighborhood map
What this means for you Summary
Snapshot
- This is a 3-bed/1.0-bath single-family listed at $120k.
Deal economics
- At list price, monthly cash flow is $458 ($5k/yr) — positive.
- The deal already cash-flows at list — no discount required.
- Meets the 1% rule at list price ($2k rent vs $120k).
- Recommended offer: $113k (6.0% below list) — sets the bar for market timing.
- Cap rate 10.9% vs local median 5.9% in Slidell — top-decile yield for the area; either an underpriced asset or a hidden risk that comps aren't pricing in. Stress-test before assuming the spread holds.
Location & tenants
- Location reads 70/100 on livability (#57 in LA) — a middle-class / working-renter tenant base. Strengths: cost of living A+, housing A+, health & safety A+; Watch: amenities F, commute F.
- St. Tammany Parish (suburban): math 43% / reading 55% proficiency, ranked #11 of 98 in LA (top 11%) — families likely to look elsewhere, expect single-tenant / working-renter base with shorter leases.
- Market conditions: Rents rising (+1.5%/yr); 489 active listings in the ZIP; 28 comparable units currently listed for rent nearby; rentals at typical pace (median 24d on market — plan ~3-4 weeks tenant-placement turnaround); 1,064 units permitted in St. Tammany Parish in 2024 (0 in 5+ unit buildings).
Forward outlook
- Local home prices are declining (-3.0%/yr); year-one equity from $830 of loan paydown is wiped out by about $4k of value loss. Plan a longer hold.
- St. Tammany County population projected at +27% by 2050 — long-run rental-demand tailwind backs the buy-and-hold thesis.
- At projected returns (-3.0% appreciation + 1.5% rent growth), your $34k cash investment doubles in ~9 years — after that, you're playing with house money.
Negotiation context
- It's been on market 75 days — a 6% lower offer ($113k) is reasonable based on typical stale-listing flexibility.
- 10 sale attempts since 25y ago; this cycle's ask has dropped $15k (11%) from the opening price — seller is motivated, your offer sets the floor, not the list.
- Current owner paid $86k; 40% above their basis — modest negotiation headroom, anchor on the comps not their cost.
Questions for the listing agent
- It's been on market 75 days. Have you received any prior offers? Is the seller open to a 6% concession, seller financing, or rate buy-down credit?
- Built in 1967 — when were the roof, HVAC, electrical panel, plumbing, and water heater last replaced?
- Why hasn't it sold? Are there any deal-killer items the seller is aware of (foundation, flood, title, zoning, code violations)?
- Is there a deadline driving the sale (1031 exchange, divorce, estate, relocation)? That informs how much negotiation room exists.
- Schools are B-rated — typically a magnet for longer-tenancy family renters. What's the average tenant stay here, and is there a school-zone premium baked into asking?
- What's the average days-on-market for RENTAL listings here right now (not sales)? A rising rental-DOM trend means longer vacancies and softer asking-rent achievability than the comps imply.
- What's the recent tenant-quality profile in this submarket — average credit score on applications, eviction rate, late-payment / NSF rate, and stable-employment percentage? A property-management company in the area should have these aggregated.
- How much new for-sale + rental construction is in the pipeline within 1–3 miles? Heavy new supply typically softens prices + rents 12–24 months out; constrained supply supports both.
Investment metrics
- 1% rule
- 1.33% ✓
- Cap rate
- 10.88%
- Cash-on-cash
- 16.37%
- DSCR
- 1.73
- GRM
- 6.2
CMA / ARV
- ARV (median comp)
- $147,394
- List price
- $120,000
- Delta
- -18.59%
- Verdict
- UNDERPRICED
- Comps
- 20 within 1.0 mi
Show comp detail 12 sales within ~0.75 mi
| Address | Dist | Beds/Ba | Sqft | Sold | Price | $/sf | Match |
|---|---|---|---|---|---|---|---|
| 1216 Tupelo St | 0.24mi | 3/1.0 | 1,264 (-0%) | 6mo | $130,000 | $103 | 84 |
| 2872 Slidell Ave | 0.14mi | 3/1.0 | 1,338 (+6%) | 1mo | $139,000 | $104 | 83 |
| 3046 Slidell Ave | 0.19mi | 4/1.0 (+1) | 1,253 (-1%) | 4mo | $85,000 | $68 | 80 |
| 3004 Terrace Ave | 0.45mi | 4/2.0 (+1) | 1,306 (+3%) | 2mo | $167,500 | $128 | 63 |
| 2731 Harris Ave | 0.41mi | 2/1.0 (-1) | 1,172 (-8%) | 1mo | $100,000 | $85 | 62 |
| 931 Hailey Ave | 0.19mi | 3/2.0 | 1,445 (+14%) | 2mo | $141,000 | $98 | 62 |
| 3222 Duncan St | 0.21mi | 3/2.0 | 1,100 (-13%) | 4mo | $66,200 | $60 | 61 |
| 2725 College St | 0.67mi | 2/1.5 (-1) | 1,278 (+1%) | 1mo | $179,000 | $140 | 60 |
| 328 Hickory Dr | 0.62mi | 3/1.0 | 1,350 (+6%) | 4mo | $137,000 | $101 | 56 |
| 2651 2nd St | 0.55mi | 3/2.0 | 1,184 (-7%) | 4mo | $175,000 | $148 | 56 |
| 2708 Lincoln Ave | 0.44mi | 3/2.0 | 1,394 (+10%) | 5mo | $69,900 | $50 | 54 |
| 241 Jacob Dr | 0.66mi | 2/2.0 (-1) | 1,208 (-5%) | 2mo | $89,000 | $74 | 50 |
Match score weights: distance 35% · size 25% · config 20% · recency 20%. Top-matched comps best support the ARV.
Projected returns pro-forma
-3.0% appreciation · 1.47% rent growth · sell at horizon
- IRR
- 5.7%
- Equity multiple
- 1.22×
- Total profit
- $7,325
- Equity at exit
- $17,892
- IRR
- 13.7%
- Equity multiple
- 2.02×
- Total profit
- $34,341
- Equity at exit
- $10,375
Cash invested: $33,600 (down + closing). Projections, not guarantees.
Landlord ↔ Tenant lean methodology
- Overall (STATE)
- 90 Strongly Landlord-Friendly
- State Louisiana
- 90 Strongly Landlord-Friendly · R+12
- County
- — inherits STATE
- City
- — inherits STATE
ZIP-level market 70458
- Rents YoY
- 1.5%
- Active inventory
- 489
- Price-to-rent
- 6.2×
Monthly cashflow live
- Estimated rent
- $1,602 high interval (Pro) →
- Mortgage (P&I)
- −$629
- Tax from tax record
- −$128 /mo · $1,535/yr
- Insurance
- −$50
- HOA
- −$0
- Vacancy / Maint / Mgmt
- −$336
- Net cashflow
- $458
Break-even live
UW: 25.0% down · 7.5% · 30yr · 1.5% tax · 5.0% vac · 8.0% maint · 8.0% mgmt
Financing live
Cash to close
- Down payment
- $30,000
- Closing costs
- $3,600
- Reserves months
- —
- Total cash needed
- —
Loan-product check · same deal, 3 products live
Conventional
25% down · 7.5% · 30yr
- Down + closing
- —
- Monthly P&I
- —
- Monthly cashflow
- —
- DSCR
- —
- Eligible?
- —
Personal DTI + credit; lowest rate.
DSCR
20% down · 8.5% · 30yr
- Down + closing
- —
- Monthly P&I
- —
- Monthly cashflow
- —
- DSCR
- —
- Eligible?
- —
No personal income docs; deal must DSCR.
Hard money
10% down · 12.0% · 12mo
- Down + closing
- —
- Monthly P&I
- —
- Monthly cashflow
- —
- DSCR
- —
- Eligible?
- —
Short-term bridge; refi at stabilization.
Rent comps 28 comps
| Address | Beds | Baths | Sqft | Rent | $/sqft | DOM | Units | Dist |
|---|---|---|---|---|---|---|---|---|
| 2864 Slidell Ave Slidell, LA | 3.0 | 1.0 | 963 | $1,395 | $1.45 | 3d | 1 | 0.13mi |
| 3046 Slidell Ave Slidell, LA | 4.0 | 1.0 | 1253 | $1,850 | $1.48 | 3d | 1 | 0.19mi |
| 901 Old Spanish Trl Slidell, LA | 2.0 | 1.5 | 1070 | $1,120 | $1.05 | 11d | 1 | 0.21mi |
| 3159 Dee St Slidell, LA | 3.0 | 1.0 | 898 | $1,400 | $1.56 | 43d | 1 | 0.27mi |
| 3304 Bridge Dr Slidell, LA | 3.0 | 2.0 | 1250 | $1,700 | $1.36 | 43d | 1 | 0.53mi |
| 3152 College St Slidell, LA | 3.0 | 1.0 | 1373 | $1,750 | $1.27 | 43d | 1 | 0.65mi |
| 1303 Town Center Pkwy Slidell, LA | 3.0 | 1.0–2.0 | 990 | $1,825 | $1.84 | 1d | 31 | 0.85mi |
| 172 South St Slidell, LA | 4.0 | 2.0 | 1486 | $1,800 | $1.21 | 21d | 1 | 0.85mi |
| 3839 Oxford St Slidell, LA | 3.0 | 2.0 | 1660 | $1,700 | $1.02 | 43d | 1 | 0.88mi |
| 2004 5th St Unit A Slidell, LA | 2.0 | 1.0 | 900 | $1,250 | $1.39 | 23d | 1 | 0.95mi |
| 517 Erlanger Ave Unit A Slidell, LA | 3.0 | 2.0 | 1134 | $1,375 | $1.21 | 14d | 1 | 0.97mi |
| 517 Erlanger Ave Unit A Slidell, LA | 3.0 | 2.0 | 1134 | $1,400 | $1.23 | 43d | 1 | 0.97mi |
| 516 Erlanger Ave Slidell, LA | 2.0 | 2.0 | 1250 | $1,750 | $1.40 | 43d | 1 | 1.01mi |
| 1640 Town Center Pkwy Slidell, LA | 3.0 | 1.0–2.0 | 959 | $1,895 | $1.98 | 1d | 46 | 1.01mi |
| 2001 Tenth St Unit B Slidell, LA | 3.0 | 2.0 | 1137 | $1,550 | $1.36 | 16d | 1 | 1.03mi |
| 48 Chamale Cv E Slidell, LA | 2.0 | 2.0 | 1432 | $1,650 | $1.15 | 43d | 1 | 1.11mi |
| 2009 Beth Dr Slidell, LA | 3.0 | 2.0 | 1500 | $1,750 | $1.17 | 3d | 1 | 1.12mi |
| 96 Chamale Cv Slidell, LA | 2.0 | 2.5 | 1432 | $1,500 | $1.05 | 23d | 1 | 1.14mi |
| 96 Chamale Cv Slidell, LA | 3.0 | 2.5 | 1432 | $1,500 | $1.05 | 43d | 1 | 1.14mi |
| 519 Spartan Dr #9101 Slidell, LA | 2.0 | 2.0 | 1304 | $1,400 | $1.07 | 23d | 1 | 1.22mi |
| 221 Bella Sera Ln Slidell, LA | 3.0 | 2.0 | 1028 | $1,525 | $1.48 | 11d | 1 | 1.25mi |
| 102 Spartan Trace Blvd Slidell, LA | 3.0 | 2.0 | 1516 | $2,000 | $1.32 | 23d | 1 | 1.29mi |
| 513 Michigan Ave Slidell, LA | 3.0 | 2.0 | 1250 | $1,575 | $1.26 | 23d | 1 | 1.36mi |
| 1733 Mary Dr Slidell, LA | 3.0 | 2.0 | 1349 | $1,650 | $1.22 | 43d | 1 | 1.42mi |
| 1731 Mary Dr Slidell, LA | 3.0 | 2.0 | 1200 | $1,650 | $1.38 | 3d | 1 | 1.43mi |
| 301 Spartan Dr Slidell, LA | 1.0–2.0 | 1.0–2.0 | 880 | $1,502 | $1.71 | 3d | 8 | 1.44mi |
| 57376 Beech Ave Slidell, LA | 2.0 | 1.5 | 1004 | $1,350 | $1.34 | 14d | 1 | 1.45mi |
| 57376 Beech Ave Slidell, LA | 2.0 | 1.5 | 1000 | $1,350 | $1.35 | 16d | 1 | 1.45mi |
Listing history 33 events
-
2026-06-18days on market $120,000 Active 75 DOM
-
2026-06-17days on market $120,000 Active 74 DOM
-
2026-06-16days on market $120,000 Active 73 DOM
-
2026-06-15days on market $120,000 Active 72 DOM
-
2026-06-13days on market $120,000 Active 70 DOM
-
2026-06-10days on market $120,000 Active 67 DOM
-
2026-06-09days on market $120,000 Active 66 DOM
-
2026-06-08pricedays on market $120,000 Active 65 DOM
-
2026-06-07days on market $125,000 Active 64 DOM
-
2026-06-03days on market $125,000 Active 60 DOM
-
2026-06-02days on market $125,000 Active 59 DOM
-
2026-06-01days on market $125,000 Active 58 DOM
-
2026-05-31days on market $125,000 Active 57 DOM
-
2026-05-01price $125,000 451-char remark
Show marketing remark (451 chars)
3-bedroom, 1-bath home located in a quiet neighborhood. This property offers a functional layout with good flow between the living, dining, and kitchen areas. The space is practical and easy to maintain. The home features a large backyard with plenty of room for outdoor activities, pets, or future improvements. A back patio provides a dedicated area for outdoor seating or entertaining. The front porch adds additional outdoor space and curb appeal.
-
2026-04-04$135,000 Active 451-char remark
Show marketing remark (451 chars)
3-bedroom, 1-bath home located in a quiet neighborhood. This property offers a functional layout with good flow between the living, dining, and kitchen areas. The space is practical and easy to maintain. The home features a large backyard with plenty of room for outdoor activities, pets, or future improvements. A back patio provides a dedicated area for outdoor seating or entertaining. The front porch adds additional outdoor space and curb appeal.
-
2023-05-26historical
-
2017-03-20soldstatus $86,000
-
2012-11-29soldstatus $69,700
-
2012-11-20soldstatus $69,700
-
2012-07-10$72,000
-
2012-07-10$72,000
-
2012-04-16soldstatus $36,277
-
2012-03-06$40,000
-
2012-03-06$40,000
-
2005-01-07soldstatus $82,000
-
2005-01-03soldstatus $82,000
-
2004-09-28$79,900
-
2004-09-28$79,900
-
2001-07-30soldstatus $47,000
-
2001-01-17$44,900
-
2001-01-17$44,900
ⓘ Source: listings_history table (triggers on properties + properties_extension) + one-shot
backfill from property_details.listing_events for pre-trigger history.
Tax reassessment forecast LA · Resets to sale price
- Current annual tax
- $1,535 · $128/mo
- Projected year-2 tax
- $1,535 · $128/mo
- Expected delta
- $0/yr ($0/mo · 0.0%)
ⓘ Screening estimate from a state-policy table — verify with the county assessor before closing.
Nearby sold comps map
Loading sold comps map…
Walkable amenities ~0.75 mi
Loading nearby amenities…
Taxation est. · year 1
- Rental income
- $19,223
- − Mortgage interest
- −$6,722
- − Property taxes
- −$1,535
- − Insurance
- −$600
- − Repairs & maintenance
- −$1,538
- − Management
- −$1,538
- − Depreciation
- −$3,491
- Taxable income
- $3,799
- Est. tax owed @ 24.0%
- −$912
- After-tax cash flow
- $4,588/yr
For passive investors: Depreciation is non-cash, so a rental often shows a tax loss while cash-flowing — sheltering income. Rental losses are passive: they offset passive income freely, and up to $25,000/yr can offset ordinary (W-2) income if you actively participate and your MAGI is under $100k (phasing out to $0 by $150k); unused losses carry forward. On sale, claimed depreciation is recaptured at up to 25%, and gains may owe capital-gains tax (a 1031 exchange can defer both). Figures are a year-1 estimate at your 24.0% rate — not tax advice; consult a CPA.
Schools (NCES district)
- District
- St. Tammany Parish
- NCES district ID
- 2201650
- Math proficiency
- 43% ▼ -32.00%
- Reading proficiency
- 55% ▼ -26.00%
- Median HH income
- $61,752
- Composite
- 43.04/100
- National rank
- #3098
- State rank
- #11 of 98 in LA
Livability — Slidell
- Score
- 70/100
- State rank
- #57
- US rank
- #7673
Category grades
Schools grade is shown separately in the Schools card above.
Census & demographics
- Census place
- Slidell, LA
- County
- Saint Tammany Parish · 228,296 people
- City population
- 95,511
- Metro
- New Orleans-Metairie, LA
- Population (ZIP)
- 39,034
- Household income
- $72,843
- Rent vs Own
- Severe rent burden
- 1331.0
Population outlook (St. Tammany County) Hauer SSP2
- Today (2025)
- 286,725 people
- By 2030
- 304,175 · +6.1%
- By 2040
- 336,203 · +17.3%
- By 2050
- 364,590 · +27.2%
- By 2075
- 433,362 · +51.1%
- By 2100
- 470,333 · +64.0%
Race, ethnicity, and origin ACS 2023
- Neighborhood character
- Predominantly White (66%)
- Race & ethnicity
- White 66% Black 17% Two or more races 10% Hispanic / Latino 9% Native American 2% Asian 1%
- Hispanic origin (detail)
- Mexican 3% Puerto Rican 1%
- Common ancestry
- Lithuanian 15% Slovak 2% Romanian 1%
- Foreign-born
- 3% · Canada, Vietnam
- Languages at home
- 93% English-only · Spanish 5% Vietnamese 1%
Political lean MEDSL · St. Tammany
- 2024 margin
- Solid R (+43.8) · D 27.3% · R 71.1% · Other 1.6%
- 2008→2024 swing
- +9.6pp toward D · 2008: -53.4pp · 2024: -43.8pp
- All cycles
- 2024: R+43.8 2020: R+44.2 2016: R+50.8 2012: R+52.2 2008: R+53.4
Not yet ingested
- Civics
- —
Market trends
- HPI YoY
- ▼ -173.60%
- Current HPI
- 147.4749
- Rent YoY
- ▲ 1.47%
- Metro
- New Orleans-Metairie, LA
- State GDP YoY
- ▲ 3.29%
- F500 in state
- 10
Industry mix (Fortune 500 HQ in LA)
| Industry | F500 HQs | Revenue |
|---|---|---|
| Telecommunications | 2 | $23B |
|
||
| Utilities | 1 | $12B |
|
||
| Wholesale / Distribution | 1 | $5B |
|
||
| Advertising | 1 | $2B |
|
||
Price history
+178.4% since first listed20 events — show timeline
- 2026-05-01 Price Changed $125,000 AcadianaMLS
- 2026-05-01 Price Changed $125,000 GSREIN
- 2026-04-04 Listed $135,000 GSREIN
- 2026-04-04 Listed $135,000 AcadianaMLS
- 2023-05-26 Rental Removed — GSREIN
- 2017-03-20 Sold (Public Records) $86,000 Public Records
- 2012-11-29 Sold (Public Records) $69,700 Public Records
- 2012-11-20 Sold (MLS) $69,700 GSREIN
- 2012-07-10 Listed $72,000 AcadianaMLS
- 2012-07-10 Listed $72,000 GSREIN
- 2012-04-16 Sold (MLS) $36,277 GSREIN
- 2012-03-06 Listed $40,000 AcadianaMLS
- 2012-03-06 Listed $40,000 GSREIN
- 2005-01-07 Sold (Public Records) $82,000 Public Records
- 2005-01-03 Sold (MLS) $82,000 GSREIN
- 2004-09-28 Listed $79,900 GSREIN
- 2004-09-28 Listed $79,900 AcadianaMLS
- 2001-07-30 Sold (MLS) $47,000 GSREIN
- 2001-01-17 Listed $44,900 AcadianaMLS
- 2001-01-17 Listed $44,900 GSREIN
Property tax history
+1.6%/yrLatest (2025): $1,535 · -6.2% YoY. Source: county tax records.
Cash-flow waterfall
monthlySold comps — $/sqft
last 12 mo · ≤1 miLoading sold comps…