 10-Plex
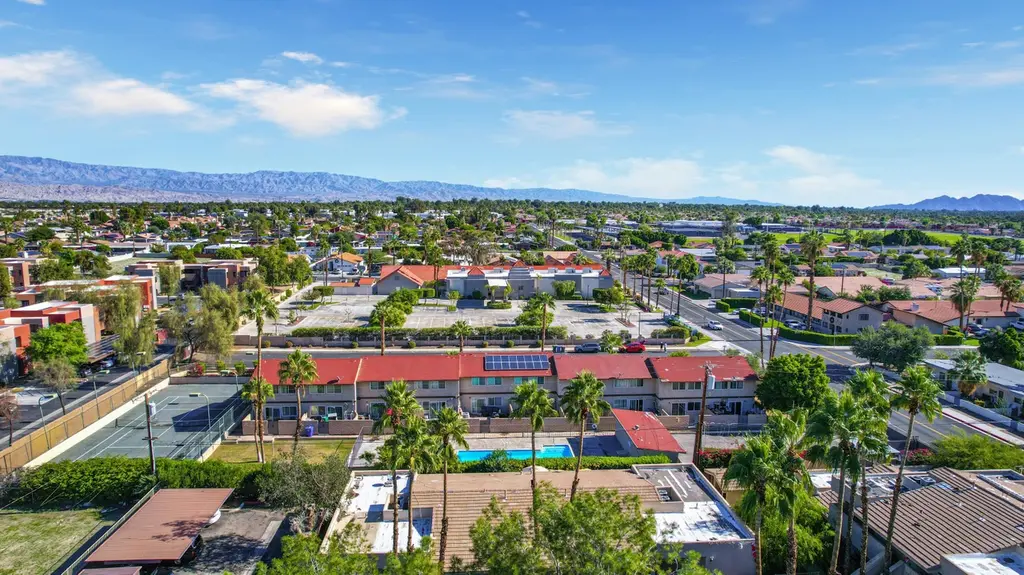
69180 Victoria Dr · Cathedral City, CA
Flood risk 1/10 · Minimal
- FEMA flood zone
- X (unshaded)
- Chance of flooding over 30 yrs
- 0.0%
- Est. flood insurance / yr
- $507 – $1,088
Fire risk 2/10 · Minimal
- Est. fire insurance / yr
- $659 – $1,223
Heat risk 9/10 · Severe
- Hot days now (above 113°F)
- 7 days/yr
- Hot days in 30 yrs
- 21 days/yr
Wind risk 1/10 · Minimal
- Chance of severe wind over 30 yrs
- —
Air-quality risk 5/10 · Moderate
- Unhealthy air days now
- 6 days/yr
- Unhealthy air days in 30 yrs
- 8 days/yr
Risk factors via First Street. Map © Google.
Why this score? — see what drove the D grade
The composite is a weighted blend of 9 inputs, each scored 0–100. Each bar is that input's sub-score; the figure is the points it added to the 100-point composite (weight × sub-score).
- Cash flow +13.9/30.0
- ARV discount +7.5/15.0
- DSCR +4.2/10.0
- 1% rule +3.9/10.0
- Rent growth +3.3/5.0
- Livability +3.3/5.0
- Schools +2.7/10.0
- Condition / age +2.5/5.0
- Appreciation +0.0/10.0
$2,949,000
🖨 Deal sheet (PDF) 📄 Offer letter ✓ Due diligence
Multi-family units
County records classify this as Multi-Family (5+ Unit). Listing-text estimate: 10 units. confirmed
5+ unit building — per-unit beds/baths from public records are typically unavailable; the breakdown below (if shown) is an estimate from the listing text.
Listing remarks MLS
This fully leased, ten-unit property features spacious three-bedroom, two-bath residences averaging approximately 1,230 square feet--each equipped with in-unit laundry, private patios, and covered carport parking. Residents enjoy a premier amenity package, including a resort-style pool and tennis court, all on a well-maintained 0.8-acre site. Strategically located just off the Rancho Mirage border, the property delivers central access to Palm Springs and Palm Desert, in a submarket characterized by increasing rents and enduring demand. Operations are optimized through separately metered utilities, tenant-paid water and trash, and solar-paned common areas, resulting in stable net operating income and low management intensity. Current collections reach an annualized $250,512 in rent and $254,512 effective gross income, supporting a strong in-place cap rate of 6% at the offering price of $2,949,000. Further value lies in the potential conversion of the existing rear ADU into an income-generating unit and the possibility for redevelopment of the tennis court area, pending buyer verification. This asset represents a rare blend of immediate yield and development upside--an attractive proposition for institutional and private investors seeking both stable returns and long-range growth in one of Southern California's most resilient rental markets.
Key facts
- Tennis court
- Resort style pool
- Well maintained site
Tags
Neighborhood map
What this means for you Summary
Snapshot
- This is a 10 × 3-bed/2-bath units multifamily listed at $2.95M.
Deal economics
- At list price, monthly cash flow is $342 ($4k/yr) — positive. Per door: $34/mo.
- The deal already cash-flows at list — no discount required.
- To meet the 1% rule (rent ≥ 1% of price), the offer needs to be $2.62M (11.1% below list).
- Recommended offer: $2.62M (11.1% below list) — sets the bar for 1% rule.
- Cap rate 6.4% vs local median 5.1% in Cathedral City — meaningfully above typical; check what's discounted (condition, days-on-market, listing class) to confirm the premium yield is real.
Location & tenants
- Location reads 66/100 on livability (#344 in CA) — a middle-class / working-renter tenant base. Strengths: commute A+, housing B+; Watch: employment D+, amenities D-, cost of living F.
- Palm Springs Unified (suburban): math 21% / reading 42% proficiency, ranked #328 of 517 in CA (top 63%) — families likely to look elsewhere, expect single-tenant / working-renter base with shorter leases; 73% free/reduced lunch — lower-income household profile, screen leases tightly.
- Zoned schools: Cathedral City Elementary (math 12% / reading 24%, grade F, #1,322 of 1,571 statewide, top 85%, 653 students, 98% FRL); Nellie N. Coffman Middle (953 students, 98% FRL); Cathedral City High (math 25% / reading 61%, grade F, #460 of 1,170 statewide, top 40%, 1,395 students, 98% FRL) — zoned schools average 98% FRL vs 73% district-wide (25 pts higher); higher-poverty schools than district average — tighter screening recommended.
- Market conditions: Rents rising (+3.2%/yr); 529 active listings in the ZIP; 9,195 units permitted in Riverside County in 2024 (1,512 in 5+ unit buildings).
- At $26,230/mo this rent would consume 428% of the median local household income ($74k/yr) (locally 1682% of renters already pay >50% of income on rent) — very limited rent-growth headroom before tenants either downsize or default.
Forward outlook
- Local home prices are declining (-3.0%/yr); year-one equity from $20k of loan paydown is wiped out by about $88k of value loss. Plan a longer hold.
- Riverside County population projected at +22% by 2050 — long-run rental-demand tailwind backs the buy-and-hold thesis.
Negotiation context
- It's been on market 83 days — a 6% lower offer ($2.77M) is reasonable based on typical stale-listing flexibility.
- 10 sale attempts since 23y ago with the ask held roughly flat each time — persistent listings suggest the price (not the market) is what's stuck; bring a comps-based counter.
- Current owner paid $1.95M; list at $2.95M implies a 52% gain — meaningful room to come down on a strong offer.
Risks & watch-outs
- Climate carrying-cost: extreme-heat days projected 7→21/yr by 2055 (HVAC capex compounding) — expect insurance premiums to compound above CPI over the hold.
Questions for the listing agent
- It's been on market 83 days. Have you received any prior offers? Is the seller open to a 11% concession, seller financing, or rate buy-down credit?
- Can we see the unit-by-unit rent roll, current vacancy, and any below-market leases? What's the average tenancy length?
- What capital expenditures (roof, boiler, parking lot, exteriors) have been made in the last 5 years, and what's planned in the next 2?
- Why hasn't it sold? Are there any deal-killer items the seller is aware of (foundation, flood, title, zoning, code violations)?
- Is there a deadline driving the sale (1031 exchange, divorce, estate, relocation)? That informs how much negotiation room exists.
- Schools are F-rated, which usually means shorter tenancies and higher turnover. Who's the typical renter profile here, and what's been the actual vacancy rate?
- The area grade is low — what's the realistic commute time and amenity access for the typical tenant pool here? Any planned neighborhood developments (good or bad) we should know about?
- What's the average days-on-market for RENTAL listings here right now (not sales)? A rising rental-DOM trend means longer vacancies and softer asking-rent achievability than the comps imply.
- What's the recent tenant-quality profile in this submarket — average credit score on applications, eviction rate, late-payment / NSF rate, and stable-employment percentage? A property-management company in the area should have these aggregated.
- How much new apartment / multifamily construction is in the pipeline within 1–3 miles? Heavy new supply (>2% of stock underway) typically softens rents 12–24 months out; light construction supports rent growth.
Investment metrics
- 1% rule
- 0.89% ✗
- Cap rate
- 6.43%
- Cash-on-cash
- 0.50%
- DSCR
- 1.02
- GRM
- 9.4
CMA / ARV
No comps found within radius.
Projected returns pro-forma
-3.0% appreciation · 3.22% rent growth · sell at horizon
- IRR
- -15.2%
- Equity multiple
- 0.46×
- Total profit
- $-449,879
- Equity at exit
- $439,705
- IRR
- -6.3%
- Equity multiple
- 0.59×
- Total profit
- $-338,121
- Equity at exit
- $254,976
Cash invested: $825,720 (down + closing). Projections, not guarantees.
Landlord ↔ Tenant lean methodology
- Overall (STATE)
- 18 Strongly Tenant-Friendly
- State California
- 18 Strongly Tenant-Friendly · D+13
- County
- — inherits STATE
- City
- — inherits STATE
ZIP-level market 92234
- Home prices YoY
- -27.7%
- Rents YoY
- 3.2%
- Active inventory
- 529
- Price-to-rent
- 93.7×
Monthly cashflow live
- Estimated rent
- $26,230 high interval (Pro) →
- Mortgage (P&I)
- −$15,465
- Tax est. 1.5%
- −$3,686 /mo · $44,235/yr
- Insurance
- −$1,229
- HOA
- −$0
- Vacancy / Maint / Mgmt
- −$5,508
- Net cashflow
- $342
Break-even live
Sensitivity live
| Price | -10% $2,380 | -5% $1,361 | +0% $342 | +5% $-677 | +10% $-1,696 |
|---|---|---|---|---|---|
| Rent | -10% $-1,730 | -5% $-694 | +0% $342 | +5% $1,378 | +10% $2,414 |
| Rate | -1.0pp $1,827 | -0.5pp $1,092 | base $342 | +0.5pp $-422 | +1.0pp $-1,200 |
10-unit breakdown (identical units grouped — click to expand)
| Units | Beds | Baths | Est. rent |
|---|---|---|---|
| 10× units | 3 | 2 | $26,230 |
| #1 | 3 | 2 | $2,623 |
| #2 | 3 | 2 | $2,623 |
| #3 | 3 | 2 | $2,623 |
| #4 | 3 | 2 | $2,623 |
| #5 | 3 | 2 | $2,623 |
| #6 | 3 | 2 | $2,623 |
| #7 | 3 | 2 | $2,623 |
| #8 | 3 | 2 | $2,623 |
| #9 | 3 | 2 | $2,623 |
| #10 | 3 | 2 | $2,623 |
| Total (10 units) | $26,230 | ||
UW: 25.0% down · 7.5% · 30yr · 1.5% tax · 5.0% vac · 8.0% maint · 8.0% mgmt
Financing live
Cash to close
- Down payment
- $737,250
- Closing costs
- $88,470
- Reserves months
- —
- Total cash needed
- —
Loan-product check · same deal, 3 products live
Conventional
25% down · 7.5% · 30yr
- Down + closing
- —
- Monthly P&I
- —
- Monthly cashflow
- —
- DSCR
- —
- Eligible?
- —
Personal DTI + credit; lowest rate.
DSCR
20% down · 8.5% · 30yr
- Down + closing
- —
- Monthly P&I
- —
- Monthly cashflow
- —
- DSCR
- —
- Eligible?
- —
No personal income docs; deal must DSCR.
Hard money
10% down · 12.0% · 12mo
- Down + closing
- —
- Monthly P&I
- —
- Monthly cashflow
- —
- DSCR
- —
- Eligible?
- —
Short-term bridge; refi at stabilization.
Listing history 33 events
-
2026-06-09days on market $2,949,000 Active 83 DOM
-
2026-06-08days on market $2,949,000 Active 82 DOM
-
2026-06-07days on market $2,949,000 Active 81 DOM
-
2026-06-04days on market $2,949,000 Active 78 DOM
-
2026-06-03days on market $2,949,000 Active 77 DOM
-
2026-06-02days on market $2,949,000 Active 76 DOM
-
2026-06-01days on market $2,949,000 Active 75 DOM
-
2026-05-31days on market $2,949,000 Active 74 DOM
-
2026-03-18$2,949,000 Active 1361-char remark
Show marketing remark (1361 chars)
This fully leased, ten-unit property features spacious three-bedroom, two-bath residences averaging approximately 1,230 square feet--each equipped with in-unit laundry, private patios, and covered carport parking. Residents enjoy a premier amenity package, including a resort-style pool and tennis court, all on a well-maintained 0.8-acre site. Strategically located just off the Rancho Mirage border, the property delivers central access to Palm Springs and Palm Desert, in a submarket characterized by increasing rents and enduring demand. Operations are optimized through separately metered utilities, tenant-paid water and trash, and solar-paned common areas, resulting in stable net operating income and low management intensity. Current collections reach an annualized $250,512 in rent and $254,512 effective gross income, supporting a strong in-place cap rate of 6% at the offering price of $2,949,000. Further value lies in the potential conversion of the existing rear ADU into an income-generating unit and the possibility for redevelopment of the tennis court area, pending buyer verification. This asset represents a rare blend of immediate yield and development upside--an attractive proposition for institutional and private investors seeking both stable returns and long-range growth in one of Southern California's most resilient rental markets.
-
2024-12-23historical
-
2024-08-22status Active
-
2024-08-21historical
-
2024-07-27price $3,450,000
-
2024-07-27$3,459,999 Active
-
2024-06-27historical
-
2024-04-15$4,000,000 Active
-
2024-04-10historical $2,199
-
2024-04-07historical $2,199
-
2024-03-13$2,199
-
2024-03-08price $2,199
-
2024-02-28price $2,299
-
2024-02-07$2,499
-
2018-01-16soldstatus $1,945,000 Sold
-
2018-01-16soldstatus $1,945,000 Closed
-
2018-01-16soldstatus $1,945,000
-
2017-11-12status Pending
-
2017-10-19historical Contingent
-
2016-04-26$1,950,000 Active
-
2016-04-25$1,950,000
-
2014-08-09historical
-
2014-07-12$1,075,000 Active
-
2004-01-10historical
-
2003-10-10$1,500,000
ⓘ Source: listings_history table (triggers on properties + properties_extension) + one-shot
backfill from property_details.listing_events for pre-trigger history.
Climate risk First Street
- Flood 1/10 Low FEMA zone X (unshaded) · 0% chance over 30 yrs
- Wildfire 2/10 Low
- Heat 9/10 Extreme 7 d/yr ≥113°F today · 21 d/yr by 30 yrs out
- Wind 1/10 Low
- Air quality 5/10 Major 6 unhealthy d/yr today · 8 by 30 yrs out
Nearby sold comps map
Loading sold comps map…
Walkable amenities ~0.75 mi
Loading nearby amenities…
Taxation est. · year 1
- Rental income
- $314,760
- − Mortgage interest
- −$165,190
- − Property taxes
- −$44,235
- − Insurance
- −$14,745
- − Repairs & maintenance
- −$25,181
- − Management
- −$25,181
- − Depreciation
- −$85,789
- Taxable loss
- −$45,561
- Est. tax savings @ 24.0%
- +$10,935
- After-tax cash flow
- $15,036/yr
For passive investors: Depreciation is non-cash, so a rental often shows a tax loss while cash-flowing — sheltering income. Rental losses are passive: they offset passive income freely, and up to $25,000/yr can offset ordinary (W-2) income if you actively participate and your MAGI is under $100k (phasing out to $0 by $150k); unused losses carry forward. On sale, claimed depreciation is recaptured at up to 25%, and gains may owe capital-gains tax (a 1031 exchange can defer both). Figures are a year-1 estimate at your 24.0% rate — not tax advice; consult a CPA.
Schools (NCES district)
- District
- Palm Springs Unified
- NCES district ID
- 0629550
- Math proficiency
- 21% ▼ -7.00%
- Reading proficiency
- 42% ▬ 0.00%
- Median HH income
- $43,638
- Composite
- 26.76/100
- National rank
- #7131
- State rank
- #328 of 517 in CA
Livability — Cathedral City
- Score
- 66/100
- State rank
- #344
- US rank
- #11749
Category grades
Schools grade is shown separately in the Schools card above.
Census & demographics
- Census place
- Cathedral City, CA
- County
- Riverside County · 2,287,001 people
- City population
- 52,267
- Metro
- Riverside-San Bernardino-Ontario, CA
- Population (ZIP)
- 52,267
- Household income
- $73,572
- Rent vs Own
- Severe rent burden
- 1682.0
Population outlook (Riverside County) Hauer SSP2
- Today (2025)
- 2,664,475 people
- By 2030
- 2,802,692 · +5.2%
- By 2040
- 3,050,904 · +14.5%
- By 2050
- 3,256,783 · +22.2%
- By 2075
- 3,655,058 · +37.2%
- By 2100
- 3,766,594 · +41.4%
Race, ethnicity, and origin ACS 2023
- Neighborhood character
- Diverse neighborhood (Simpson 0.56)
- Race & ethnicity
- Hispanic / Latino 59% White 30% Two or more races 27% Asian 6% Native American 2% Black 2%
- Hispanic origin (detail)
- Mexican 51%
- Common ancestry
- Lithuanian 2% Romanian 1% Italian 1%
- Foreign-born
- 28% · Canada, Vietnam
- Languages at home
- 48% English-only · Spanish 46% Tagalog/Filipino 3% Other Asian/Pacific 1%
Political lean MEDSL · Riverside
- 2024 margin
- Toss-up / Even · D 48.0% · R 49.3% · Other 2.6%
- 2008→2024 swing
- -3.6pp toward R · 2008: 2.3pp · 2024: -1.3pp
- All cycles
- 2024: R+1.3 2020: D+8.0 2016: D+4.3 2012: R+0.4 2008: D+2.3
Not yet ingested
- Civics
- —
Market trends
- HPI YoY
- ▼ -136.57%
- Current HPI
- 356.9845
- Rent YoY
- ▲ 3.22%
- Metro
- Riverside-San Bernardino-Ontario, CA
- State GDP YoY
- ▲ 3.21%
- F500 in state
- 116
Industry mix (Fortune 500 HQ in CA)
| Industry | F500 HQs | Revenue |
|---|---|---|
| Technology | 27 | $1,492B |
|
||
| Financial Services | 3 | $174B |
|
||
| Retail | 3 | $44B |
|
||
| Insurance | 3 | $26B |
|
||
| Media / Entertainment | 2 | $115B |
|
||
| Pharmaceuticals / Biotech | 2 | $62B |
|
||
Price history
+96.6% since first listed25 events — show timeline
- 2026-03-18 Listed $2,949,000 GPSMLS
- 2024-12-23 Listing Removed — CRMLS
- 2024-08-22 Relisted — CRMLS
- 2024-08-21 Listing Removed — CRMLS
- 2024-07-27 Price Changed $3,450,000 CRMLS
- 2024-07-27 Listed $3,459,999 CRMLS
- 2024-06-27 Listing Removed — GPSMLS
- 2024-04-15 Listed $4,000,000 GPSMLS
- 2024-04-10 Rental Removed $2,199 APPFOLIO
- 2024-04-07 Rental Removed $2,199 RENT.
- 2024-03-13 Listed for Rent $2,199 APPFOLIO
- 2024-03-08 Price Changed $2,199 RENT.
- 2024-02-28 Price Changed $2,299 RENT.
- 2024-02-07 Listed for Rent $2,499 RENT.
- 2018-01-16 Sold (MLS) $1,945,000 SDMLS
- 2018-01-16 Sold (MLS) $1,945,000 GPSMLS
- 2018-01-16 Sold (MLS) $1,945,000 GPSMLS
- 2017-11-12 Pending — GPSMLS
- 2017-10-19 Contingent — GPSMLS
- 2016-04-26 Listed $1,950,000 GPSMLS
- 2016-04-25 Listed $1,950,000 SDMLS
- 2014-08-09 Listing Removed — GPSMLS
- 2014-07-12 Listed $1,075,000 GPSMLS
- 2004-01-10 Listing Removed — GPSMLS
- 2003-10-10 Listed $1,500,000 GPSMLS
Cash-flow waterfall
monthlySold comps — $/sqft
last 12 mo · ≤1 miLoading sold comps…