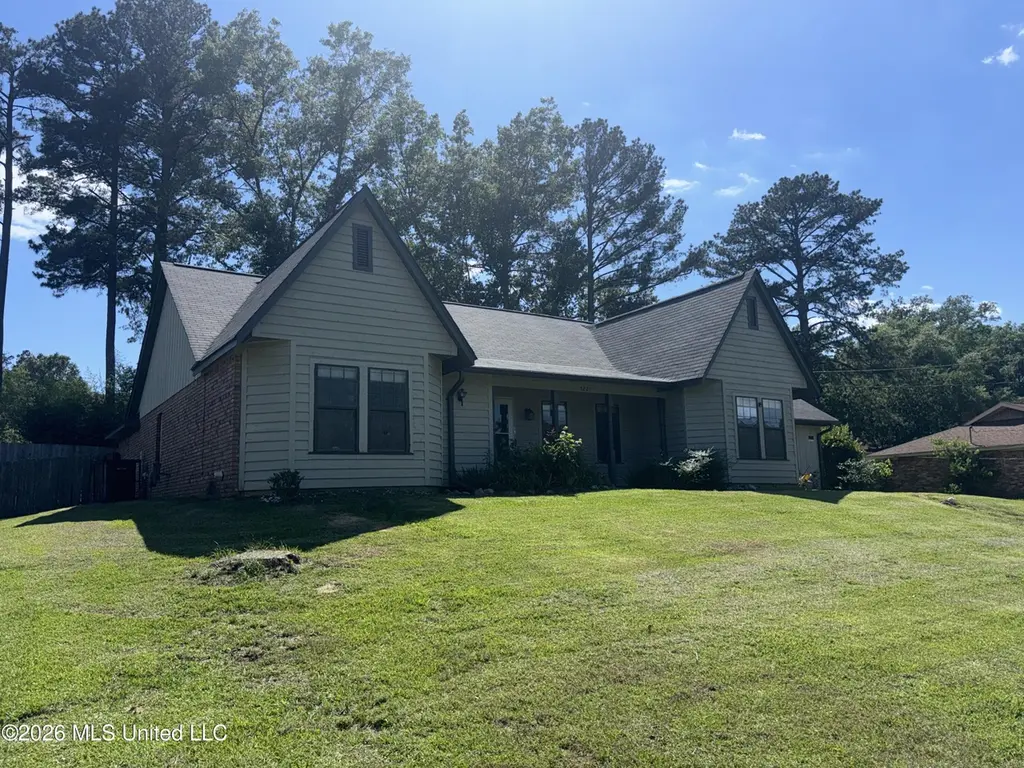
5221 Forest Hill Rd · Jackson, MS
Flood risk 1/10 · Minimal
- FEMA flood zone
- X (unshaded)
- Chance of flooding over 30 yrs
- 0.0%
- Est. flood insurance / yr
- $507 – $1,088
Fire risk 3/10 · Minor
- Est. fire insurance / yr
- $1,241 – $2,305
Heat risk 7/10 · Major
- Hot days now (above 108°F)
- 7 days/yr
- Hot days in 30 yrs
- 21 days/yr
Wind risk 8/10 · Major
- Chance of severe wind over 30 yrs
- 80.0%
Air-quality risk 1/10 · Minimal
- Unhealthy air days now
- 0 days/yr
- Unhealthy air days in 30 yrs
- 0 days/yr
Risk factors via First Street. Map © Google.
Why this score? — see what drove the D+ grade
The composite is a weighted blend of 9 inputs, each scored 0–100. Each bar is that input's sub-score; the figure is the points it added to the 100-point composite (weight × sub-score).
- ARV discount +15.0/15.0
- Cash flow +14.3/30.0
- DSCR +4.4/10.0
- 1% rule +3.4/10.0
- Livability +3.4/5.0
- Rent growth +2.5/5.0
- Condition / age +2.5/5.0
- Schools +2.4/10.0
- Appreciation +0.0/10.0
$203,000
🖨 Deal sheet 📄 Offer letter ✓ Due diligence
Listing remarks MLS
Must see this move-in-ready family home. This is a 4 bedrooms 2 bathrooms home. All bedrooms are very spacious. Master bedroom is a private suite. Has his/her closets and dual sinks. Walkin shower w/a large jacuzzi It's a split plan, with a burning wood fireplace . Two outdoor storage rooms. Covered patio. Partially Fenced HUGE backyard. Very quiet area. Kitchen has stainless steel refrigerator and dbl ovens. Also has a dishwasher. Large laundry room with plenty of cabinets and storage space. Home is located in the Hinds County School District. Gary Rd Elementary, Byram Middle School and Terry High School
Key facts
- Master suite
- Dual sinks
- His and her closets
Tags
Property features AI
Finance
- Other: Lot approximately 0.48 acre; Living area reported from public records (2,231); Property listed as move-in ready
Exterior
- Parking: 2 covered carport spaces; Driveway with concrete surface; Total 2 parking spaces
- Security: Smoke detectors
- Utilities: Public water; Public sewer; Natural gas connected; Electricity connected; Cable available; Water connected
- Home design: Single-family house; One level
- Construction: Brick and Masonite construction; Shingle/composition roof; Slab foundation; Built (year source: public records)
- Exterior features: Partial wood fencing; Slab patio/porch
Interior
- Kitchen: Cooktop; Electric cooktop; Electric range; Microwave; Dishwasher; Exhaust fan
- Flooring: Carpet; Ceramic tile; Laminate; Linoleum
- Bathrooms: 2 full bathrooms
- Heating & cooling: Central heating (natural gas); Fireplace heating; Central air; Ceiling fans
- Interior features: Cathedral ceilings; Vaulted ceiling; Ceiling fans; Entrance foyer; Double vanity; Soaking tub; Fireplace in great room and bath; Aluminum window frames; Move-in ready condition
- Laundry & utility: Electric dryer hookup; Gas water heater
Neighborhood map
What this means for you Summary
Snapshot
- This is a 4-bed/2.0-bath single-family listed at $203k.
Deal economics
- At list price, monthly cash flow is $39 ($462/yr) — positive.
- The deal already cash-flows at list — no discount required.
- To meet the 1% rule (rent ≥ 1% of price), the offer needs to be $171k (15.5% below list).
- Recommended offer: $171k (15.5% below list) — sets the bar for 1% rule.
- Cap rate 6.5% vs local median 9.9% in Jackson — below-typical yield; the buyer is paying a premium for something (appreciation thesis, condition, location) that the cap rate doesn't capture.
Location & tenants
- Location reads 68/100 on livability (#66 in MS) — a middle-class / working-renter tenant base. Strengths: commute A+, cost of living A+, housing A+; Watch: schools F, amenities F, employment F.
- Hinds County School District (rural): math 25% / reading 29% proficiency, ranked #70 of 130 in MS (top 54%) — low school quality limits family demand, transient renter base, plan for 1-2y turnover; 64% free/reduced lunch — lower-income household profile, screen leases tightly.
- Market conditions: 105 active listings in the ZIP; 2 comparable units currently listed for rent nearby; 167 units permitted in Hinds County in 2024 (0 in 5+ unit buildings).
Forward outlook
- Local home prices are declining (-3.0%/yr); year-one equity from $1k of loan paydown is wiped out by about $6k of value loss. Plan a longer hold.
- Hinds County population projected to shrink 6% by 2050 — rents likely to lag national; underwrite the cash flow, not the appreciation.
Negotiation context
- Only 11 days on market — expect competitive offers; lowballing is unlikely to land.
- 3 sale attempts since 11y ago with the ask held roughly flat each time — persistent listings suggest the price (not the market) is what's stuck; bring a comps-based counter.
Risks & watch-outs
- Climate carrying-cost: severe wind risk, 80% chance of damaging wind over 30y; extreme-heat days projected 7→21/yr by 2055 (HVAC capex compounding) — expect insurance premiums to compound above CPI over the hold.
Questions for the listing agent
- Is there a deadline driving the sale (1031 exchange, divorce, estate, relocation)? That informs how much negotiation room exists.
- Schools are F-rated, which usually means shorter tenancies and higher turnover. Who's the typical renter profile here, and what's been the actual vacancy rate?
- The area grade is low — what's the realistic commute time and amenity access for the typical tenant pool here? Any planned neighborhood developments (good or bad) we should know about?
- What's the average days-on-market for RENTAL listings here right now (not sales)? A rising rental-DOM trend means longer vacancies and softer asking-rent achievability than the comps imply.
- What's the recent tenant-quality profile in this submarket — average credit score on applications, eviction rate, late-payment / NSF rate, and stable-employment percentage? A property-management company in the area should have these aggregated.
- How much new for-sale + rental construction is in the pipeline within 1–3 miles? Heavy new supply typically softens prices + rents 12–24 months out; constrained supply supports both.
Investment metrics
- 1% rule
- 0.84% ✗
- Cap rate
- 6.52%
- Cash-on-cash
- 0.81%
- DSCR
- 1.04
- GRM
- 9.9
CMA / ARV
- ARV (on-the-fly)
- $256,565
- Comps found
- 5
Show comp detail 5 sales within ~0.75 mi
| Address | Dist | Beds/Ba | Sqft | Sold | Price | $/sf | Match |
|---|---|---|---|---|---|---|---|
| 5225 Brookview Dr | 0.21mi | 4/2.5 | 2,157 (-3%) | 6mo | $247,300 | $115 | 78 |
| 5222 Cloverdale Dr | 0.10mi | 4/2.0 | 2,200 (-1%) | 18mo | $279,000 | $127 | 78 |
| 326 Amanda Ln | 0.41mi | 3/2.0 (-1) | 1,921 (-14%) | 10mo | $254,000 | $132 | 44 |
| 207 Eagle Dr | 0.38mi | 5/2.0 (+1) | 1,996 (-10%) | 20mo | $184,900 | $93 | 43 |
| 107 Evans Dr | 0.56mi | 3/2.0 (-1) | 1,943 (-13%) | 24mo | $149,900 | $77 | 28 |
Match score weights: distance 35% · size 25% · config 20% · recency 20%. Top-matched comps best support the ARV.
Projected returns pro-forma
-3.0% appreciation · 3.0% rent growth · sell at horizon
- IRR
- -15.0%
- Equity multiple
- 0.46×
- Total profit
- $-30,468
- Equity at exit
- $30,268
- IRR
- -6.4%
- Equity multiple
- 0.59×
- Total profit
- $-23,483
- Equity at exit
- $17,552
Cash invested: $56,840 (down + closing). Projections, not guarantees.
Landlord ↔ Tenant lean methodology
- Overall (STATE)
- 90 Strongly Landlord-Friendly
- State Mississippi
- 90 Strongly Landlord-Friendly · R+11
- County
- — inherits STATE
- City
- — inherits STATE
ZIP-level market 39272
- Home prices YoY
- -9.8%
- Active inventory
- 105
- Price-to-rent
- 9.9×
Monthly cashflow live
- Estimated rent
- $1,714 medium interval (Pro) →
- Mortgage (P&I)
- −$1,065
- Tax from tax record
- −$167 /mo · $2,001/yr
- Insurance
- −$85
- HOA
- −$0
- Vacancy / Maint / Mgmt
- −$360
- Net cashflow
- $39
Break-even live
UW: 25.0% down · 7.5% · 30yr · 1.5% tax · 5.0% vac · 8.0% maint · 8.0% mgmt
Financing live
Cash to close
- Down payment
- $50,750
- Closing costs
- $6,090
- Reserves months
- —
- Total cash needed
- —
Loan-product check · same deal, 3 products live
Conventional
25% down · 7.5% · 30yr
- Down + closing
- —
- Monthly P&I
- —
- Monthly cashflow
- —
- DSCR
- —
- Eligible?
- —
Personal DTI + credit; lowest rate.
DSCR
20% down · 8.5% · 30yr
- Down + closing
- —
- Monthly P&I
- —
- Monthly cashflow
- —
- DSCR
- —
- Eligible?
- —
No personal income docs; deal must DSCR.
Hard money
10% down · 12.0% · 12mo
- Down + closing
- —
- Monthly P&I
- —
- Monthly cashflow
- —
- DSCR
- —
- Eligible?
- —
Short-term bridge; refi at stabilization.
Rent comps 2 comps
| Address | Beds | Baths | Sqft | Rent | $/sqft | DOM | Units | Dist |
|---|---|---|---|---|---|---|---|---|
| 306 Gary Daniels Dr Byram, MS | 3.0 | 2.0 | 1517 | $1,595 | $1.05 | 43d | 1 | 0.45mi |
| 257 Gaddy Dr Byram, MS | 3.0 | 2.0 | 1400 | $1,900 | $1.36 | 13d | 1 | 0.65mi |
Listing history 10 events
-
2026-06-10status $203,000 Pending 11 DOM
-
2026-06-09days on market $203,000 Active 11 DOM
-
2026-06-08days on market $203,000 Active 10 DOM
-
2026-06-07days on market $203,000 Active 9 DOM
-
2026-06-03days on market $203,000 Active 5 DOM
-
2026-06-02days on market $203,000 Active 4 DOM
-
2026-06-01days on market $203,000 Active 3 DOM
-
2026-05-31days on market $203,000 Active 2 DOM
-
2026-05-30remarks 699-char remark
-
2026-05-30$203,000 Active 1 DOM
ⓘ Source: listings_history table (triggers on properties + properties_extension) + one-shot
backfill from property_details.listing_events for pre-trigger history.
Tax reassessment forecast MS · Resets to sale price
- Current annual tax
- $2,001 · $167/mo
- Projected year-2 tax
- $2,001 · $167/mo
- Expected delta
- $0/yr ($0/mo · -0.0%)
ⓘ Screening estimate from a state-policy table — verify with the county assessor before closing.
Climate risk First Street
- Flood 1/10 Low FEMA zone X (unshaded) · 0% chance over 30 yrs
- Wildfire 3/10 Moderate
- Heat 7/10 Severe 7 d/yr ≥108°F today · 21 d/yr by 30 yrs out
- Wind 8/10 Severe 80% chance of damaging wind over 30 yrs
- Air quality 1/10 Low 0 unhealthy d/yr today · 0 by 30 yrs out
Nearby sold comps map
Loading sold comps map…
Walkable amenities ~0.75 mi
Loading nearby amenities…
Taxation est. · year 1
- Rental income
- $20,573
- − Mortgage interest
- −$11,371
- − Property taxes
- −$2,001
- − Insurance
- −$1,015
- − Repairs & maintenance
- −$1,646
- − Management
- −$1,646
- − Depreciation
- −$5,905
- Taxable loss
- −$3,011
- Est. tax savings @ 24.0%
- +$723
- After-tax cash flow
- $1,185/yr
For passive investors: Depreciation is non-cash, so a rental often shows a tax loss while cash-flowing — sheltering income. Rental losses are passive: they offset passive income freely, and up to $25,000/yr can offset ordinary (W-2) income if you actively participate and your MAGI is under $100k (phasing out to $0 by $150k); unused losses carry forward. On sale, claimed depreciation is recaptured at up to 25%, and gains may owe capital-gains tax (a 1031 exchange can defer both). Figures are a year-1 estimate at your 24.0% rate — not tax advice; consult a CPA.
Schools (NCES district)
- District
- Hinds County School District
- NCES district ID
- 2801860
- Math proficiency
- 25% ▼ -16.00%
- Reading proficiency
- 29% ▼ -5.00%
- Median HH income
- $53,335
- Composite
- 24.02/100
- National rank
- #7771
- State rank
- #70 of 130 in MS
Livability — Jackson
- Score
- 68/100
- State rank
- #66
- US rank
- #9695
Category grades
Schools grade is shown separately in the Schools card above.
Census & demographics
- Census place
- Jackson, MS
- City population
- 140,204
- Population (ZIP)
- 14,161
Population outlook (Hinds County) Hauer SSP2
- Today (2025)
- 242,528 people
- By 2030
- 241,113 · -0.6%
- By 2040
- 235,557 · -2.9%
- By 2050
- 226,946 · -6.4%
- By 2075
- 199,995 · -17.5%
- By 2100
- 164,165 · -32.3%
Race, ethnicity, and origin ACS 2023
- Neighborhood character
- Predominantly Black (75%)
- Race & ethnicity
- Black 75% White 22% Two or more races 2% Hispanic / Latino 2%
- Common ancestry
- Swedish 2% Lithuanian 1%
- Foreign-born
- 1% · Vietnam
- Languages at home
- 98% English-only · Spanish 1%
Political lean MEDSL · Hinds
- 2024 margin
- Solid D (+46.1) · D 72.4% · R 26.3% · Other 1.4%
- 2008→2024 swing
- +7.1pp toward D · 2008: 39.0pp · 2024: 46.1pp
- All cycles
- 2024: D+46.1 2020: D+48.3 2016: D+43.7 2012: D+45.1 2008: D+39.0
Not yet ingested
- Civics
- —
Market trends
- HPI YoY
- ▼ -20.11%
- Current HPI
- 184.3215
- Rent YoY
- —
- Metro
- —
- State GDP YoY
- —
- F500 in state
- 0
Price history
+50.9% since first listed10 events — show timeline
- 2026-05-29 Listed $203,000 MLSU
- 2023-10-24 Sold (Public Records) — Public Records
- 2023-10-24 Sold (MLS) — MLSU
- 2023-09-25 Pending — MLSU
- 2023-08-17 Price Changed $190,000 MLSU
- 2023-07-22 Listed $215,000 MLSU
- 2015-08-21 Sold (Public Records) — Public Records
- 2015-08-21 Sold (MLS) — MLSU
- 2015-06-06 Listed $134,500 MLSU
- 1979-08-06 Sold (Public Records) — Public Records
Property tax history
+8.7%/yrLatest (2025): $2,001 · +3.3% YoY. Source: county tax records.
Cash-flow waterfall
monthlySold comps — $/sqft
last 12 mo · ≤1 miLoading sold comps…