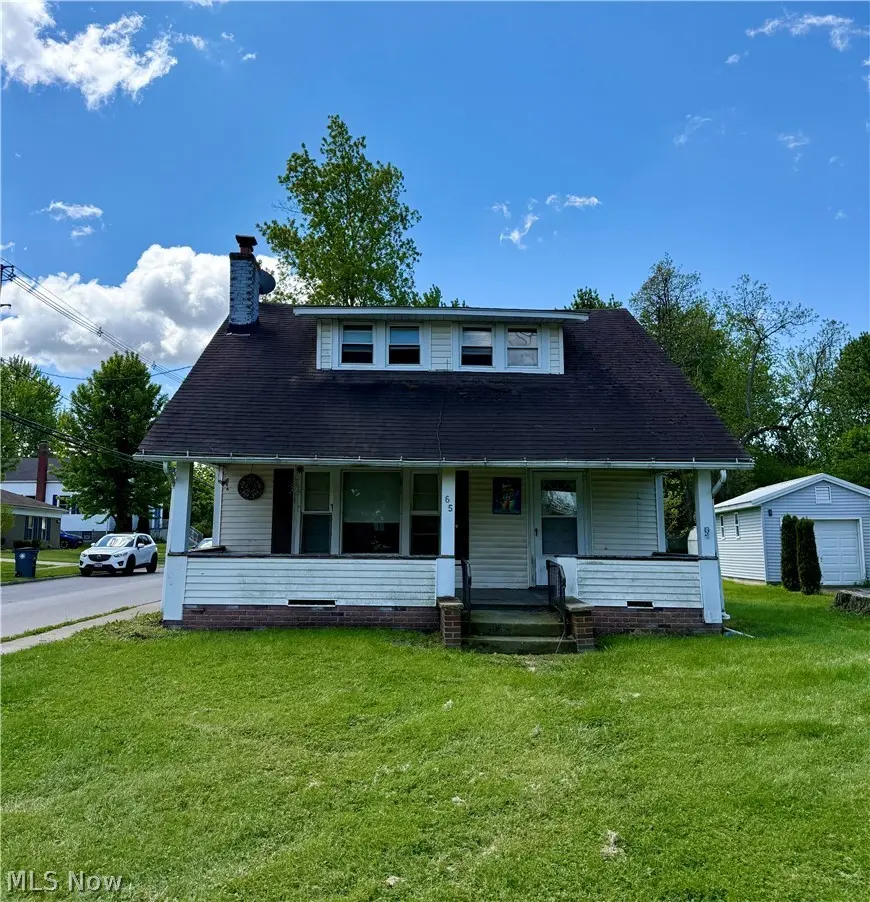
65 E Vine St · Oberlin, OH
Flood risk 1/10 · Minimal
- FEMA flood zone
- X (unshaded)
- Chance of flooding over 30 yrs
- 0.0%
- Est. flood insurance / yr
- $473 – $860
Fire risk 1/10 · Minimal
- Est. fire insurance / yr
- $713 – $1,323
Heat risk 3/10 · Minor
- Hot days now (above 99°F)
- 7 days/yr
- Hot days in 30 yrs
- 16 days/yr
Wind risk 1/10 · Minimal
- Chance of severe wind over 30 yrs
- —
Air-quality risk 2/10 · Minimal
- Unhealthy air days now
- 1 days/yr
- Unhealthy air days in 30 yrs
- 2 days/yr
Risk factors via First Street. Map © Google.
Why this score? — see what drove the B grade
The composite is a weighted blend of 9 inputs, each scored 0–100. Each bar is that input's sub-score; the figure is the points it added to the 100-point composite (weight × sub-score).
- Cash flow +30.0/30.0
- 1% rule +10.0/10.0
- DSCR +10.0/10.0
- ARV discount +7.5/15.0
- Schools +4.2/10.0
- Livability +4.2/5.0
- Rent growth +2.5/5.0
- Condition / age +2.5/5.0
- Appreciation +0.0/10.0
$89,900
🖨 Deal sheet 📄 Offer letter ✓ Due diligence
Listing remarks
Located in the heart of Oberlin, 65 E Vine Street is a great opportunity for investors, renovators, or buyers looking to create their dream home. Just minutes from the downtown area, shops, restaurants, and local amenities, this fixer-upper offers solid potential in a highly desirable location. Bring your vision and restore this property to its full charm while enjoying all that downtown Oberlin has to offer. Schedule your tour today!
Key facts
- Local amenities
- 6,534 sq ft lot
- Built 1900
Tags
Property features AI
Exterior
- Parking: Off-street parking
- Utilities: Public water; Public sewer
- Home design: Two-story house; Fixer condition
- Construction: Shingle roof; Vinyl siding; Built per public records
- Exterior features: Porch; Shed(s); Partial fencing; Corner lot
Interior
- Kitchen: Range; Kitchen located on the first floor (approx. 11.0 x 7.5)
- Bedrooms: Second-floor bedroom (approx. 12.5 x 13.0); Second-floor bedroom (approx. 9.0 x 9.5); Second-floor bedroom (approx. 8.0 x 12.5)
- Flooring: Wood flooring in living room; Wood flooring in dining room
- Bathrooms: One full bathroom (second floor)
- Heating & cooling: Gas heating
- Interior features: Concrete basement with sump pump; Fireplace in living room; 6 total rooms
- Laundry & utility: Laundry area in the kitchen; Basement utility space (sump pump)
Neighborhood map
What this means for you Summary
Snapshot
- This is a 3-bed/1.0-bath single-family listed at $90k.
Deal economics
- At list price, monthly cash flow is $844 ($10k/yr) — positive.
- The deal already cash-flows at list — no discount required.
- Meets the 1% rule at list price ($2k rent vs $90k).
- Recommended offer: $87k (3.0% below list) — sets the bar for market timing.
- Cap rate 17.6% vs local median 4.0% in Oberlin — top-decile yield for the area; either an underpriced asset or a hidden risk that comps aren't pricing in. Stress-test before assuming the spread holds.
Location & tenants
- Location reads 83/100 on livability (#62 in OH, #923 nationally) — a professional / high-income tenant draw. Strengths: cost of living A+, housing A+, amenities A; Watch: employment D+, commute F.
- Oberlin City Schools (town): math 41% / reading 56% proficiency, ranked #447 of 656 in OH (top 68%) — families likely to look elsewhere, expect single-tenant / working-renter base with shorter leases.
- Market conditions: 38 active listings in the ZIP; 1,098 units permitted in Lorain County in 2024 (20 in 5+ unit buildings).
- This rent runs 31% of the median local income ($74k/yr) — at the standard rent-burdened threshold; future hikes will face affordability resistance.
Forward outlook
- Local home prices are declining (-3.0%/yr); year-one equity from $622 of loan paydown is wiped out by about $3k of value loss. Plan a longer hold.
- At projected returns (-3.0% appreciation + 3.0% rent growth), your $25k cash investment doubles in ~3 years — after that, you're playing with house money.
Negotiation context
- It's been on market 34 days — a 3% lower offer ($87k) is reasonable based on typical stale-listing flexibility.
- 5 sale attempts since 34y ago; this cycle's ask has dropped $9k (9%) from the opening price — seller is motivated, your offer sets the floor, not the list.
- Current owner paid $50k; list at $90k implies a 80% gain — meaningful room to come down on a strong offer.
Risks & watch-outs
- Watch-outs: built in 1900 — expect roof / HVAC / electrical / plumbing capex.
Questions for the listing agent
- It's been on market 34 days. Have you received any prior offers? Is the seller open to a 3% concession, seller financing, or rate buy-down credit?
- Built in 1900 — when were the roof, HVAC, electrical panel, plumbing, and water heater last replaced?
- Is there a deadline driving the sale (1031 exchange, divorce, estate, relocation)? That informs how much negotiation room exists.
- Schools are A-rated — typically a magnet for longer-tenancy family renters. What's the average tenant stay here, and is there a school-zone premium baked into asking?
- What's the average days-on-market for RENTAL listings here right now (not sales)? A rising rental-DOM trend means longer vacancies and softer asking-rent achievability than the comps imply.
- What's the recent tenant-quality profile in this submarket — average credit score on applications, eviction rate, late-payment / NSF rate, and stable-employment percentage? A property-management company in the area should have these aggregated.
- How much new for-sale + rental construction is in the pipeline within 1–3 miles? Heavy new supply typically softens prices + rents 12–24 months out; constrained supply supports both.
Investment metrics
- 1% rule
- 2.10% ✓
- Cap rate
- 17.56%
- Cash-on-cash
- 40.25%
- DSCR
- 2.79
- GRM
- 4.0
CMA / ARV
- ARV (median comp)
- $180,970
- List price
- $89,900
- Delta
- -50.32%
- Verdict
- UNDERPRICED
- Comps
- 20 within 1.0 mi
Show comp detail 10 sales within ~0.75 mi
| Address | Dist | Beds/Ba | Sqft | Sold | Price | $/sf | Match |
|---|---|---|---|---|---|---|---|
| 177 Sumner St | 0.32mi | 3/1.5 | 1,312 (+2%) | 2mo | $255,000 | $194 | 79 |
| 32 W Lincoln St | 0.46mi | 3/1.0 | 1,274 (-1%) | 1mo | $192,000 | $151 | 75 |
| 177 S Pleasant St | 0.12mi | 3/2.0 | 1,323 (+2%) | 13mo | $127,000 | $96 | 75 |
| 180 N Park St | 0.56mi | 3/1.0 | 1,329 (+3%) | 3mo | $213,000 | $160 | 66 |
| 359 S Pleasant St | 0.47mi | 3/2.0 | 1,263 (-2%) | 8mo | $237,500 | $188 | 64 |
| 29 S Pleasant St | 0.16mi | 2/2.0 (-1) | 1,400 (+8%) | 7mo | $182,900 | $131 | 64 |
| 136 N Park St | 0.48mi | 2/1.0 (-1) | 1,170 (-9%) | 1mo | $174,900 | $149 | 56 |
| 45773 E Hamilton St | 0.66mi | 3/1.0 | 1,286 (-0%) | 23mo | $246,000 | $191 | 50 |
| 395 Washington Cir | 0.66mi | 4/1.5 (+1) | 1,236 (-4%) | 14mo | $222,000 | $180 | 44 |
| 269 N Main St | 0.72mi | 3/1.5 | 1,436 (+11%) | 19mo | $183,500 | $128 | 29 |
Match score weights: distance 35% · size 25% · config 20% · recency 20%. Top-matched comps best support the ARV.
Projected returns pro-forma
-3.0% appreciation · 3.0% rent growth · sell at horizon
- IRR
- 36.7%
- Equity multiple
- 2.56×
- Total profit
- $39,249
- Equity at exit
- $13,404
- IRR
- 43.3%
- Equity multiple
- 5.12×
- Total profit
- $103,594
- Equity at exit
- $7,773
Cash invested: $25,172 (down + closing). Projections, not guarantees.
Landlord ↔ Tenant lean methodology
- Overall (STATE)
- 73 Landlord-Friendly
- State Ohio
- 73 Landlord-Friendly · R+6
- County
- — inherits STATE
- City
- — inherits STATE
ZIP-level market 44074
- Home prices YoY
- -25.8%
- Active inventory
- 38
- Price-to-rent
- 4.0×
Monthly cashflow live
- Estimated rent
- $1,885 medium interval (Pro) →
- Mortgage (P&I)
- −$471
- Tax from tax record
- −$136 /mo · $1,634/yr
- Insurance
- −$37
- HOA
- −$0
- Vacancy / Maint / Mgmt
- −$396
- Net cashflow
- $844
Break-even live
UW: 25.0% down · 7.5% · 30yr · 1.5% tax · 5.0% vac · 8.0% maint · 8.0% mgmt
Financing live
Cash to close
- Down payment
- $22,475
- Closing costs
- $2,697
- Reserves months
- —
- Total cash needed
- —
Loan-product check · same deal, 3 products live
Conventional
25% down · 7.5% · 30yr
- Down + closing
- —
- Monthly P&I
- —
- Monthly cashflow
- —
- DSCR
- —
- Eligible?
- —
Personal DTI + credit; lowest rate.
DSCR
20% down · 8.5% · 30yr
- Down + closing
- —
- Monthly P&I
- —
- Monthly cashflow
- —
- DSCR
- —
- Eligible?
- —
No personal income docs; deal must DSCR.
Hard money
10% down · 12.0% · 12mo
- Down + closing
- —
- Monthly P&I
- —
- Monthly cashflow
- —
- DSCR
- —
- Eligible?
- —
Short-term bridge; refi at stabilization.
Listing history 26 events
-
2026-06-18days on market $89,900 Active 34 DOM
-
2026-06-17days on market $89,900 Active 33 DOM
-
2026-06-16days on market $89,900 Active 32 DOM
-
2026-06-15days on market $89,900 Active 31 DOM
-
2026-06-13days on market $89,900 Active 29 DOM
-
2026-06-13days on market $89,900 Active 28 DOM
-
2026-06-09days on market $89,900 Active 25 DOM
-
2026-06-08pricedays on market $89,900 Active 24 DOM
-
2026-06-07days on market $99,000 Active 23 DOM
-
2026-06-05days on market $99,000 Active 20 DOM
-
2026-06-03days on market $99,000 Active 19 DOM
-
2026-06-02days on market $99,000 Active 18 DOM
-
2026-06-01days on market $99,000 Active 17 DOM
-
2026-05-31days on market $99,000 Active 16 DOM
-
2026-05-15$99,000 Active 438-char remark
-
2023-08-02soldstatus $50,000
-
2000-08-15historical
-
2000-04-19$65,000
-
1998-12-24historical
-
1998-07-17historical
-
1998-06-24$69,900
-
1998-02-17$73,000
-
1993-08-09soldstatus $32,700
-
1993-08-09soldstatus $30,800
-
1993-06-30historical
-
1992-12-27$38,000
ⓘ Source: listings_history table (triggers on properties + properties_extension) + one-shot
backfill from property_details.listing_events for pre-trigger history.
Tax reassessment forecast OH · Partial reset (capped growth)
- Current annual tax
- $1,634 · $136/mo
- Projected year-2 tax
- $1,634 · $136/mo
- Expected delta
- $0/yr ($0/mo · 0.0%)
ⓘ Screening estimate from a state-policy table — verify with the county assessor before closing.
Climate risk First Street
- Flood 1/10 Low FEMA zone X (unshaded) · 0% chance over 30 yrs
- Wildfire 1/10 Low
- Heat 3/10 Moderate 7 d/yr ≥99°F today · 16 d/yr by 30 yrs out
- Wind 1/10 Low
- Air quality 2/10 Low 1 unhealthy d/yr today · 2 by 30 yrs out
Nearby sold comps map
Loading sold comps map…
Walkable amenities ~0.75 mi
Loading nearby amenities…
Taxation est. · year 1
- Rental income
- $22,623
- − Mortgage interest
- −$5,036
- − Property taxes
- −$1,634
- − Insurance
- −$450
- − Repairs & maintenance
- −$1,810
- − Management
- −$1,810
- − Depreciation
- −$2,615
- Taxable income
- $9,269
- Est. tax owed @ 24.0%
- −$2,225
- After-tax cash flow
- $7,907/yr
For passive investors: Depreciation is non-cash, so a rental often shows a tax loss while cash-flowing — sheltering income. Rental losses are passive: they offset passive income freely, and up to $25,000/yr can offset ordinary (W-2) income if you actively participate and your MAGI is under $100k (phasing out to $0 by $150k); unused losses carry forward. On sale, claimed depreciation is recaptured at up to 25%, and gains may owe capital-gains tax (a 1031 exchange can defer both). Figures are a year-1 estimate at your 24.0% rate — not tax advice; consult a CPA.
Schools (NCES district)
- District
- Oberlin City Schools
- NCES district ID
- 3904459
- Math proficiency
- 41% ▼ -21.00%
- Reading proficiency
- 56% ▼ -7.00%
- Median HH income
- $54,514
- Composite
- 41.92/100
- National rank
- #3362
- State rank
- #447 of 656 in OH
Livability — Oberlin
- Score
- 83/100
- State rank
- #62
- US rank
- #923
Category grades
Schools grade is shown separately in the Schools card above.
Census & demographics
- Census place
- Oberlin, OH
- County
- Lorain · 305,041 people
- City population
- 11,684
- Metro
- Cleveland, OH
- Population (ZIP)
- 11,684
- Household income
- $73,697
- Rent vs Own
- Severe rent burden
- 7.1
Population outlook (Lorain County) Hauer SSP2
- Today (2025)
- 314,924 people
- By 2030
- 317,546 · +0.8%
- By 2040
- 317,962 · +1.0%
- By 2050
- 312,872 · -0.7%
- By 2075
- 301,806 · -4.2%
- By 2100
- 278,271 · -11.6%
Race, ethnicity, and origin ACS 2023
- Neighborhood character
- Predominantly White (75%)
- Race & ethnicity
- White 75% Two or more races 11% Black 9% Hispanic / Latino 6% Asian 3%
- Hispanic origin (detail)
- Mexican 2% Puerto Rican 2%
- Common ancestry
- Romanian 5% Slovak 2% Lithuanian 2%
- Foreign-born
- 4% · Canada, China
- Languages at home
- 92% English-only · Spanish 3% Other Indo-European 1% Chinese 1%
Political lean MEDSL · Lorain
- 2024 margin
- Lean R (+5.7) · D 46.7% · R 52.4%
- 2008→2024 swing
- -23.6pp toward R · 2008: 17.9pp · 2024: -5.7pp
- All cycles
- 2024: R+5.7 2020: R+2.5 2016: R+0.3 2012: D+14.4 2008: D+17.9
Not yet ingested
- Civics
- —
Market trends
- HPI YoY
- ▼ -72.36%
- Current HPI
- 208.1653
- Rent YoY
- —
- Metro
- —
- State GDP YoY
- ▲ 1.98%
- F500 in state
- 48
Industry mix (Fortune 500 HQ in OH)
| Industry | F500 HQs | Revenue |
|---|---|---|
| Insurance | 3 | $145B |
|
||
| Industrial Machinery | 3 | $49B |
|
||
| Financial Services | 3 | $24B |
|
||
| Consumer Goods | 2 | $93B |
|
||
| Aerospace / Defense | 2 | $47B |
|
||
| Utilities | 2 | $33B |
|
||
Price history
+136.6% since first listed14 events — show timeline
- 2026-06-08 Price Changed $89,900 MLSNOW
- 2026-06-08 Price Changed $89,000 MLSNOW
- 2026-05-15 Listed $99,000 MLSNOW
- 2023-08-02 Sold (Public Records) $50,000 Public Records
- 2000-08-15 Listing Removed — MLSNOW
- 2000-04-19 Listed $65,000 MLSNOW
- 1998-12-24 Listing Removed — MLSNOW
- 1998-07-17 Listing Removed — MLSNOW
- 1998-06-24 Listed $69,900 MLSNOW
- 1998-02-17 Listed $73,000 MLSNOW
- 1993-08-09 Sold (Public Records) $30,800 Public Records
- 1993-08-09 Sold (MLS) $32,700 MLSNOW
- 1993-06-30 Listing Removed — MLSNOW
- 1992-12-27 Listed $38,000 MLSNOW
Property tax history
+2.9%/yrLatest (2025): $1,634 · -1.7% YoY. Source: county tax records.
Cash-flow waterfall
monthlySold comps — $/sqft
last 12 mo · ≤1 miLoading sold comps…