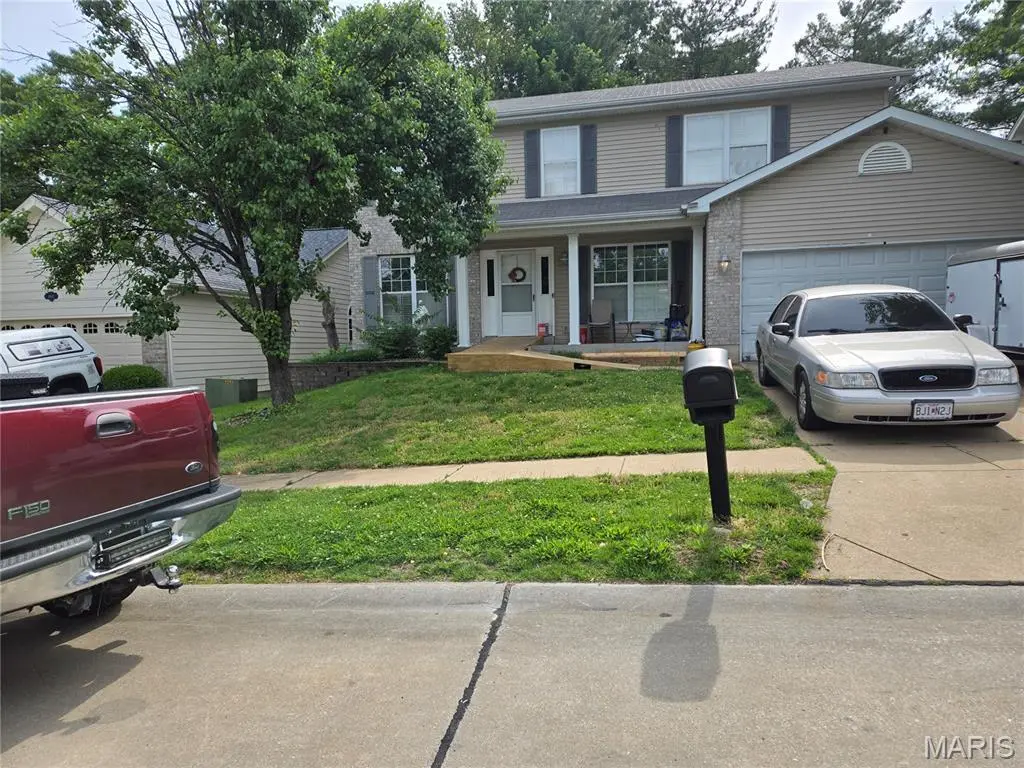
4516 Southridge Pines Dr · Concord, MO
Flood risk 1/10 · Minimal
- FEMA flood zone
- X (unshaded)
- Chance of flooding over 30 yrs
- 0.0%
- Est. flood insurance / yr
- $473 – $860
Fire risk 1/10 · Minimal
- Est. fire insurance / yr
- $1,054 – $1,958
Heat risk 5/10 · Moderate
- Hot days now (above 107°F)
- 7 days/yr
- Hot days in 30 yrs
- 21 days/yr
Wind risk 2/10 · Minimal
- Chance of severe wind over 30 yrs
- 1.0%
Air-quality risk 3/10 · Minor
- Unhealthy air days now
- 2 days/yr
- Unhealthy air days in 30 yrs
- 3 days/yr
Risk factors via First Street. Map © Google.
Why this score? — see what drove the B grade
The composite is a weighted blend of 9 inputs, each scored 0–100. Each bar is that input's sub-score; the figure is the points it added to the 100-point composite (weight × sub-score).
- Cash flow +27.5/30.0
- ARV discount +15.0/15.0
- DSCR +9.6/10.0
- 1% rule +7.9/10.0
- Schools +4.3/10.0
- Livability +3.4/5.0
- Rent growth +3.0/5.0
- Condition / age +2.5/5.0
- Appreciation +0.0/10.0
$200,000
🖨 Deal sheet 📄 Offer letter ✓ Due diligence
Listing remarks
This is a "Short Sale". This home is in the Lindbergh School District and will sell fast. The home needs everything but is situated in a very nice neighborhood off Little Rock Road. Showings are by appointment only. Please use the Special Sales Contract.
Key facts
- 6,098 sq ft lot
- Garage
- Built 1997
Neighborhood map
What this means for you Summary
Snapshot
- This is a 4-bed/2.5-bath single-family listed at $200k.
Deal economics
- At list price, monthly cash flow is $588 ($7k/yr) — positive.
- The deal already cash-flows at list — no discount required.
- Meets the 1% rule at list price ($3k rent vs $200k).
- Cap rate 9.8% vs local median 3.9% in Concord — top-decile yield for the area; either an underpriced asset or a hidden risk that comps aren't pricing in. Stress-test before assuming the spread holds.
Location & tenants
- Location reads 68/100 on livability (#175 in MO) — a middle-class / working-renter tenant base. Strengths: employment A+, housing A+, cost of living A-; Watch: amenities F, commute F, health & safety F.
- Lindbergh Schools (suburban): math 41% / reading 55% proficiency, ranked #38 of 324 in MO (top 12%) — families likely to look elsewhere, expect single-tenant / working-renter base with shorter leases; only 13% free/reduced lunch — higher-income household profile.
- Zoned schools: Concord Elem. School (math 43% / reading 62%, grade C-, #226 of 1,115 statewide, top 21%, 552 students, 10% FRL); Lindbergh Sr. High (math 56% / reading 70%, grade B-, #26 of 521 statewide, top 5%, 2,235 students, 12% FRL) — zoned schools at 11% FRL track the district average.
- Market conditions: Rents rising (+2.0%/yr); 135 active listings in the ZIP; 3 comparable units currently listed for rent nearby; rentals leasing fast (median 2d on market — plan ~1-2 weeks tenant-placement turnaround); solid renter incomes; 920 units permitted in St. Louis County in 2024 (250 in 5+ unit buildings).
- This rent runs 34% of the median local income ($92k/yr) — at the standard rent-burdened threshold; future hikes will face affordability resistance.
Forward outlook
- Local home prices are declining (-3.0%/yr); year-one equity from $1k of loan paydown is wiped out by about $6k of value loss. Plan a longer hold.
Negotiation context
- Only 1 days on market — expect competitive offers; lowballing is unlikely to land.
- 2 sale attempts with the ask held roughly flat each time — persistent listings suggest the price (not the market) is what's stuck; bring a comps-based counter.
- Current owner paid $35k; list at $200k implies a 471% gain — meaningful room to come down on a strong offer.
Risks & watch-outs
- Climate carrying-cost: extreme-heat days projected 7→21/yr by 2055 (HVAC capex compounding) — expect insurance premiums to compound above CPI over the hold.
Questions for the listing agent
- Is there a deadline driving the sale (1031 exchange, divorce, estate, relocation)? That informs how much negotiation room exists.
- What's the average days-on-market for RENTAL listings here right now (not sales)? A rising rental-DOM trend means longer vacancies and softer asking-rent achievability than the comps imply.
- What's the recent tenant-quality profile in this submarket — average credit score on applications, eviction rate, late-payment / NSF rate, and stable-employment percentage? A property-management company in the area should have these aggregated.
- How much new for-sale + rental construction is in the pipeline within 1–3 miles? Heavy new supply typically softens prices + rents 12–24 months out; constrained supply supports both.
Investment metrics
- 1% rule
- 1.29% ✓
- Cap rate
- 9.82%
- Cash-on-cash
- 12.61%
- DSCR
- 1.56
- GRM
- 6.5
CMA / ARV
- ARV (on-the-fly)
- $373,632
- Comps found
- 12
Show comp detail 12 sales within ~0.75 mi
| Address | Dist | Beds/Ba | Sqft | Sold | Price | $/sf | Match |
|---|---|---|---|---|---|---|---|
| 4701 Sunnyview Dr | 0.48mi | 4/2.5 | 2,260 (+2%) | 4mo | $379,000 | $168 | 72 |
| 4633 Colima Ct | 0.41mi | 4/3.0 | 2,262 (+2%) | 8mo | $399,900 | $177 | 70 |
| 4709 Theiss Rd | 0.38mi | 4/2.0 | 2,068 (-7%) | 0mo | $389,900 | $189 | 68 |
| 4514 Southridge Meadows Dr | 0.07mi | 5/2.5 (+1) | 2,516 (+13%) | 8mo | $425,000 | $169 | 63 |
| 4721 Kingbird Ln | 0.49mi | 4/2.5 | 2,350 (+6%) | 9mo | $410,000 | $174 | 61 |
| 4642 Theiss Rd | 0.39mi | 4/3.0 | 2,436 (+10%) | 4mo | $380,000 | $156 | 60 |
| 4596 Little Rock Rd | 0.24mi | 3/3.0 (-1) | 1,940 (-13%) | 3mo | $275,000 | $142 | 58 |
| 4740 Hedgemont Dr | 0.45mi | 3/2.0 (-1) | 1,972 (-11%) | 7mo | $325,000 | $165 | 48 |
| 4724 Tarlton Dr | 0.67mi | 3/2.0 (-1) | 2,068 (-7%) | 7mo | $300,000 | $145 | 44 |
| 4829 Vermilion Dr | 0.68mi | 3/3.0 (-1) | 2,056 (-8%) | 6mo | $334,900 | $163 | 44 |
| 4849 Gatesbury Dr | 0.62mi | 3/3.0 (-1) | 2,012 (-10%) | 7mo | $395,000 | $196 | 42 |
| 4466 Vermilion Dr | 0.54mi | 3/2.0 (-1) | 2,528 (+14%) | 10mo | $425,000 | $168 | 37 |
Match score weights: distance 35% · size 25% · config 20% · recency 20%. Top-matched comps best support the ARV.
Projected returns pro-forma
-3.0% appreciation · 2.05% rent growth · sell at horizon
- IRR
- 1.3%
- Equity multiple
- 1.05×
- Total profit
- $2,709
- Equity at exit
- $29,821
- IRR
- 9.9%
- Equity multiple
- 1.73×
- Total profit
- $41,111
- Equity at exit
- $17,292
Cash invested: $56,000 (down + closing). Projections, not guarantees.
Landlord ↔ Tenant lean methodology
- Overall (STATE)
- 81 Strongly Landlord-Friendly
- State Missouri
- 81 Strongly Landlord-Friendly · R+10
- County
- — inherits STATE
- City
- — inherits STATE
ZIP-level market 63128
- Rents YoY
- 2.0%
- Active inventory
- 135
- Price-to-rent
- 6.5×
Monthly cashflow live
- Estimated rent
- $2,581 medium interval (Pro) →
- Mortgage (P&I)
- −$1,049
- Tax from tax record
- −$318 /mo · $3,818/yr
- Insurance
- −$83
- HOA
- −$0
- Vacancy / Maint / Mgmt
- −$542
- Net cashflow
- $588
Break-even live
UW: 25.0% down · 7.5% · 30yr · 1.5% tax · 5.0% vac · 8.0% maint · 8.0% mgmt
Financing live
Cash to close
- Down payment
- $50,000
- Closing costs
- $6,000
- Reserves months
- —
- Total cash needed
- —
Loan-product check · same deal, 3 products live
Conventional
25% down · 7.5% · 30yr
- Down + closing
- —
- Monthly P&I
- —
- Monthly cashflow
- —
- DSCR
- —
- Eligible?
- —
Personal DTI + credit; lowest rate.
DSCR
20% down · 8.5% · 30yr
- Down + closing
- —
- Monthly P&I
- —
- Monthly cashflow
- —
- DSCR
- —
- Eligible?
- —
No personal income docs; deal must DSCR.
Hard money
10% down · 12.0% · 12mo
- Down + closing
- —
- Monthly P&I
- —
- Monthly cashflow
- —
- DSCR
- —
- Eligible?
- —
Short-term bridge; refi at stabilization.
Rent comps 3 comps
| Address | Beds | Baths | Sqft | Rent | $/sqft | DOM | Units | Dist |
|---|---|---|---|---|---|---|---|---|
| 4446 Skyridge Dr Saint Louis, MO | 4.0 | 2.0 | 2770 | $2,706 | $0.98 | 1d | 1 | 0.61mi |
| 3912 Manorwood Dr Saint Louis, MO | 4.0 | 2.0 | 1800 | $2,350 | $1.31 | 44d | 1 | 1.32mi |
| 11862 Kramper Ln Saint Louis, MO | 4.0 | 3.0 | 2246 | $2,646 | $1.18 | 1d | 1 | 1.41mi |
Listing history 5 events
-
2026-03-25status Pending
-
2026-03-25status Active
-
2026-03-24$200,000 Active
-
2026-03-24historical $200,000
-
1996-04-02soldstatus $35,000
ⓘ Source: listings_history table (triggers on properties + properties_extension) + one-shot
backfill from property_details.listing_events for pre-trigger history.
Tax reassessment forecast MO · Resets to sale price
- Current annual tax
- $3,818 · $318/mo
- Projected year-2 tax
- $3,818 · $318/mo
- Expected delta
- $0/yr ($0/mo · 0.0%)
ⓘ Screening estimate from a state-policy table — verify with the county assessor before closing.
Climate risk First Street
- Flood 1/10 Low FEMA zone X (unshaded) · 0% chance over 30 yrs
- Wildfire 1/10 Low
- Heat 5/10 Major 7 d/yr ≥107°F today · 21 d/yr by 30 yrs out
- Wind 2/10 Low 100% chance of damaging wind over 30 yrs
- Air quality 3/10 Moderate 2 unhealthy d/yr today · 3 by 30 yrs out
Nearby sold comps map
Loading sold comps map…
Walkable amenities ~0.75 mi
Loading nearby amenities…
Taxation est. · year 1
- Rental income
- $30,969
- − Mortgage interest
- −$11,203
- − Property taxes
- −$3,818
- − Insurance
- −$1,000
- − Repairs & maintenance
- −$2,477
- − Management
- −$2,477
- − Depreciation
- −$5,818
- Taxable income
- $4,175
- Est. tax owed @ 24.0%
- −$1,002
- After-tax cash flow
- $6,060/yr
For passive investors: Depreciation is non-cash, so a rental often shows a tax loss while cash-flowing — sheltering income. Rental losses are passive: they offset passive income freely, and up to $25,000/yr can offset ordinary (W-2) income if you actively participate and your MAGI is under $100k (phasing out to $0 by $150k); unused losses carry forward. On sale, claimed depreciation is recaptured at up to 25%, and gains may owe capital-gains tax (a 1031 exchange can defer both). Figures are a year-1 estimate at your 24.0% rate — not tax advice; consult a CPA.
Schools (NCES district)
- District
- Lindbergh Schools
- NCES district ID
- 2918690
- Math proficiency
- 41% ▼ -18.00%
- Reading proficiency
- 55% ▼ -9.00%
- Median HH income
- $66,145
- Composite
- 42.62/100
- National rank
- #3186
- State rank
- #38 of 324 in MO
Livability — Concord
- Score
- 68/100
- State rank
- #175
- US rank
- #9260
Category grades
Schools grade is shown separately in the Schools card above.
Census & demographics
- Census place
- Concord, MO
- County
- Saint Louis County · 888,823 people
- City population
- 30,540
- Metro
- St. Louis, MO-IL
- Population (ZIP)
- 30,540
- Household income
- $92,359
- Rent vs Own
- Severe rent burden
- 729.0
Population outlook (St. Louis County) Hauer SSP2
- Today (2025)
- 1,025,227 people
- By 2030
- 1,028,023 · +0.3%
- By 2040
- 1,020,940 · -0.4%
- By 2050
- 1,007,280 · -1.8%
- By 2075
- 987,277 · -3.7%
- By 2100
- 921,984 · -10.1%
Race, ethnicity, and origin ACS 2023
- Neighborhood character
- Predominantly White (92%)
- Race & ethnicity
- White 92% Two or more races 5% Black 1% Hispanic / Latino 1%
- Common ancestry
- Romanian 4% Lithuanian 4% Italian 2%
- Foreign-born
- 4% · Canada
- Languages at home
- 94% English-only · Russian/Polish/Slavic 2% Spanish 1% Other Indo-European 1%
Political lean MEDSL · St. Louis
- 2024 margin
- Strong D (+23.4) · D 60.8% · R 37.4% · Other 1.7%
- 2008→2024 swing
- +3.5pp toward D · 2008: 19.9pp · 2024: 23.4pp
- All cycles
- 2024: D+23.4 2020: D+24.0 2016: D+16.2 2012: D+13.7 2008: D+19.9
Not yet ingested
- Civics
- —
Market trends
- HPI YoY
- ▼ -228.34%
- Current HPI
- 211.4603
- Rent YoY
- ▲ 2.05%
- Metro
- St. Louis, MO-IL
- State GDP YoY
- ▲ 1.84%
- F500 in state
- 20
Industry mix (Fortune 500 HQ in MO)
| Industry | F500 HQs | Revenue |
|---|---|---|
| Healthcare | 1 | $163B |
|
||
| Insurance | 1 | $21B |
|
||
| Industrial Technology | 1 | $17B |
|
||
| Retail | 1 | $16B |
|
||
| Industrial Distribution | 1 | $10B |
|
||
| Utilities | 1 | $9B |
|
||
Price history
+471.4% since first listed5 events — show timeline
- 2026-03-25 Pending — MARIS as Distributed by MLS Grid
- 2026-03-25 Relisted — MARIS as Distributed by MLS Grid
- 2026-03-24 Listed $200,000 MARIS as Distributed by MLS Grid
- 2026-03-24 Coming Soon $200,000 MARIS as Distributed by MLS Grid
- 1996-04-02 Sold (Public Records) $35,000 Public Records
Property tax history
+5.1%/yrLatest (2022): $3,818 · +3.7% YoY. Source: county tax records.
Cash-flow waterfall
monthlySold comps — $/sqft
last 12 mo · ≤1 miLoading sold comps…