 Duplex
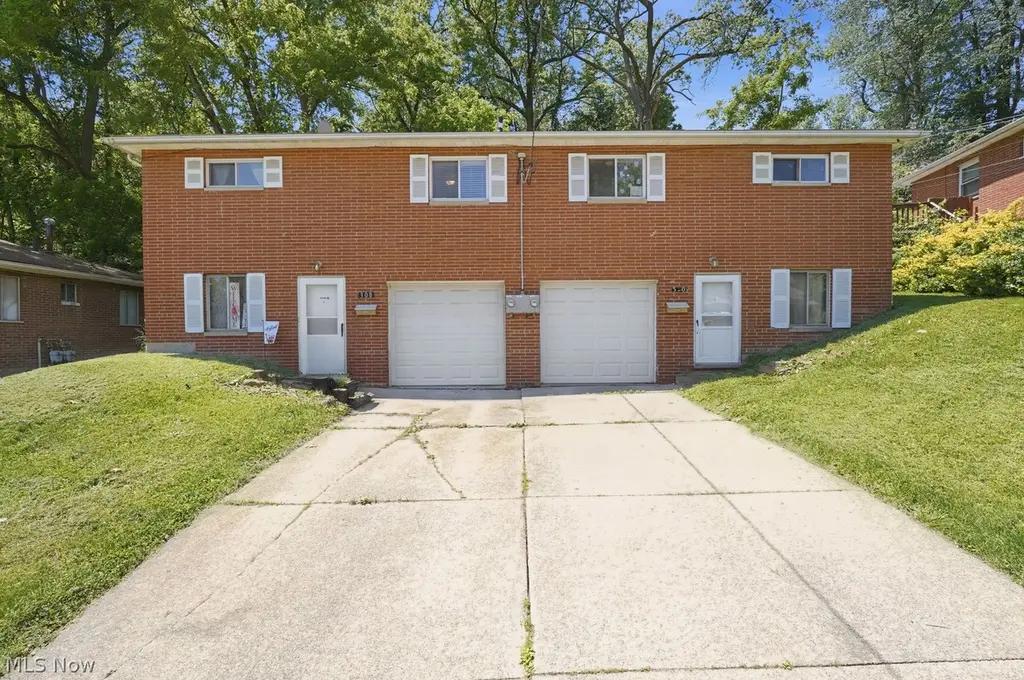
308 - 310 Cluster Ave · Akron, OH
Flood risk 1/10 · Minimal
- FEMA flood zone
- X (unshaded)
- Chance of flooding over 30 yrs
- 0.0%
- Est. flood insurance / yr
- $507 – $1,088
Fire risk 1/10 · Minimal
- Est. fire insurance / yr
- $713 – $1,323
Heat risk 3/10 · Minor
- Hot days now (above 96°F)
- 7 days/yr
- Hot days in 30 yrs
- 16 days/yr
Wind risk 1/10 · Minimal
- Chance of severe wind over 30 yrs
- —
Air-quality risk 3/10 · Minor
- Unhealthy air days now
- 2 days/yr
- Unhealthy air days in 30 yrs
- 4 days/yr
Risk factors via First Street. Map © Google.
Why this score? — see what drove the D+ grade
The composite is a weighted blend of 9 inputs, each scored 0–100. Each bar is that input's sub-score; the figure is the points it added to the 100-point composite (weight × sub-score).
- Cash flow +21.3/30.0
- DSCR +6.8/10.0
- 1% rule +5.5/10.0
- Livability +4.0/5.0
- Rent growth +3.6/5.0
- ARV discount +2.5/15.0
- Condition / age +2.5/5.0
- Schools +2.1/10.0
- Appreciation +0.0/10.0
$189,900
🖨 Deal sheet 📄 Offer letter ✓ Due diligence
Multi-family units
County records classify this as Multi-Family (2-4 Unit). Listing-text estimate: 2 units. confirmed
Listing remarks MLS
All Brick Twinplex w/ attached Garage for each unit! Ready to rent! Live in one side, rent the other. Great investment at a great price! This is a Fannie Mae HomePath Property. Purchase this property for as little as 3% down! This property is approved for HomePath Mortgage And HomePath Renovation Mortgage Financing.
Key facts
- Long term tenants
- Fully occupied
- All brick exterior
Tags
Neighborhood map
What this means for you Summary
Snapshot
- This is a 2 × 2-bed/1.0-bath units multifamily listed at $190k.
Deal economics
- At list price, monthly cash flow is $279 ($3k/yr) — positive. Per door: $139/mo.
- The deal already cash-flows at list — no discount required.
- Meets the 1% rule at list price ($2k rent vs $190k).
- Cap rate 8.1% vs local median 6.6% in Akron — meaningfully above typical; check what's discounted (condition, days-on-market, listing class) to confirm the premium yield is real.
Location & tenants
- Location reads 81/100 on livability (#104 in OH, #1,591 nationally) — a professional / high-income tenant draw. Strengths: amenities A+, commute A+, cost of living A+; Watch: crime F, employment F.
- Akron City (urban): math 22% / reading 30% proficiency, ranked #602 of 656 in OH (top 92%) — low school quality limits family demand, transient renter base, plan for 1-2y turnover; 66% free/reduced lunch — lower-income household profile, screen leases tightly.
- Market conditions: Rents rising fast (+4.5%/yr); 101 active listings in the ZIP; 10 comparable units currently listed for rent nearby; rentals lingering (median 44d on market — plan ~5-8 weeks vacancy on turnover, expect pricing pressure); 70% of comp listings sitting > 30 days — soft ceiling on asking rent; 1,114 units permitted in Summit County in 2024 (397 in 5+ unit buildings).
- At $1,989/mo this rent would consume 45% of the median local household income ($53k/yr) (locally 1021% of renters already pay >50% of income on rent) — very limited rent-growth headroom before tenants either downsize or default.
Forward outlook
- Local home prices are declining (-3.0%/yr); year-one equity from $1k of loan paydown is wiped out by about $6k of value loss. Plan a longer hold.
- Summit County population projected to shrink 6% by 2050 — rents likely to lag national; underwrite the cash flow, not the appreciation.
Negotiation context
- Only 7 days on market — expect competitive offers; lowballing is unlikely to land.
- 3 sale attempts since 14y ago with the ask held roughly flat each time — persistent listings suggest the price (not the market) is what's stuck; bring a comps-based counter.
- Current owner paid $45k; list at $190k implies a 325% gain — meaningful room to come down on a strong offer.
Questions for the listing agent
- Can we see the unit-by-unit rent roll, current vacancy, and any below-market leases? What's the average tenancy length?
- What capital expenditures (roof, boiler, parking lot, exteriors) have been made in the last 5 years, and what's planned in the next 2?
- Built in 1963 — when were the roof, HVAC, electrical panel, plumbing, and water heater last replaced?
- Is there a deadline driving the sale (1031 exchange, divorce, estate, relocation)? That informs how much negotiation room exists.
- Crime grade is F in this area — have there been break-ins, vandalism, or insurance claims at this property in the last 3 years? What carrier currently insures it and at what premium?
- The area grade is low — what's the realistic commute time and amenity access for the typical tenant pool here? Any planned neighborhood developments (good or bad) we should know about?
- What's the average days-on-market for RENTAL listings here right now (not sales)? A rising rental-DOM trend means longer vacancies and softer asking-rent achievability than the comps imply.
- What's the recent tenant-quality profile in this submarket — average credit score on applications, eviction rate, late-payment / NSF rate, and stable-employment percentage? A property-management company in the area should have these aggregated.
- How much new apartment / multifamily construction is in the pipeline within 1–3 miles? Heavy new supply (>2% of stock underway) typically softens rents 12–24 months out; light construction supports rent growth.
Investment metrics
- 1% rule
- 1.05% ✓
- Cap rate
- 8.05%
- Cash-on-cash
- 6.29%
- DSCR
- 1.28
- GRM
- 8.0
CMA / ARV
- ARV (on-the-fly)
- $170,800
- Comps found
- 9
Show comp detail 9 sales within ~0.75 mi
| Address | Dist | Beds/Ba | Sqft | Sold | Price | $/sf | Match |
|---|---|---|---|---|---|---|---|
| 280 Cluster Ave | 0.06mi | 4/2.0 | 1,440 (+3%) | 1mo | $184,000 | $128 | 92 |
| 1991-1993 Congo St | 0.07mi | 4/2.0 | 1,464 (+5%) | 3mo | $207,000 | $141 | 87 |
| 1939 Preston Ave | 0.34mi | 4/2.0 | 1,440 (+3%) | 11mo | $176,250 | $122 | 70 |
| 1931 Preston Ave | 0.35mi | 4/2.0 | 1,440 (+3%) | 11mo | $176,250 | $122 | 70 |
| 1925 Preston Ave | 0.35mi | 4/2.0 | 1,440 (+3%) | 11mo | $176,250 | $122 | 70 |
| 1919 Preston Ave | 0.36mi | 4/2.0 | 1,440 (+3%) | 11mo | $176,250 | $122 | 69 |
| 1946 Preston Ave | 0.37mi | 4/2.0 | 1,440 (+3%) | 20mo | $130,000 | $90 | 61 |
| 2347-2349 Nicholas Ave | 0.74mi | 5/3.0 (+1) | 1,560 (+11%) | 0mo | $167,000 | $107 | 37 |
| 1738 Flint Ave | 0.74mi | 3/2.0 (-1) | 1,536 (+10%) | 22mo | $125,000 | $81 | 26 |
Match score weights: distance 35% · size 25% · config 20% · recency 20%. Top-matched comps best support the ARV.
Projected returns pro-forma
-3.0% appreciation · 4.51% rent growth · sell at horizon
- IRR
- -4.9%
- Equity multiple
- 0.81×
- Total profit
- $-9,938
- Equity at exit
- $28,315
- IRR
- 6.4%
- Equity multiple
- 1.51×
- Total profit
- $27,253
- Equity at exit
- $16,419
Cash invested: $53,172 (down + closing). Projections, not guarantees.
Landlord ↔ Tenant lean methodology
- Overall (STATE)
- 73 Landlord-Friendly
- State Ohio
- 73 Landlord-Friendly · R+6
- County
- — inherits STATE
- City
- — inherits STATE
ZIP-level market 44305
- Rents YoY
- 4.5%
- Active inventory
- 101
- Price-to-rent
- 15.9×
Monthly cashflow live
- Estimated rent
- $1,989 high interval (Pro) →
- Mortgage (P&I)
- −$996
- Tax from tax record
- −$218 /mo · $2,612/yr
- Insurance
- −$79
- HOA
- −$0
- Vacancy / Maint / Mgmt
- −$418
- Net cashflow
- $279
Break-even live
2-unit breakdown (identical units grouped — click to expand)
| Units | Beds | Baths | Est. rent |
|---|---|---|---|
| 2× units | 2 | 1 | $1,990 |
| #1 | 2 | 1 | $995 |
| #2 | 2 | 1 | $995 |
| Total (2 units) | $1,989 | ||
UW: 25.0% down · 7.5% · 30yr · 1.5% tax · 5.0% vac · 8.0% maint · 8.0% mgmt
Financing live
Cash to close
- Down payment
- $47,475
- Closing costs
- $5,697
- Reserves months
- —
- Total cash needed
- —
Loan-product check · same deal, 3 products live
Conventional
25% down · 7.5% · 30yr
- Down + closing
- —
- Monthly P&I
- —
- Monthly cashflow
- —
- DSCR
- —
- Eligible?
- —
Personal DTI + credit; lowest rate.
DSCR
20% down · 8.5% · 30yr
- Down + closing
- —
- Monthly P&I
- —
- Monthly cashflow
- —
- DSCR
- —
- Eligible?
- —
No personal income docs; deal must DSCR.
Hard money
10% down · 12.0% · 12mo
- Down + closing
- —
- Monthly P&I
- —
- Monthly cashflow
- —
- DSCR
- —
- Eligible?
- —
Short-term bridge; refi at stabilization.
Rent comps 10 comps
| Address | Beds | Baths | Sqft | Rent | $/sqft | DOM | Units | Dist |
|---|---|---|---|---|---|---|---|---|
| 248 Malacca St Akron, OH | 3.0 | 2.0 | 1854 | $1,350 | $0.73 | 44d | 1 | 0.14mi |
| 1598 Pilgrim St Akron, OH | 3.0 | 1.0 | 1352 | $1,550 | $1.15 | 44d | 1 | 0.69mi |
| 1438 Newton St Akron, OH | 4.0 | 1.0 | 1429 | $1,375 | $0.96 | 23d | 1 | 0.99mi |
| 1395 Goodyear Blvd Akron, OH | 3.0 | 1.5 | 1542 | $1,450 | $0.94 | 44d | 1 | 1.04mi |
| 1297 Pondview Ave Akron, OH | 4.0 | 1.0 | 1373 | $1,450 | $1.06 | 23d | 1 | 1.18mi |
| 288 Kryder Ave Akron, OH | 4.0 | 1.0 | 1400 | $1,450 | $1.04 | 44d | 1 | 1.21mi |
| 1635 Bronson Rd Akron, OH | 3.0 | 1.0 | 1110 | $1,245 | $1.12 | 14d | 1 | 1.24mi |
| 1318 Arnold Ave Akron, OH | 3.0 | 1.0 | 1056 | $1,450 | $1.37 | 44d | 1 | 1.28mi |
| 589 Eastland Ave Akron, OH | 3.0 | 1.5 | 1345 | $1,300 | $0.97 | 44d | 1 | 1.29mi |
| 208 Barder Ave Akron, OH | 3.0 | 1.0 | 924 | $1,050 | $1.14 | 44d | 1 | 1.34mi |
Listing history 7 events
-
2026-06-18days on market $189,900 Active 7 DOM
-
2026-06-17days on market $189,900 Active 6 DOM
-
2026-06-16days on market $189,900 Active 5 DOM
-
2026-06-15days on market $189,900 Active 4 DOM
-
2026-06-14days on market $189,900 Active 2 DOM
-
2026-06-13remarks 699-char remark
-
2026-06-13$189,900 Active 1 DOM
ⓘ Source: listings_history table (triggers on properties + properties_extension) + one-shot
backfill from property_details.listing_events for pre-trigger history.
Tax reassessment forecast OH · Partial reset (capped growth)
- Current annual tax
- $2,612 · $218/mo
- Projected year-2 tax
- $2,787 · $232/mo
- Expected delta
- +$175/yr (+$15/mo · 6.7%)
ⓘ Screening estimate from a state-policy table — verify with the county assessor before closing.
Climate risk First Street
- Flood 1/10 Low FEMA zone X (unshaded) · 0% chance over 30 yrs
- Wildfire 1/10 Low
- Heat 3/10 Moderate 7 d/yr ≥96°F today · 16 d/yr by 30 yrs out
- Wind 1/10 Low
- Air quality 3/10 Moderate 2 unhealthy d/yr today · 4 by 30 yrs out
Nearby sold comps map
Loading sold comps map…
Walkable amenities ~0.75 mi
Loading nearby amenities…
Taxation est. · year 1
- Rental income
- $23,868
- − Mortgage interest
- −$10,637
- − Property taxes
- −$2,612
- − Insurance
- −$950
- − Repairs & maintenance
- −$1,909
- − Management
- −$1,909
- − Depreciation
- −$5,524
- Taxable income
- $326
- Est. tax owed @ 24.0%
- −$78
- After-tax cash flow
- $3,266/yr
For passive investors: Depreciation is non-cash, so a rental often shows a tax loss while cash-flowing — sheltering income. Rental losses are passive: they offset passive income freely, and up to $25,000/yr can offset ordinary (W-2) income if you actively participate and your MAGI is under $100k (phasing out to $0 by $150k); unused losses carry forward. On sale, claimed depreciation is recaptured at up to 25%, and gains may owe capital-gains tax (a 1031 exchange can defer both). Figures are a year-1 estimate at your 24.0% rate — not tax advice; consult a CPA.
Schools (NCES district)
- District
- Akron City
- NCES district ID
- 3904348
- Math proficiency
- 22% ▼ -17.00%
- Reading proficiency
- 30% ▼ -12.00%
- Median HH income
- $33,811
- Composite
- 21.31/100
- National rank
- #8383
- State rank
- #602 of 656 in OH
Livability — Akron
- Score
- 81/100
- State rank
- #104
- US rank
- #1591
Category grades
Schools grade is shown separately in the Schools card above.
Census & demographics
- Census place
- Akron, OH
- County
- Summit County · 440,783 people
- City population
- 174,375
- Metro
- Akron, OH
- Population (ZIP)
- 21,103
- Household income
- $52,768
- Rent vs Own
- Severe rent burden
- 1021.0
Population outlook (Summit County) Hauer SSP2
- Today (2025)
- 546,583 people
- By 2030
- 544,028 · -0.5%
- By 2040
- 531,363 · -2.8%
- By 2050
- 514,923 · -5.8%
- By 2075
- 481,765 · -11.9%
- By 2100
- 432,265 · -20.9%
Race, ethnicity, and origin ACS 2023
- Neighborhood character
- Diverse neighborhood (Simpson 0.57)
- Race & ethnicity
- White 62% Black 20% Two or more races 12% Asian 5% Hispanic / Latino 2%
- Common ancestry
- Lithuanian 3% Slovak 2% Romanian 2%
- Foreign-born
- 4% · India, Philippines, Canada
- Languages at home
- 94% English-only · Other Asian/Pacific 3% Other Indo-European 1% Spanish 1%
Political lean MEDSL · Summit
- 2024 margin
- Lean D (+7.0) · D 53.0% · R 46.0%
- 2008→2024 swing
- -9.6pp toward R · 2008: 16.6pp · 2024: 7.0pp
- All cycles
- 2024: D+7.0 2020: D+9.6 2016: D+8.2 2012: D+14.8 2008: D+16.6
Not yet ingested
- Civics
- —
Market trends
- HPI YoY
- ▼ -140.39%
- Current HPI
- 190.6223
- Rent YoY
- ▲ 4.51%
- Metro
- Akron, OH
- State GDP YoY
- ▲ 1.98%
- F500 in state
- 48
Industry mix (Fortune 500 HQ in OH)
| Industry | F500 HQs | Revenue |
|---|---|---|
| Insurance | 3 | $145B |
|
||
| Industrial Machinery | 3 | $49B |
|
||
| Financial Services | 3 | $24B |
|
||
| Consumer Goods | 2 | $93B |
|
||
| Aerospace / Defense | 2 | $47B |
|
||
| Utilities | 2 | $33B |
|
||
Price history
+280.6% since first listed6 events — show timeline
- 2026-06-11 Listed $189,900 MLSNOW
- 2013-05-01 Sold (Public Records) $44,700 Public Records
- 2013-04-30 Sold (MLS) $44,700 MLSNOW
- 2013-04-16 Listed $46,900 MLSNOW
- 2013-03-29 Listing Removed — MLSNOW
- 2012-12-13 Listed $49,900 MLSNOW
Property tax history
+1.4%/yrLatest (2025): $2,612 · -2.2% YoY. Source: county tax records.
Cash-flow waterfall
monthlySold comps — $/sqft
last 12 mo · ≤1 miLoading sold comps…