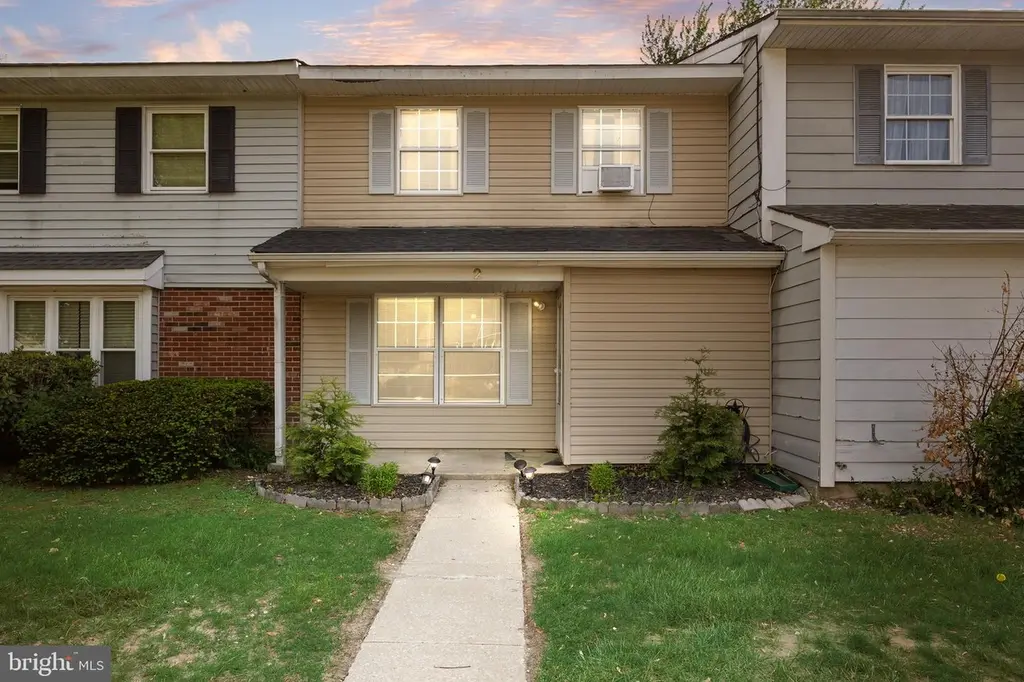
2 Vernon Ct · Sicklerville, NJ
Flood risk 1/10 · Minimal
- FEMA flood zone
- X (unshaded)
- Chance of flooding over 30 yrs
- 0.0%
- Est. flood insurance / yr
- $507 – $1,088
Fire risk 4/10 · Minor
- Est. fire insurance / yr
- $526 – $976
Heat risk 6/10 · Moderate
- Hot days now (above 104°F)
- 7 days/yr
- Hot days in 30 yrs
- 14 days/yr
Wind risk 6/10 · Moderate
- Chance of severe wind over 30 yrs
- 67.0%
Air-quality risk 3/10 · Minor
- Unhealthy air days now
- 2 days/yr
- Unhealthy air days in 30 yrs
- 4 days/yr
Risk factors via First Street. Map © Google.
Why this score? — see what drove the D+ grade
The composite is a weighted blend of 9 inputs, each scored 0–100. Each bar is that input's sub-score; the figure is the points it added to the 100-point composite (weight × sub-score).
- Cash flow +18.9/30.0
- ARV discount +8.6/15.0
- 1% rule +5.9/10.0
- DSCR +5.9/10.0
- Rent growth +3.4/5.0
- Livability +2.5/5.0
- Condition / age +2.5/5.0
- Schools +2.3/10.0
- Appreciation +0.0/10.0
$215,000
🖨 Deal sheet 📄 Offer letter ✓ Due diligence
Listing remarks
Welcome to 2 Vernon Ct in the desirable Victoria Manor section of Sicklerville—an excellent opportunity for buyers looking to add their personal touch! This 3-bedroom, 1.5-bath home offers a functional layout with tons of potential, making it perfect for a first-time homebuyer or someone looking to downsize. Step inside to find a bright and inviting space with recent updates already in place, including an upgraded full bathroom and updated flooring on the lower level. The home offers comfortable living areas and generously sized bedrooms, providing a solid foundation to make it your own. Situated on a quiet street within Victoria Manor, this property offers both convenience and value,
Key facts
- $105 HOA
- Built 1973
- Listed 21 days
Property features AI
Finance
- Other: Year built and finished area sourced from assessor; Ownership assessed values noted
- HOA & community: HOA fee approximately $105 per month
Exterior
- Parking: Parking lot
- Utilities: Public water; Public sewer; Natural gas available
- Home design: Interior townhouse/rowhouse; Fee simple ownership
- Construction: Frame construction; Concrete perimeter foundation; Above-grade and below-grade structures noted; Finished above-grade area per assessor
- Exterior features: Lot dimensions approximately 20 x 100
Interior
- Bedrooms: 3 bedrooms on the main level
- Bathrooms: 2 full bathrooms on the main level; 2 full bathrooms total
- Heating & cooling: 90% forced air heating; Natural gas hot water; Window air conditioning units (electric)
- Interior features: No basement; Living area per assessor
Neighborhood map
What this means for you Summary
Snapshot
- This is a 3-bed/2.0-bath townhouse listed at $215k.
Deal economics
- At list price, monthly cash flow is $220 ($3k/yr) — positive.
- The deal already cash-flows at list — no discount required.
- Meets the 1% rule at list price ($2k rent vs $215k).
- Recommended offer: $212k (1.5% below list) — sets the bar for market timing.
- Cap rate 7.5% vs local median 4.7% in Sicklerville — top-decile yield for the area; either an underpriced asset or a hidden risk that comps aren't pricing in. Stress-test before assuming the spread holds.
Location & tenants
- Location reads: area grade D — affects rentability + tenant quality, not the cash-flow math above.
- Winslow Township School District (suburban): math 11% / reading 36% proficiency, ranked #387 of 472 in NJ (top 82%) — low school quality limits family demand, transient renter base, plan for 1-2y turnover.
- Market conditions: Rents rising (+3.4%/yr); 329 active listings in the ZIP; 11 comparable units currently listed for rent nearby; rentals leasing fast (median 3d on market — plan ~1-2 weeks tenant-placement turnaround); solid renter incomes; 1,018 units permitted in Camden County in 2024 (509 in 5+ unit buildings).
Forward outlook
- Local home prices are declining (-3.0%/yr); year-one equity from $1k of loan paydown is wiped out by about $6k of value loss. Plan a longer hold.
- Camden County population projected to shrink 8% by 2050 — rents likely to lag national; underwrite the cash flow, not the appreciation.
Negotiation context
- It's been on market 21 days — a 2% lower offer ($212k) is reasonable based on typical stale-listing flexibility.
- 7 sale attempts since 26y ago with the ask held roughly flat each time — persistent listings suggest the price (not the market) is what's stuck; bring a comps-based counter.
- Current owner paid $89k; list at $215k implies a 141% gain — meaningful room to come down on a strong offer.
Risks & watch-outs
- Climate carrying-cost: major wind risk, 67% chance of damaging wind over 30y; extreme-heat days projected 7→14/yr by 2055 (HVAC capex compounding) — expect insurance premiums to compound above CPI over the hold.
Questions for the listing agent
- Built in 1973 — when were the roof, HVAC, electrical panel, plumbing, and water heater last replaced?
- What does the HOA fee cover, when was the last increase, and are there any pending special assessments or reserve-fund shortfalls?
- Is there a deadline driving the sale (1031 exchange, divorce, estate, relocation)? That informs how much negotiation room exists.
- The area grade is low — what's the realistic commute time and amenity access for the typical tenant pool here? Any planned neighborhood developments (good or bad) we should know about?
- What's the average days-on-market for RENTAL listings here right now (not sales)? A rising rental-DOM trend means longer vacancies and softer asking-rent achievability than the comps imply.
- What's the recent tenant-quality profile in this submarket — average credit score on applications, eviction rate, late-payment / NSF rate, and stable-employment percentage? A property-management company in the area should have these aggregated.
- How much new for-sale + rental construction is in the pipeline within 1–3 miles? Heavy new supply typically softens prices + rents 12–24 months out; constrained supply supports both.
Investment metrics
- 1% rule
- 1.09% ✓
- Cap rate
- 7.52%
- Cash-on-cash
- 4.38%
- DSCR
- 1.19
- GRM
- 7.7
CMA / ARV
- ARV (median comp)
- $220,554
- List price
- $215,000
- Delta
- -2.52%
- Verdict
- FAIR
- Comps
- 20 within 1.0 mi
Show comp detail 12 sales within ~0.75 mi
| Address | Dist | Beds/Ba | Sqft | Sold | Price | $/sf | Match |
|---|---|---|---|---|---|---|---|
| 28 Melwood Ct | 0.18mi | 3/1.5 | 1,370 (-2%) | 7mo | $190,000 | $139 | 81 |
| 24 Magnolia Ct | 0.14mi | 3/1.5 | 1,462 (+5%) | 2mo | $215,000 | $147 | 81 |
| 52 Memphis Ct | 0.25mi | 3/1.5 | 1,370 (-2%) | 4mo | $200,000 | $146 | 80 |
| 9 Melwood Ct | 0.19mi | 3/1.5 | 1,450 (+4%) | 5mo | $200,000 | $138 | 78 |
| 29 Medford Ct | 0.19mi | 3/1.5 | 1,462 (+5%) | 6mo | $215,000 | $147 | 76 |
| 19 Vernon Ct | 0.05mi | 2/1.5 (-1) | 1,300 (-7%) | 7mo | $235,000 | $181 | 74 |
| 12 Villanova Ct | 0.19mi | 3/1.5 | 1,280 (-8%) | 3mo | $213,500 | $167 | 73 |
| 51 High Mdws | 0.63mi | 3/1.5 | 1,408 (+1%) | 2mo | $275,000 | $195 | 65 |
| 18 High Meadows Dr | 0.56mi | 3/1.5 | 1,408 (+1%) | 6mo | $275,000 | $195 | 65 |
| 1 Meadowood Ln | 0.60mi | 2/1.5 (-1) | 1,408 (+1%) | 2mo | $272,000 | $193 | 61 |
| 96 High Meadows Dr | 0.68mi | 3/1.5 | 1,353 (-3%) | 3mo | $280,000 | $207 | 59 |
| 23 High Meadows Dr | 0.59mi | 2/1.5 (-1) | 1,342 (-4%) | 8mo | $260,000 | $194 | 53 |
Match score weights: distance 35% · size 25% · config 20% · recency 20%. Top-matched comps best support the ARV.
Projected returns pro-forma
-3.0% appreciation · 3.41% rent growth · sell at horizon
- IRR
- -8.9%
- Equity multiple
- 0.67×
- Total profit
- $-19,757
- Equity at exit
- $32,057
- IRR
- 1.2%
- Equity multiple
- 1.09×
- Total profit
- $5,303
- Equity at exit
- $18,589
Cash invested: $60,200 (down + closing). Projections, not guarantees.
Landlord ↔ Tenant lean methodology
- Overall (STATE)
- 21 Tenant-Leaning
- State New Jersey
- 21 Tenant-Leaning · D+6
- County
- — inherits STATE
- City
- — inherits STATE
ZIP-level market 08081
- Rents YoY
- 3.4%
- Active inventory
- 329
- Price-to-rent
- 7.7×
Monthly cashflow live
- Estimated rent
- $2,333 high interval (Pro) →
- Mortgage (P&I)
- −$1,127
- Tax from tax record
- −$301 /mo · $3,616/yr
- Insurance
- −$90
- HOA
- −$105
- Vacancy / Maint / Mgmt
- −$490
- Net cashflow
- $220
Break-even live
UW: 25.0% down · 7.5% · 30yr · 1.5% tax · 5.0% vac · 8.0% maint · 8.0% mgmt
Financing live
Cash to close
- Down payment
- $53,750
- Closing costs
- $6,450
- Reserves months
- —
- Total cash needed
- —
Loan-product check · same deal, 3 products live
Conventional
25% down · 7.5% · 30yr
- Down + closing
- —
- Monthly P&I
- —
- Monthly cashflow
- —
- DSCR
- —
- Eligible?
- —
Personal DTI + credit; lowest rate.
DSCR
20% down · 8.5% · 30yr
- Down + closing
- —
- Monthly P&I
- —
- Monthly cashflow
- —
- DSCR
- —
- Eligible?
- —
No personal income docs; deal must DSCR.
Hard money
10% down · 12.0% · 12mo
- Down + closing
- —
- Monthly P&I
- —
- Monthly cashflow
- —
- DSCR
- —
- Eligible?
- —
Short-term bridge; refi at stabilization.
Rent comps 11 comps
| Address | Beds | Baths | Sqft | Rent | $/sqft | DOM | Units | Dist |
|---|---|---|---|---|---|---|---|---|
| 8 Vernon Ct Sicklerville, NJ | 3.0 | 1.5 | 1300 | $1,900 | $1.46 | 3d | 1 | 0.03mi |
| 4 Milstone Ct Sicklerville, NJ | 3.0 | 1.5 | 1462 | $2,400 | $1.64 | 1d | 1 | 0.13mi |
| 28 Magnolia Ct Sicklerville, NJ | 3.0 | 1.5 | 1450 | $2,000 | $1.38 | 43d | 1 | 0.14mi |
| 46 Magnolia Ct Sicklerville, NJ | 2.0 | 1.5 | 1370 | $2,200 | $1.61 | 2d | 1 | 0.17mi |
| 27 Villanova Ct Sicklerville, NJ | 3.0 | 1.5 | 1280 | $2,300 | $1.80 | 2d | 1 | 0.17mi |
| 28 Melwood Ct Sicklerville, NJ | 3.0 | 1.5 | 1370 | $2,500 | $1.82 | 15d | 1 | 0.19mi |
| 9 Marcia Ct Unit 9 Sicklerville, NJ | 3.0 | 1.5 | 1462 | $2,000 | $1.37 | 1d | 1 | 0.22mi |
| 25 Memphis Ct Sicklerville, NJ | 3.0 | 1.5 | 1450 | $2,000 | $1.38 | 18d | 1 | 0.23mi |
| 16 High Meadows Dr Sicklerville, NJ | 3.0 | 1.5 | 1353 | $2,600 | $1.92 | 43d | 1 | 0.56mi |
| 110 High Meadows Dr Sicklerville, NJ | 3.0 | 1.5 | 1408 | $2,400 | $1.70 | 43d | 1 | 0.70mi |
| 3 Lawrence Ct Sicklerville, NJ | 2.0 | 1.0 | 968 | $1,850 | $1.91 | 1d | 1 | 0.98mi |
HOA detail
- Monthly dues
- $105 · $1,260/yr
Listing history 27 events
-
2026-06-18days on market $215,000 Active 21 DOM
-
2026-06-17days on market $215,000 Active 20 DOM
-
2026-06-16days on market $215,000 Active 19 DOM
-
2026-06-15days on market $215,000 Active 18 DOM
-
2026-06-13status $215,000 Active 16 DOM
-
2026-06-03statusdays on market $215,000 Pending 16 DOM
-
2026-06-02days on market $215,000 Active 15 DOM
-
2026-06-01days on market $215,000 Active 14 DOM
-
2026-05-31days on market $215,000 Active 13 DOM
-
2026-05-18$215,000 Active 966-char remark
-
2026-05-03historical $215,000 966-char remark
-
2012-11-30historical
-
2011-08-08$69,900
-
2011-03-31historical
-
2010-07-23$92,900
-
2005-07-20soldstatus $89,250
-
2005-06-22soldstatus $89,250
-
2005-05-15$89,250
-
2004-02-25soldstatus $53,000
-
2003-12-09$53,000
-
2000-07-05soldstatus $68,000
-
2000-05-19soldstatus $36,000
-
2000-05-01historical
-
2000-03-28$36,000
-
1995-03-09soldstatus $1,460,511
-
1987-10-15soldstatus $52,000
-
1980-08-01soldstatus $36,000
ⓘ Source: listings_history table (triggers on properties + properties_extension) + one-shot
backfill from property_details.listing_events for pre-trigger history.
Tax reassessment forecast NJ · Partial reset (capped growth)
- Current annual tax
- $3,616 · $301/mo
- Projected year-2 tax
- $4,485 · $374/mo
- Expected delta
- +$869/yr (+$72/mo · 24.0%)
ⓘ Screening estimate from a state-policy table — verify with the county assessor before closing.
Climate risk First Street
- Flood 1/10 Low FEMA zone X (unshaded) · 0% chance over 30 yrs
- Wildfire 4/10 Moderate
- Heat 6/10 Major 7 d/yr ≥104°F today · 14 d/yr by 30 yrs out
- Wind 6/10 Major 67% chance of damaging wind over 30 yrs
- Air quality 3/10 Moderate 2 unhealthy d/yr today · 4 by 30 yrs out
Nearby sold comps map
Loading sold comps map…
Walkable amenities ~0.75 mi
Loading nearby amenities…
Taxation est. · year 1
- Rental income
- $27,997
- − Mortgage interest
- −$12,043
- − Property taxes
- −$3,616
- − Insurance
- −$1,075
- − Repairs & maintenance
- −$2,240
- − Management
- −$2,240
- − HOA
- −$1,260
- − Depreciation
- −$6,255
- Taxable loss
- −$731
- Est. tax savings @ 24.0%
- +$175
- After-tax cash flow
- $2,812/yr
For passive investors: Depreciation is non-cash, so a rental often shows a tax loss while cash-flowing — sheltering income. Rental losses are passive: they offset passive income freely, and up to $25,000/yr can offset ordinary (W-2) income if you actively participate and your MAGI is under $100k (phasing out to $0 by $150k); unused losses carry forward. On sale, claimed depreciation is recaptured at up to 25%, and gains may owe capital-gains tax (a 1031 exchange can defer both). Figures are a year-1 estimate at your 24.0% rate — not tax advice; consult a CPA.
Schools (NCES district)
- District
- Winslow Township School District
- NCES district ID
- 3418060
- Math proficiency
- 11% ▼ -17.00%
- Reading proficiency
- 36% ▼ -5.00%
- Median HH income
- $70,254
- Composite
- 22.65/100
- National rank
- #8057
- State rank
- #387 of 472 in NJ
Livability — Sicklerville
No livability data for this city. (Only ~50 U.S. cities are tracked.)
Census & demographics
- Census place
- Sicklerville, NJ
- County
- Camden County · 407,624 people
- City population
- 50,264
- Metro
- Philadelphia-Camden-Wilmington, PA-NJ-DE-MD
- Population (ZIP)
- 50,264
- Household income
- $105,800
- Rent vs Own
- Severe rent burden
- 979.0
Population outlook (Camden County) Hauer SSP2
- Today (2025)
- 507,964 people
- By 2030
- 502,182 · -1.1%
- By 2040
- 485,602 · -4.4%
- By 2050
- 465,630 · -8.3%
- By 2075
- 419,986 · -17.3%
- By 2100
- 369,492 · -27.3%
Race, ethnicity, and origin ACS 2023
- Neighborhood character
- Diverse neighborhood (Simpson 0.65)
- Race & ethnicity
- White 47% Black 34% Two or more races 9% Hispanic / Latino 9% Asian 4%
- Hispanic origin (detail)
- Puerto Rican 5%
- Common ancestry
- Romanian 6% Slovak 2% Iranian 1%
- Foreign-born
- 8% · Canada, China, South Korea
- Languages at home
- 90% English-only · Spanish 4% Other Indo-European 1% Tagalog/Filipino 1%
Political lean MEDSL · Camden
- 2024 margin
- Strong D (+27.4) · D 63.0% · R 35.5% · Other 1.5%
- 2008→2024 swing
- -8.8pp toward R · 2008: 36.2pp · 2024: 27.4pp
- All cycles
- 2024: D+27.4 2020: D+33.5 2016: D+32.4 2012: D+36.6 2008: D+36.2
Not yet ingested
- Civics
- —
Market trends
- HPI YoY
- ▼ -176.48%
- Current HPI
- 303.1017
- Rent YoY
- ▲ 3.41%
- Metro
- Philadelphia-Camden-Wilmington, PA-NJ-DE-MD
- State GDP YoY
- ▲ 2.05%
- F500 in state
- 34
Industry mix (Fortune 500 HQ in NJ)
| Industry | F500 HQs | Revenue |
|---|---|---|
| Consumer Goods | 3 | $31B |
|
||
| Pharmaceuticals | 2 | $153B |
|
||
| Technology | 2 | $21B |
|
||
| Insurance | 2 | $20B |
|
||
| Healthcare | 2 | $19B |
|
||
| Financial Services | 1 | $70B |
|
||
Price history
+497.2% since first listed20 events — show timeline
- 2026-06-13 Relisted — BRIGHT MLS
- 2026-06-03 Pending — BRIGHT MLS
- 2026-05-18 Listed $215,000 BRIGHT MLS
- 2026-05-03 Coming Soon $215,000 BRIGHT MLS
- 2012-11-30 Listing Removed — BRIGHT MLS
- 2011-08-08 Listed $69,900 BRIGHT MLS
- 2011-03-31 Listing Removed — BRIGHT MLS
- 2010-07-23 Listed $92,900 BRIGHT MLS
- 2005-07-20 Sold (Public Records) $89,250 Public Records
- 2005-06-22 Sold (MLS) $89,250 BRIGHT MLS
- 2005-05-15 Listed $89,250 BRIGHT MLS
- 2004-02-25 Sold (MLS) $53,000 BRIGHT MLS
- 2003-12-09 Listed $53,000 BRIGHT MLS
- 2000-07-05 Sold (Public Records) $68,000 Public Records
- 2000-05-19 Sold (MLS) $36,000 BRIGHT MLS
- 2000-05-01 Listing Removed — BRIGHT MLS
- 2000-03-28 Listed $36,000 BRIGHT MLS
- 1995-03-09 Sold (Public Records) $1,460,511 Public Records
- 1987-10-15 Sold (Public Records) $52,000 Public Records
- 1980-08-01 Sold (Public Records) $36,000 Public Records
Property tax history
+0.9%/yrLatest (2025): $3,616 · +1.9% YoY. Source: county tax records.
Cash-flow waterfall
monthlySold comps — $/sqft
last 12 mo · ≤1 miLoading sold comps…