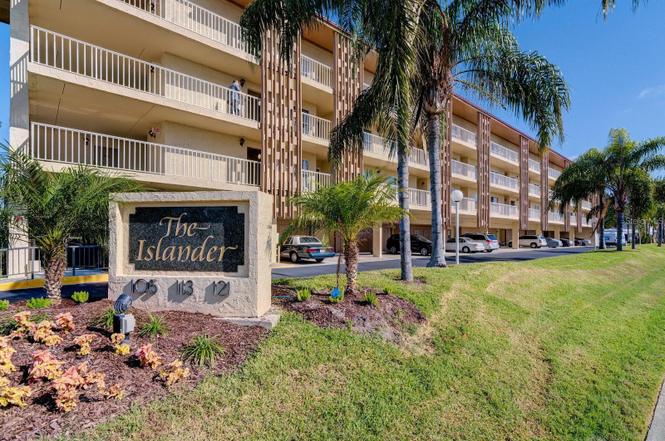
105 Island Way #132 · Clearwater, FL
Flood risk 10/10 · Severe
- FEMA flood zone
- AE
- Chance of flooding over 30 yrs
- 0.99%
- Est. flood insurance / yr
- $1,737 – $8,500
Fire risk 1/10 · Minimal
- Est. fire insurance / yr
- $947 – $1,759
Heat risk 10/10 · Severe
- Hot days now (above 111°F)
- 7 days/yr
- Hot days in 30 yrs
- 27 days/yr
Wind risk 10/10 · Severe
- Chance of severe wind over 30 yrs
- 99.0%
Air-quality risk 3/10 · Minor
- Unhealthy air days now
- 2 days/yr
- Unhealthy air days in 30 yrs
- 3 days/yr
Risk factors via First Street. Map © Google.
Why this score? — see what drove the D+ grade
The composite is a weighted blend of 9 inputs, each scored 0–100. Each bar is that input's sub-score; the figure is the points it added to the 100-point composite (weight × sub-score).
- 1% rule +10.0/10.0
- Cash flow +9.2/30.0
- ARV discount +7.5/15.0
- Appreciation +5.9/10.0
- Schools +4.3/10.0
- Livability +4.1/5.0
- Rent growth +3.2/5.0
- DSCR +2.6/10.0
- Condition / age +2.5/5.0
$220,000
🖨 Deal sheet 📄 Offer letter ✓ Due diligence
Listing remarks
One or more photo(s) has been virtually staged. Sophisticated elegance best describes this beautifully updated condo. This is a 2 bedroom with 2 full bath home that has high end finishes throughout. The kitchen has been opened to the main living area making it an open concept living space. The kitchen is finished with high end custom cabinets, stainless steel appliances and quarts countertops. The master retreat has a window with pool and water views. The master bath has custom walk-in shower with decorative glass tiles, custom cabinetry and his and hers separate sinks with quarts counter tops. The guest bath is a mirror image the designer finishes of the master bath. This home is also fini
Key facts
- Quartz countertops
- $1,150 HOA
- Community pool
Tags
Property features AI
Finance
- Other: Flood insurance required; Directions: From airports take Highway 60 west toward beaches. Right on Island Way; community is the 3rd building on the right.
- Financial info: Total annual association fees reported as $13,800; Lease restrictions apply
- HOA & community: Monthly condo fee of $1,150 (includes cable TV, internet, insurance, management, maintenance - structure & grounds, sewer, trash, water, escrow reserves); Association amenities: laundry, pool, spa/hot tub, shuffleboard court, storage, lobby key required, wheelchair access; Association approval required; Deed restrictions; Buyer approval required; Senior community
Exterior
- Parking: Covered parking; Guest parking; On-street parking; Basement parking
- Utilities: Public water; Public sewer; Cable connected; Electricity connected
- Home design: Condominium; One level; 4-story building; Faces south; On waterfront with canal views and water access
- Construction: Block construction; Other roof type; Building name: THE ISLANDER; Built on slab
- Exterior features: Outdoor grill; Outdoor shower; Sidewalks; Storage; Has spa (heated, in-ground); In-ground heated pool (gunite)
Interior
- Kitchen: Cooktop; Range; Dishwasher; Refrigerator
- Bedrooms: 2 bedrooms
- Flooring: Ceramic tile; Slab foundation
- Bathrooms: 2 full bathrooms
- Heating & cooling: Central heating; Central air conditioning
- Interior features: Ceiling fans; Living room / dining room combo; Split bedroom floor plan; Stone countertops; Elevator in building
- Laundry & utility: Dedicated laundry room
Neighborhood map
What this means for you Summary
Snapshot
- This is a 2-bed/2.0-bath condo listed at $220k.
Deal economics
- At list price, monthly cash flow is $-592 ($-7k/yr) — negative.
- To cash-flow at today's rent, offer at most $115k (47.6% below list).
- Meets the 1% rule at list price ($3k rent vs $220k).
- Recommended offer: $115k (47.6% below list) — sets the bar for cash-flow.
- Cap rate 5.4% vs local median 2.9% in Clearwater — top-decile yield for the area; either an underpriced asset or a hidden risk that comps aren't pricing in. Stress-test before assuming the spread holds.
Location & tenants
- Location reads 82/100 on livability (#60 in FL, #988 nationally) — a professional / high-income tenant draw. Strengths: commute A+, housing A+, health & safety A+; Watch: schools C-, employment C-.
- Pinellas (suburban): math 51% / reading 51% proficiency, ranked #31 of 73 in FL (top 42%) — acceptable for families but not a draw, mixed tenant base, ~2y average lease.
- Market conditions: Rents rising (+2.8%/yr); 424 active listings in the ZIP; 40 comparable units currently listed for rent nearby; rentals at typical pace (median 25d on market — plan ~3-4 weeks tenant-placement turnaround); high-income renter base; 2,676 units permitted in Pinellas County in 2024 (1,422 in 5+ unit buildings).
- This rent runs 34% of the median local income ($117k/yr) — at the standard rent-burdened threshold; future hikes will face affordability resistance.
Forward outlook
- In year one you build about $6k of equity ($2k loan paydown + $4k appreciation (1.9% local appreciation)).
- Pinellas County population projected at +14% by 2050 — modest demand growth; plan on rents tracking national, not racing it.
- By year 6, paydown + projected appreciation supports a ~$31k cash-out refi (75% LTV) — recoverable capital for the next deal without selling this one.
Negotiation context
- It's been on market 224 days — a 12% lower offer ($194k) is reasonable based on typical stale-listing flexibility.
- 11 sale attempts since 14y ago; this cycle's ask has dropped $49k (18%) from the opening price — seller is motivated, your offer sets the floor, not the list.
- Current owner paid $134k; list at $220k implies a 64% gain — meaningful room to come down on a strong offer.
Risks & watch-outs
- Watch-outs: flood insurance adds $427/mo; HOA is 35% of rent.
- Climate carrying-cost: in FEMA flood zone AE (mandatory federal flood insurance); severe wind risk, 99% chance of damaging wind over 30y; extreme-heat days projected 7→27/yr by 2055 (HVAC capex compounding) — expect insurance premiums to compound above CPI over the hold.
Questions for the listing agent
- What do current leases actually rent for vs. the listed asking? Can we see a recent rent roll and the last 12 months of T-12 income?
- It's been on market 224 days. Have you received any prior offers? Is the seller open to a 48% concession, seller financing, or rate buy-down credit?
- Built in 1972 — when were the roof, HVAC, electrical panel, plumbing, and water heater last replaced?
- What's the actual annual flood-insurance premium (NFIP or private), and is the property in a SFHA with mandatory coverage?
- What does the HOA fee cover, when was the last increase, and are there any pending special assessments or reserve-fund shortfalls?
- Any open or pending special assessments — roof, HVAC, plumbing, elevator, façade? What's the per-unit balance and payoff schedule, and is the seller paying it off at close or rolling it to the buyer?
- Why hasn't it sold? Are there any deal-killer items the seller is aware of (foundation, flood, title, zoning, code violations)?
- Is there a deadline driving the sale (1031 exchange, divorce, estate, relocation)? That informs how much negotiation room exists.
- The area grade is low — what's the realistic commute time and amenity access for the typical tenant pool here? Any planned neighborhood developments (good or bad) we should know about?
- What's the average days-on-market for RENTAL listings here right now (not sales)? A rising rental-DOM trend means longer vacancies and softer asking-rent achievability than the comps imply.
- What's the recent tenant-quality profile in this submarket — average credit score on applications, eviction rate, late-payment / NSF rate, and stable-employment percentage? A property-management company in the area should have these aggregated.
- How much new apartment / multifamily construction is in the pipeline within 1–3 miles? Heavy new supply (>2% of stock underway) typically softens rents 12–24 months out; light construction supports rent growth.
Investment metrics
- 1% rule
- 1.50% ✓
- Cap rate
- 5.39%
- Cash-on-cash
- -3.23%
- DSCR
- 0.86
- GRM
- 5.5
CMA / ARV
No comps found within radius.
Projected returns pro-forma
1.88% appreciation · 2.76% rent growth · sell at horizon
- IRR
- -7.2%
- Equity multiple
- 0.62×
- Total profit
- $-23,675
- Equity at exit
- $85,377
- IRR
- -1.7%
- Equity multiple
- 0.77×
- Total profit
- $-14,394
- Equity at exit
- $121,881
Cash invested: $61,600 (down + closing). Projections, not guarantees.
Landlord ↔ Tenant lean methodology
- Overall (STATE)
- 87 Strongly Landlord-Friendly
- State Florida
- 87 Strongly Landlord-Friendly · R+3
- County
- — inherits STATE
- City
- — inherits STATE
ZIP-level market 33767
- Home prices YoY
- 0.6%
- Rents YoY
- 2.8%
- Active inventory
- 424
- Price-to-rent
- 5.5×
Monthly cashflow live
- Estimated rent
- $3,310 high interval (Pro) →
- Mortgage (P&I)
- −$1,154
- Tax from tax record
- −$385 /mo · $4,624/yr
- Insurance
- −$92
- Flood insurance flood zone
- −$427 /mo · $5,118/yr
- HOA
- −$1,150
- Vacancy / Maint / Mgmt
- −$695
- Net cashflow
- $-592
Break-even live
UW: 25.0% down · 7.5% · 30yr · 1.5% tax · 5.0% vac · 8.0% maint · 8.0% mgmt
Financing live
Cash to close
- Down payment
- $55,000
- Closing costs
- $6,600
- Reserves months
- —
- Total cash needed
- —
Loan-product check · same deal, 3 products live
Conventional
25% down · 7.5% · 30yr
- Down + closing
- —
- Monthly P&I
- —
- Monthly cashflow
- —
- DSCR
- —
- Eligible?
- —
Personal DTI + credit; lowest rate.
DSCR
20% down · 8.5% · 30yr
- Down + closing
- —
- Monthly P&I
- —
- Monthly cashflow
- —
- DSCR
- —
- Eligible?
- —
No personal income docs; deal must DSCR.
Hard money
10% down · 12.0% · 12mo
- Down + closing
- —
- Monthly P&I
- —
- Monthly cashflow
- —
- DSCR
- —
- Eligible?
- —
Short-term bridge; refi at stabilization.
Rent comps 40 comps
| Address | Beds | Baths | Sqft | Rent | $/sqft | DOM | Units | Dist |
|---|---|---|---|---|---|---|---|---|
| 105 Island Way Clearwater, FL | 2.0 | 2.0 | 1090 | $3,400 | $3.12 | 24d | 3 | 0.04mi |
| 51 Island Way Clearwater, FL | 1.0–2.0 | 1.0–2.0 | 823 | $2,700 | $3.28 | 15d | 2 | 0.04mi |
| 121 Island Way #323 Clearwater Beach, FL | 2.0 | 2.0 | 1090 | $2,950 | $2.71 | 7d | 1 | 0.08mi |
| 255 Dolphin Pt Clearwater, FL | 1.0–2.0 | 1.0–2.0 | 1055 | $2,950 | $2.80 | 18d | 4 | 0.25mi |
| 333 Island Way Unit 1 Clearwater, FL | 1.0 | 1.0 | 717 | $2,295 | $3.20 | 7d | 1 | 0.28mi |
| 400 Island Way Clearwater, FL | 2.0 | 2.0 | 1315 | $2,975 | $2.26 | 24d | 5 | 0.29mi |
| 400 Island Way Clearwater, FL | 2.0 | 2.0 | 1315 | $3,075 | $2.34 | 3d | 5 | 0.29mi |
| 241 Skiff Pt #1 Clearwater Beach, FL | 2.0 | 2.0 | 793 | $2,500 | $3.15 | 24d | 1 | 0.37mi |
| 185 Brightwater Dr #4 Clearwater, FL | 1.0 | 1.0 | 790 | $3,100 | $3.92 | 24d | 1 | 0.60mi |
| 185 Brightwater Dr #6 Clearwater, FL | 2.0 | 2.0 | 1430 | $3,900 | $2.73 | 24d | 1 | 0.60mi |
| 610 Island Way #608 Clearwater Beach, FL | 2.0 | 2.0 | 1270 | $2,900 | $2.28 | 24d | 1 | 0.65mi |
| 868 Bayway Blvd #312 Clearwater Beach, FL | 2.0 | 2.0 | 1181 | $3,000 | $2.54 | 24d | 1 | 0.67mi |
| 110 Devon Dr Clearwater Beach, FL | 3.0 | 2.0 | 1377 | $6,500 | $4.72 | 24d | 1 | 0.68mi |
| 644 Island Way #304 Clearwater Beach, FL | 2.0 | 2.0 | 1335 | $2,700 | $2.02 | 24d | 1 | 0.70mi |
| 895 S Gulfview Blvd Clearwater, FL | 2.0 | 2.0 | 1094 | $3,900 | $3.56 | 24d | 2 | 0.72mi |
| 855 Bayway Blvd #907 Clearwater Beach, FL | 2.0 | 2.0 | 1260 | $3,100 | $2.46 | 18d | 1 | 0.73mi |
| 855 Bayway Blvd #806 Clearwater Beach, FL | 2.0 | 2.0 | 1310 | $2,600 | $1.98 | 24d | 1 | 0.73mi |
| 650 Island Way Clearwater, FL | 2.0 | 2.0 | 1355 | $3,150 | $2.32 | 13d | 1 | 0.75mi |
| 650 Island Way Clearwater, FL | 2.0 | 2.0 | 1355 | $3,050 | $2.25 | 18d | 2 | 0.75mi |
| 851 Bayway Blvd #905 Clearwater Beach, FL | 2.0 | 2.0 | 1310 | $4,500 | $3.44 | 24d | 1 | 0.76mi |
| 11 San Marco St #1206 Clearwater Beach, FL | 2.0 | 2.0 | 1460 | $7,000 | $4.79 | 24d | 1 | 0.78mi |
| 830 S Gulfview Blvd #406 Clearwater Beach, FL | 2.0 | 2.0 | 1310 | $5,000 | $3.82 | 24d | 1 | 0.78mi |
| 845 S Gulfview Blvd #101 Clearwater Beach, FL | 2.0 | 2.0 | 1074 | $4,000 | $3.72 | 24d | 1 | 0.81mi |
| 800 S Gulfview Blvd Clearwater, FL | 2.0 | 2.0 | 1285 | $2,450 | $1.91 | 14d | 2 | 0.81mi |
| 445 S Hamden Dr Unit 1 Clearwater, FL | 2.0 | 2.0 | 1500 | $3,000 | $2.00 | 24d | 1 | 0.90mi |
| 690 Island Way Clearwater, FL | 1.0–2.0 | 1.5–2.5 | 1150 | $3,500 | $3.04 | 2d | 3 | 0.91mi |
| 675 S Gulfview Blvd #902 Clearwater Beach, FL | 2.0 | 2.0 | 1409 | $5,750 | $4.08 | 24d | 1 | 0.94mi |
| 700 Island Way #501 Clearwater Beach, FL | 1.0 | 1.5 | 1235 | $2,800 | $2.27 | 24d | 1 | 0.98mi |
| 500 N Osceola Ave Clearwater, FL | 2.0 | 2.0 | 1075 | $2,275 | $2.12 | 18d | 2 | 0.99mi |
| 500 N Osceola Ave #502 Clearwater, FL | 2.0 | 2.0 | 1060 | $2,450 | $2.31 | 7d | 1 | 1.01mi |
| 440 S Gulfview Blvd #1105 Clearwater Beach, FL | 2.0 | 2.0 | 1186 | $2,750 | $2.32 | 24d | 1 | 1.01mi |
| 440 S Gulfview Blvd #1102 Clearwater Beach, FL | 2.0 | 2.0 | 1264 | $5,000 | $3.96 | 24d | 1 | 1.01mi |
| 450 S Gulfview Blvd Clearwater Beach, FL | 2.0 | 2.0 | 1186 | $2,850 | $2.40 | 24d | 1 | 1.02mi |
| 450 S Gulfview Blvd Unit 1546100P Clearwater, FL | 2.0 | 2.0 | 1259 | $3,475 | $2.76 | 7d | 1 | 1.02mi |
| 450 S Gulfview Blvd #1606 Clearwater Beach, FL | 2.0 | 2.0 | 1264 | $2,900 | $2.29 | 24d | 1 | 1.02mi |
| 450 S Gulfview Blvd #1208 Clearwater Beach, FL | 2.0 | 2.0 | 1186 | $2,950 | $2.49 | 24d | 1 | 1.02mi |
| 450 S Gulfview Blvd #907 Clearwater Beach, FL | 2.0 | 2.0 | 1264 | $4,500 | $3.56 | 24d | 1 | 1.02mi |
| 450 S Gulfview Blvd #405 Clearwater Beach, FL | 2.0 | 2.0 | 1186 | $3,500 | $2.95 | 24d | 1 | 1.02mi |
| 100 Pierce St Clearwater, FL | 1.0–2.0 | 2.0 | 1479 | $3,100 | $2.10 | 4d | 2 | 1.11mi |
| 741 Lantana Ave Clearwater Beach, FL | 2.0 | 1.5 | 1077 | $3,695 | $3.43 | 18d | 1 | 1.16mi |
HOA detail condo
- Monthly dues
- $1,150 · $13,800/yr
- Likely covers
- waterpool
- Assessments
- None detected in remarks — confirm with the listing agent.
Listing history 46 events
-
2026-06-18days on market $220,000 Active 224 DOM
-
2026-06-17days on market $220,000 Active 223 DOM
-
2026-06-16days on market $220,000 Active 222 DOM
-
2026-06-15days on market $220,000 Active 221 DOM
-
2026-06-13days on market $220,000 Active 219 DOM
-
2026-06-09days on market $220,000 Active 215 DOM
-
2026-06-08days on market $220,000 Active 214 DOM
-
2026-06-07days on market $220,000 Active 213 DOM
-
2026-06-04days on market $220,000 Active 210 DOM
-
2026-06-03days on market $220,000 Active 209 DOM
-
2026-06-01days on market $220,000 Active 207 DOM
-
2026-05-31days on market $220,000 Active 206 DOM
-
2026-04-23price $220,000
-
2026-02-03status Active
-
2026-01-10status Pending
-
2025-11-07price $249,000
-
2025-10-13$269,000 Active
-
2025-08-27historical $1,900
-
2025-05-30$1,900
-
2024-11-08historical
-
2024-11-03historical $1,900
-
2024-09-18price $1,900
-
2024-09-17status Active
-
2024-09-17price $289,000
-
2024-08-31historical
-
2024-05-13$2,500
-
2024-05-09price $299,000
-
2024-04-26price $309,000
-
2024-04-17price $319,000
-
2024-04-01historical $2,500
-
2024-03-05$2,500
-
2023-12-14price $367,000
-
2023-10-15status Active
-
2023-10-10price $387,000
-
2023-09-30historical
-
2023-07-11status Active
-
2023-06-30historical
-
2023-06-11price $399,000
-
2023-04-13price $409,000
-
2023-03-05price $419,000
-
2023-02-06$459,000 Active
-
2017-08-14historical
-
2017-05-30$212,000 Active
-
2013-03-19soldstatus $134,000
-
2013-02-22soldstatus $134,000
-
2012-09-17$139,900
ⓘ Source: listings_history table (triggers on properties + properties_extension) + one-shot
backfill from property_details.listing_events for pre-trigger history.
Tax reassessment forecast FL · Resets to sale price
- Current annual tax
- $4,624 · $385/mo
- Projected year-2 tax
- $4,624 · $385/mo
- Expected delta
- $0/yr ($0/mo · 0.0%)
ⓘ Screening estimate from a state-policy table — verify with the county assessor before closing.
Climate risk First Street
- Flood 10/10 Extreme FEMA zone AE · 99% chance over 30 yrs
- Wildfire 1/10 Low
- Heat 10/10 Extreme 7 d/yr ≥111°F today · 27 d/yr by 30 yrs out
- Wind 10/10 Extreme 99% chance of damaging wind over 30 yrs
- Air quality 3/10 Moderate 2 unhealthy d/yr today · 3 by 30 yrs out
Nearby sold comps map
Loading sold comps map…
Walkable amenities ~0.75 mi
Loading nearby amenities…
Taxation est. · year 1
- Rental income
- $39,718
- − Mortgage interest
- −$12,323
- − Property taxes
- −$4,624
- − Insurance
- −$6,218
- − Repairs & maintenance
- −$3,177
- − Management
- −$3,177
- − HOA
- −$13,800
- − Depreciation
- −$6,400
- Taxable loss
- −$10,003
- Est. tax savings @ 24.0%
- +$2,401
- After-tax cash flow
- $-4,709/yr
For passive investors: Depreciation is non-cash, so a rental often shows a tax loss while cash-flowing — sheltering income. Rental losses are passive: they offset passive income freely, and up to $25,000/yr can offset ordinary (W-2) income if you actively participate and your MAGI is under $100k (phasing out to $0 by $150k); unused losses carry forward. On sale, claimed depreciation is recaptured at up to 25%, and gains may owe capital-gains tax (a 1031 exchange can defer both). Figures are a year-1 estimate at your 24.0% rate — not tax advice; consult a CPA.
Schools (NCES district)
- District
- Pinellas
- NCES district ID
- 1201560
- Math proficiency
- 51% ▼ -5.00%
- Reading proficiency
- 51% ▼ -3.00%
- Median HH income
- $46,270
- Composite
- 43.27/100
- National rank
- #3046
- State rank
- #31 of 73 in FL
Livability — Clearwater
- Score
- 82/100
- State rank
- #60
- US rank
- #988
Category grades
Schools grade is shown separately in the Schools card above.
Census & demographics
- Census place
- Clearwater, FL
- County
- Pinellas County · 939,478 people
- City population
- 170,933
- Metro
- Tampa-St. Petersburg-Clearwater, FL
- Population (ZIP)
- 8,081
- Household income
- $117,425
- Rent vs Own
- Severe rent burden
- 295.0
Population outlook (Pinellas County) Hauer SSP2
- Today (2025)
- 1,027,532 people
- By 2030
- 1,063,586 · +3.5%
- By 2040
- 1,125,020 · +9.5%
- By 2050
- 1,168,637 · +13.7%
- By 2075
- 1,265,188 · +23.1%
- By 2100
- 1,260,357 · +22.7%
Race, ethnicity, and origin ACS 2023
- Neighborhood character
- Predominantly White (92%)
- Race & ethnicity
- White 92% Hispanic / Latino 4% Two or more races 4% Asian 2%
- Common ancestry
- Romanian 6% Italian 3% Slovak 2%
- Foreign-born
- 14% · Canada, China
- Languages at home
- 88% English-only · Other Indo-European 4% Spanish 2% Arabic 2%
Political lean MEDSL · Pinellas
- 2024 margin
- Lean R (+5.2) · D 46.9% · R 52.1%
- 2008→2024 swing
- -13.5pp toward R · 2008: 8.3pp · 2024: -5.2pp
- All cycles
- 2024: R+5.2 2020: D+0.2 2016: R+1.1 2012: D+5.6 2008: D+8.3
Not yet ingested
- Civics
- —
Market trends
- HPI YoY
- ▲ 1.88%
- Current HPI
- 297.7165
- Rent YoY
- ▲ 2.76%
- Metro
- Tampa-St. Petersburg-Clearwater, FL
- State GDP YoY
- ▲ 3.28%
- F500 in state
- 36
Industry mix (Fortune 500 HQ in FL)
| Industry | F500 HQs | Revenue |
|---|---|---|
| Industrial Technology | 2 | $29B |
|
||
| Insurance | 2 | $17B |
|
||
| Retail | 1 | $60B |
|
||
| Technology Distribution | 1 | $58B |
|
||
| Homebuilding | 1 | $35B |
|
||
| Technology Manufacturing | 1 | $35B |
|
||
Price history
+57.3% since first listed34 events — show timeline
- 2026-04-23 Price Changed $220,000 Stellar MLS as Distributed by MLS Grid
- 2026-02-03 Relisted — Stellar MLS as Distributed by MLS Grid
- 2026-01-10 Pending — Stellar MLS as Distributed by MLS Grid
- 2025-11-07 Price Changed $249,000 Stellar MLS as Distributed by MLS Grid
- 2025-10-13 Listed $269,000 Stellar MLS as Distributed by MLS Grid
- 2025-08-27 Rental Removed $1,900 STELLARMLS
- 2025-05-30 Listed for Rent $1,900 STELLARMLS
- 2024-11-08 Listing Removed — Stellar MLS as Distributed by MLS Grid
- 2024-11-03 Rental Removed $1,900 STELLARMLS
- 2024-09-18 Price Changed $1,900 STELLARMLS
- 2024-09-17 Relisted — Stellar MLS as Distributed by MLS Grid
- 2024-09-17 Price Changed $289,000 Stellar MLS as Distributed by MLS Grid
- 2024-08-31 Listing Removed — Stellar MLS as Distributed by MLS Grid
- 2024-05-13 Listed for Rent $2,500 STELLARMLS
- 2024-05-09 Price Changed $299,000 Stellar MLS as Distributed by MLS Grid
- 2024-04-26 Price Changed $309,000 Stellar MLS as Distributed by MLS Grid
- 2024-04-17 Price Changed $319,000 Stellar MLS as Distributed by MLS Grid
- 2024-04-01 Rental Removed $2,500 STELLARMLS
- 2024-03-05 Listed for Rent $2,500 STELLARMLS
- 2023-12-14 Price Changed $367,000 Stellar MLS as Distributed by MLS Grid
- 2023-10-15 Relisted — Stellar MLS as Distributed by MLS Grid
- 2023-10-10 Price Changed $387,000 Stellar MLS as Distributed by MLS Grid
- 2023-09-30 Listing Removed — Stellar MLS as Distributed by MLS Grid
- 2023-07-11 Relisted — Stellar MLS as Distributed by MLS Grid
- 2023-06-30 Listing Removed — Stellar MLS as Distributed by MLS Grid
- 2023-06-11 Price Changed $399,000 Stellar MLS as Distributed by MLS Grid
- 2023-04-13 Price Changed $409,000 Stellar MLS as Distributed by MLS Grid
- 2023-03-05 Price Changed $419,000 Stellar MLS as Distributed by MLS Grid
- 2023-02-06 Listed $459,000 Stellar MLS as Distributed by MLS Grid
- 2017-08-14 Listing Removed — Stellar MLS as Distributed by MLS Grid
- 2017-05-30 Listed $212,000 Stellar MLS as Distributed by MLS Grid
- 2013-03-19 Sold (Public Records) $134,000 Public Records
- 2013-02-22 Sold (MLS) $134,000 Stellar MLS as Distributed by MLS Grid
- 2012-09-17 Listed $139,900 Stellar MLS as Distributed by MLS Grid
Property tax history
+5.6%/yrLatest (2025): $4,624 · +4.0% YoY. Source: county tax records.
Cash-flow waterfall
monthlySold comps — $/sqft
last 12 mo · ≤1 miLoading sold comps…