 Multi-family
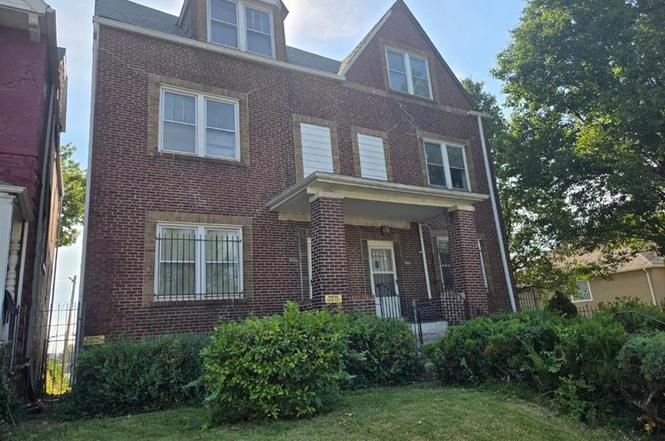
3916 W Belle Pl · St. Louis, MO
Flood risk 1/10 · Minimal
- FEMA flood zone
- X (unshaded)
- Chance of flooding over 30 yrs
- 0.0%
- Est. flood insurance / yr
- $473 – $860
Fire risk 1/10 · Minimal
- Est. fire insurance / yr
- $1,054 – $1,958
Heat risk 5/10 · Moderate
- Hot days now (above 108°F)
- 7 days/yr
- Hot days in 30 yrs
- 21 days/yr
Wind risk 2/10 · Minimal
- Chance of severe wind over 30 yrs
- 1.0%
Air-quality risk 3/10 · Minor
- Unhealthy air days now
- 3 days/yr
- Unhealthy air days in 30 yrs
- 4 days/yr
Risk factors via First Street. Map © Google.
Why this score? — see what drove the D grade
The composite is a weighted blend of 9 inputs, each scored 0–100. Each bar is that input's sub-score; the figure is the points it added to the 100-point composite (weight × sub-score).
- Cash flow +15.0/30.0
- ARV discount +7.1/15.0
- 1% rule +5.0/10.0
- DSCR +5.0/10.0
- Rent growth +3.3/5.0
- Livability +2.5/5.0
- Condition / age +2.5/5.0
- Schools +1.2/10.0
- Appreciation +0.0/10.0
$115,000
🖨 Deal sheet 📄 Offer letter ✓ Due diligence
Multi-family units
County records classify this as Multi-Family (2-4 Unit). Listing-text estimate: 1 unit. estimate disagrees with records
Listing remarks
HUGE PRICE REDUCTION!!!! Owner say, " SELL AS IS" , Inspection for Buyer's Information Only !!!!! Please do not forward Inspection report to Listing Agent . Price reduction reflects owner wanting a quick sale. Lots of Updates. Check out Plumbing, Electric, Roofing, Heating, Tuckpointing and Rear Porches. The area is experiencing revitalizations. COME SEE AND MAKE YOUR OFFER FOR THIS BARGAIN PRICED INVESTMENT. All Units Are Vacant. FYI: The Seller Reserves the right to accept the offer of their choice regardless of order in which they are received. Property under Multiple Offer Status, Please Submit Highest and Best Offer by 12pm of 3/19/2026 .
Key facts
- Main thoroughfares
- Centrally located
- 7,440 sq ft lot
Tags
Property features AI
Finance
- Other: No additional financial amenities provided
- Financial info: Income property with four rental units (investor opportunity); Above-grade living area reported as 5,700 (assessor)
- HOA & community: No HOA details provided
Exterior
- Parking: Off-street parking with parking pad; 2-car garage
- Security: No security features provided
- Utilities: Public water; Sewer available and connected
- Home design: Residential income property; Quadruplex; Single building (1); Four units total
- Construction: Brick construction; Flat, pitched/sloped, and shingle roof types
- Exterior features: Chain link fencing; Lot approximately 0.17 acres
Interior
- Kitchen: No appliance details provided
- Bedrooms: No main or upper level bedrooms reported
- Flooring: No flooring details provided
- Bathrooms: No main or upper level bathrooms reported; Each unit has one bathroom (4 units, 4 bathrooms total)
- Heating & cooling: Forced air heating; Natural gas heating; Other cooling
- Interior features: Concrete basement
- Laundry & utility: No laundry details provided
Neighborhood map
What this means for you Summary
Snapshot
- This is a ?-bed/4.0-bath multifamily listed at $115k.
Deal economics
- At list price, monthly cash flow is $4k ($43k/yr) — positive.
- The deal already cash-flows at list — no discount required.
- Meets the 1% rule at list price ($5k rent vs $115k).
- Recommended offer: $101k (12.0% below list) — sets the bar for market timing.
- Cap rate 44.0% vs local median 5.0% in St. Louis — top-decile yield for the area; either an underpriced asset or a hidden risk that comps aren't pricing in. Stress-test before assuming the spread holds.
Location & tenants
- Location reads: area grade D — affects rentability + tenant quality, not the cash-flow math above.
- St. Louis City (urban): math 10% / reading 18% proficiency, ranked #312 of 324 in MO (top 96%) — low school quality limits family demand, transient renter base, plan for 1-2y turnover; 80% free/reduced lunch — lower-income household profile, screen leases tightly.
- Zoned schools: Sumner High (math 2% / reading 2%, grade F, #520 of 521 statewide, top 100%, 264 students, 99% FRL) — zoned schools average 99% FRL vs 80% district-wide (18 pts higher); higher-poverty schools than district average — tighter screening recommended.
- Market conditions: Rents rising (+3.1%/yr); 152 active listings in the ZIP; 294 units permitted in St. Louis city in 2024 (227 in 5+ unit buildings).
- At $5,444/mo this rent would consume 118% of the median local household income ($55k/yr) (locally 2180% of renters already pay >50% of income on rent) — very limited rent-growth headroom before tenants either downsize or default.
Forward outlook
- Local home prices are declining (-3.0%/yr); year-one equity from $795 of loan paydown is wiped out by about $3k of value loss. Plan a longer hold.
- St. Louis County population projected to shrink 6% by 2050 — rents likely to lag national; underwrite the cash flow, not the appreciation.
- At projected returns (-3.0% appreciation + 3.1% rent growth), your $32k cash investment doubles in ~1 year — after that, you're playing with house money.
Negotiation context
- It's been on market 223 days — a 12% lower offer ($101k) is reasonable based on typical stale-listing flexibility.
- 3 sale attempts; this cycle's ask has dropped $190k (62%) from the opening price — seller is motivated, your offer sets the floor, not the list.
Risks & watch-outs
- Watch-outs: built in 1890 — expect roof / HVAC / electrical / plumbing capex.
- Climate carrying-cost: extreme-heat days projected 7→21/yr by 2055 (HVAC capex compounding) — expect insurance premiums to compound above CPI over the hold.
Questions for the listing agent
- It's been on market 223 days. Have you received any prior offers? Is the seller open to a 12% concession, seller financing, or rate buy-down credit?
- Built in 1890 — when were the roof, HVAC, electrical panel, plumbing, and water heater last replaced?
- Why hasn't it sold? Are there any deal-killer items the seller is aware of (foundation, flood, title, zoning, code violations)?
- Is there a deadline driving the sale (1031 exchange, divorce, estate, relocation)? That informs how much negotiation room exists.
- The area grade is low — what's the realistic commute time and amenity access for the typical tenant pool here? Any planned neighborhood developments (good or bad) we should know about?
- What's the average days-on-market for RENTAL listings here right now (not sales)? A rising rental-DOM trend means longer vacancies and softer asking-rent achievability than the comps imply.
- What's the recent tenant-quality profile in this submarket — average credit score on applications, eviction rate, late-payment / NSF rate, and stable-employment percentage? A property-management company in the area should have these aggregated.
- How much new apartment / multifamily construction is in the pipeline within 1–3 miles? Heavy new supply (>2% of stock underway) typically softens rents 12–24 months out; light construction supports rent growth.
Investment metrics
- 1% rule
- 4.73% ✓
- Cap rate
- 44.02%
- Cash-on-cash
- 134.73%
- DSCR
- 6.99
- GRM
- 1.8
CMA / ARV
- ARV (on-the-fly)
- $114,000
- Comps found
- 1
Show comp detail 1 sale within ~0.75 mi
| Address | Dist | Beds/Ba | Sqft | Sold | Price | $/sf | Match |
|---|---|---|---|---|---|---|---|
| 3916 W Belle Pl | 0.00mi | —/16.0 | 5,700 (0%) | 1mo | $115,000 | $20 | 79 |
Match score weights: distance 35% · size 25% · config 20% · recency 20%. Top-matched comps best support the ARV.
Projected returns pro-forma
-3.0% appreciation · 3.1% rent growth · sell at horizon
- IRR
- —
- Equity multiple
- 7.59×
- Total profit
- $212,187
- Equity at exit
- $17,147
- IRR
- —
- Equity multiple
- 16.02×
- Total profit
- $483,578
- Equity at exit
- $9,943
Cash invested: $32,200 (down + closing). Projections, not guarantees.
Landlord ↔ Tenant lean methodology
- Overall (STATE)
- 81 Strongly Landlord-Friendly
- State Missouri
- 81 Strongly Landlord-Friendly · R+10
- County
- — inherits STATE
- City
- — inherits STATE
ZIP-level market 63108
- Home prices YoY
- -33.1%
- Rents YoY
- 3.1%
- Active inventory
- 152
- Price-to-rent
- 3.5×
Monthly cashflow live
- Estimated rent
- $5,444 medium interval (Pro) →
- Mortgage (P&I)
- −$603
- Tax from tax record
- −$35 /mo · $414/yr
- Insurance
- −$48
- HOA
- −$0
- Vacancy / Maint / Mgmt
- −$1,143
- Net cashflow
- $3,615
Break-even live
2-unit breakdown (identical units grouped — click to expand)
| Units | Beds | Baths | Est. rent |
|---|---|---|---|
| 2× units | 3 | 1.5 | $5,444 |
| #1 | 3 | 1.5 | $2,722 |
| #2 | 3 | 1.5 | $2,722 |
| Total (2 units) | $5,444 | ||
UW: 25.0% down · 7.5% · 30yr · 1.5% tax · 5.0% vac · 8.0% maint · 8.0% mgmt
Financing live
Cash to close
- Down payment
- $28,750
- Closing costs
- $3,450
- Reserves months
- —
- Total cash needed
- —
Loan-product check · same deal, 3 products live
Conventional
25% down · 7.5% · 30yr
- Down + closing
- —
- Monthly P&I
- —
- Monthly cashflow
- —
- DSCR
- —
- Eligible?
- —
Personal DTI + credit; lowest rate.
DSCR
20% down · 8.5% · 30yr
- Down + closing
- —
- Monthly P&I
- —
- Monthly cashflow
- —
- DSCR
- —
- Eligible?
- —
No personal income docs; deal must DSCR.
Hard money
10% down · 12.0% · 12mo
- Down + closing
- —
- Monthly P&I
- —
- Monthly cashflow
- —
- DSCR
- —
- Eligible?
- —
Short-term bridge; refi at stabilization.
Listing history 10 events
-
2026-05-25status Pending
-
2026-03-19historical Active Under Contract
-
2026-03-16status Active
-
2026-03-12historical Active Under Contract
-
2026-03-02price $115,000
-
2026-01-09status Active
-
2026-01-09price $145,000
-
2025-10-28price $285,000
-
2025-10-10$305,000 Active
-
2016-07-26soldstatus
ⓘ Source: listings_history table (triggers on properties + properties_extension) + one-shot
backfill from property_details.listing_events for pre-trigger history.
Tax reassessment forecast MO · Resets to sale price
- Current annual tax
- $414 · $35/mo
- Projected year-2 tax
- $1,116 · $93/mo
- Expected delta
- +$701/yr (+$58/mo · 169.4%)
ⓘ Screening estimate from a state-policy table — verify with the county assessor before closing.
Climate risk First Street
- Flood 1/10 Low FEMA zone X (unshaded) · 0% chance over 30 yrs
- Wildfire 1/10 Low
- Heat 5/10 Major 7 d/yr ≥108°F today · 21 d/yr by 30 yrs out
- Wind 2/10 Low 100% chance of damaging wind over 30 yrs
- Air quality 3/10 Moderate 3 unhealthy d/yr today · 4 by 30 yrs out
Nearby sold comps map
Loading sold comps map…
Walkable amenities ~0.75 mi
Loading nearby amenities…
Taxation est. · year 1
- Rental income
- $65,328
- − Mortgage interest
- −$6,442
- − Property taxes
- −$414
- − Insurance
- −$575
- − Repairs & maintenance
- −$5,226
- − Management
- −$5,226
- − Depreciation
- −$3,345
- Taxable income
- $44,099
- Est. tax owed @ 24.0%
- −$10,584
- After-tax cash flow
- $32,799/yr
For passive investors: Depreciation is non-cash, so a rental often shows a tax loss while cash-flowing — sheltering income. Rental losses are passive: they offset passive income freely, and up to $25,000/yr can offset ordinary (W-2) income if you actively participate and your MAGI is under $100k (phasing out to $0 by $150k); unused losses carry forward. On sale, claimed depreciation is recaptured at up to 25%, and gains may owe capital-gains tax (a 1031 exchange can defer both). Figures are a year-1 estimate at your 24.0% rate — not tax advice; consult a CPA.
Schools (NCES district)
- District
- St. Louis City
- NCES district ID
- 2929280
- Math proficiency
- 10% ▼ -6.00%
- Reading proficiency
- 18% ▼ -3.00%
- Median HH income
- $35,685
- Composite
- 11.54/100
- National rank
- #9699
- State rank
- #312 of 324 in MO
Livability — St. Louis
No livability data for this city. (Only ~50 U.S. cities are tracked.)
Census & demographics
- Census place
- St. Louis, MO
- County
- Saint Louis City · 254,015 people
- City population
- 283,259
- Metro
- St. Louis, MO-IL
- Population (ZIP)
- 21,336
- Household income
- $55,147
- Rent vs Own
- Severe rent burden
- 2180.0
Population outlook (St. Louis County) Hauer SSP2
- Today (2025)
- 315,737 people
- By 2030
- 313,865 · -0.6%
- By 2040
- 305,439 · -3.3%
- By 2050
- 296,529 · -6.1%
- By 2075
- 271,028 · -14.2%
- By 2100
- 255,359 · -19.1%
Race, ethnicity, and origin ACS 2023
- Neighborhood character
- Diverse neighborhood (Simpson 0.62)
- Race & ethnicity
- White 54% Black 26% Asian 13% Hispanic / Latino 4% Two or more races 4%
- Common ancestry
- Lithuanian 4% Romanian 3% Iranian 2%
- Foreign-born
- 13% · China, Canada, South Korea
- Languages at home
- 85% English-only · Chinese 3% Other Asian/Pacific 3% Spanish 3%
Political lean MEDSL · St. Louis
- 2024 margin
- Solid D (+64.7) · D 81.4% · R 16.7% · Other 2.0%
- 2008→2024 swing
- -3.5pp toward R · 2008: 68.2pp · 2024: 64.7pp
- All cycles
- 2024: D+64.7 2020: D+66.2 2016: D+63.7 2012: D+66.6 2008: D+68.2
Not yet ingested
- Civics
- —
Market trends
- HPI YoY
- ▼ -111.22%
- Current HPI
- 225.1081
- Rent YoY
- ▲ 3.10%
- Metro
- St. Louis, MO-IL
- State GDP YoY
- ▲ 1.84%
- F500 in state
- 20
Industry mix (Fortune 500 HQ in MO)
| Industry | F500 HQs | Revenue |
|---|---|---|
| Healthcare | 1 | $163B |
|
||
| Insurance | 1 | $21B |
|
||
| Industrial Technology | 1 | $17B |
|
||
| Retail | 1 | $16B |
|
||
| Industrial Distribution | 1 | $10B |
|
||
| Utilities | 1 | $9B |
|
||
Price history
-62.3% since first listed10 events — show timeline
- 2026-05-25 Pending — MARIS as Distributed by MLS Grid
- 2026-03-19 Contingent — MARIS as Distributed by MLS Grid
- 2026-03-16 Relisted — MARIS as Distributed by MLS Grid
- 2026-03-12 Contingent — MARIS as Distributed by MLS Grid
- 2026-03-02 Price Changed $115,000 MARIS as Distributed by MLS Grid
- 2026-01-09 Relisted — MARIS as Distributed by MLS Grid
- 2026-01-09 Price Changed $145,000 MARIS as Distributed by MLS Grid
- 2025-10-28 Price Changed $285,000 MARIS as Distributed by MLS Grid
- 2025-10-10 Listed $305,000 MARIS as Distributed by MLS Grid
- 2016-07-26 Sold (Public Records) — Public Records
Property tax history
+2.4%/yrLatest (2022): $414 · +0.1% YoY. Source: county tax records.
Cash-flow waterfall
monthlySold comps — $/sqft
last 12 mo · ≤1 miLoading sold comps…