3708 E Avenue S E · Santa Fe, TX
Flood risk 1/10 · Minimal
- FEMA flood zone
- X (unshaded)
- Chance of flooding over 30 yrs
- 0.0%
- Est. flood insurance / yr
- $507 – $1,088
Fire risk 3/10 · Minor
- Est. fire insurance / yr
- $1,222 – $2,270
Heat risk 10/10 · Severe
- Hot days now (above 109°F)
- 7 days/yr
- Hot days in 30 yrs
- 26 days/yr
Wind risk 9/10 · Severe
- Chance of severe wind over 30 yrs
- 99.0%
Air-quality risk 2/10 · Minimal
- Unhealthy air days now
- 1 days/yr
- Unhealthy air days in 30 yrs
- 1 days/yr
Risk factors via First Street. Map © Google.
Why this score? — see what drove the B- grade
The composite is a weighted blend of 9 inputs, each scored 0–100. Each bar is that input's sub-score; the figure is the points it added to the 100-point composite (weight × sub-score).
- Cash flow +30.0/30.0
- 1% rule +10.0/10.0
- DSCR +10.0/10.0
- ARV discount +6.6/15.0
- Schools +3.5/10.0
- Livability +3.4/5.0
- Rent growth +2.5/5.0
- Condition / age +2.5/5.0
- Appreciation +0.0/10.0
$315,000
🖨 Deal sheet 📄 Offer letter ✓ Due diligence
Listing remarks MLS
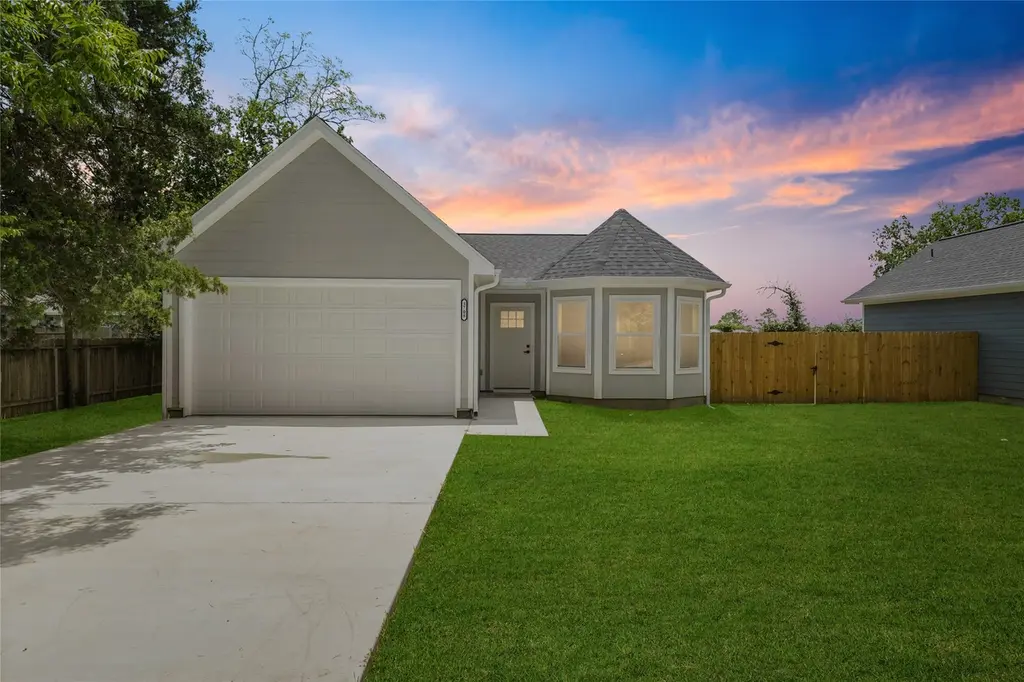
Located in the peaceful and growing community of Santa Fe, this charming one-story single-family home offers the perfect blend of space, privacy, and convenience. The property sits on an expansive lot featuring a huge front yard that creates great curb appeal and plenty of room for landscaping, extra parking, or outdoor enjoyment. Inside, the functional single-story layout offers comfortable living spaces filled with natural light, ideal for both everyday living and entertaining. One of the standout features is the enormous backyard, providing endless possibilities for a pool, outdoor kitchen, garden, workshop, or entertainment area. Conveniently located just 3 minutes from Texas State Highway 6 and approximately 10 minutes from Interstate 45, offering quick access to shopping, dining, and commuting routes while still enjoying the quiet charm of Santa Fe living.
Key facts
- Expansive lot
- Huge front yard
- Enormous backyard
Tags
Neighborhood map
What this means for you Summary
Snapshot
- This is a 3-bed/2.5-bath single-family listed at $315k.
Deal economics
- At list price, monthly cash flow is $8k ($90k/yr) — positive.
- The deal already cash-flows at list — no discount required.
- Meets the 1% rule at list price ($12k rent vs $315k).
- Recommended offer: $287k (9.0% below list) — sets the bar for market timing.
- Cap rate 34.9% vs local median 4.5% in Santa Fe — top-decile yield for the area; either an underpriced asset or a hidden risk that comps aren't pricing in. Stress-test before assuming the spread holds.
Location & tenants
- Location reads 67/100 on livability (#550 in TX) — a middle-class / working-renter tenant base. Strengths: crime A+, cost of living A+, housing A+; Watch: amenities F, commute F, health & safety F.
- Santa Fe ISD (suburban): math 38% / reading 39% proficiency, ranked #385 of 826 in TX (top 47%) — families likely to look elsewhere, expect single-tenant / working-renter base with shorter leases.
- Market conditions: 233 active listings in the ZIP; 2 comparable units currently listed for rent nearby; 3,258 units permitted in Galveston County in 2024 (0 in 5+ unit buildings).
Forward outlook
- Local home prices are declining (-3.0%/yr); year-one equity from $2k of loan paydown is wiped out by about $9k of value loss. Plan a longer hold.
- Galveston County population projected at +43% by 2050 — long-run rental-demand tailwind backs the buy-and-hold thesis.
- At projected returns (-3.0% appreciation + 3.0% rent growth), your $88k cash investment doubles in ~2 years — after that, you're playing with house money.
Negotiation context
- It's been on market 102 days — a 9% lower offer ($287k) is reasonable based on typical stale-listing flexibility.
- 6 sale attempts with the ask held roughly flat each time — persistent listings suggest the price (not the market) is what's stuck; bring a comps-based counter.
Risks & watch-outs
- Climate carrying-cost: severe wind risk, 99% chance of damaging wind over 30y; extreme-heat days projected 7→26/yr by 2055 (HVAC capex compounding) — expect insurance premiums to compound above CPI over the hold.
Questions for the listing agent
- It's been on market 102 days. Have you received any prior offers? Is the seller open to a 9% concession, seller financing, or rate buy-down credit?
- Why hasn't it sold? Are there any deal-killer items the seller is aware of (foundation, flood, title, zoning, code violations)?
- Is there a deadline driving the sale (1031 exchange, divorce, estate, relocation)? That informs how much negotiation room exists.
- What's the average days-on-market for RENTAL listings here right now (not sales)? A rising rental-DOM trend means longer vacancies and softer asking-rent achievability than the comps imply.
- What's the recent tenant-quality profile in this submarket — average credit score on applications, eviction rate, late-payment / NSF rate, and stable-employment percentage? A property-management company in the area should have these aggregated.
- How much new for-sale + rental construction is in the pipeline within 1–3 miles? Heavy new supply typically softens prices + rents 12–24 months out; constrained supply supports both.
Investment metrics
- 1% rule
- 3.86% ✓
- Cap rate
- 34.93%
- Cash-on-cash
- 102.27%
- DSCR
- 5.55
- GRM
- 2.2
CMA / ARV
- ARV (median comp)
- $309,040
- List price
- $315,000
- Delta
- 1.93%
- Verdict
- FAIR
- Comps
- 20 within 1.0 mi
Show comp detail 10 sales within ~0.75 mi
| Address | Dist | Beds/Ba | Sqft | Sold | Price | $/sf | Match |
|---|---|---|---|---|---|---|---|
| 3700 Avenue S St W | 0.01mi | 3/2.0 | 1,406 (-6%) | 5mo | $315,000 | $224 | 83 |
| 13306 Winston Dr | 0.20mi | 3/2.0 | 1,624 (+8%) | 3mo | $399,900 | $246 | 72 |
| 13331 Pecan Trails Dr | 0.08mi | 3/2.0 | 1,689 (+13%) | 3mo | $314,999 | $187 | 70 |
| 4132 Avenue Q 1/2 | 0.58mi | 3/2.0 | 1,500 (0%) | 1mo | $359,999 | $240 | 70 |
| 4002 Avenue Q 1/2 | 0.39mi | 3/2.0 | 1,528 (+2%) | 14mo | $319,000 | $209 | 65 |
| 13118 Preston Dr | 0.58mi | 3/2.0 | 1,426 (-5%) | 10mo | $275,000 | $193 | 55 |
| 13903 3rd St | 0.71mi | 3/2.0 | 1,585 (+6%) | 14mo | $359,000 | $226 | 44 |
| 13907 3rd St | 0.72mi | 3/2.0 | 1,585 (+6%) | 14mo | $355,000 | $224 | 43 |
| 13242 9th St | 0.69mi | 2/2.0 (-1) | 1,313 (-12%) | 5mo | $220,000 | $168 | 36 |
| 13241 8th St | 0.66mi | 4/1.5 (+1) | 1,318 (-12%) | 8mo | $110,000 | $83 | 33 |
Match score weights: distance 35% · size 25% · config 20% · recency 20%. Top-matched comps best support the ARV.
Projected returns pro-forma
-3.0% appreciation · 3.0% rent growth · sell at horizon
- IRR
- —
- Equity multiple
- 5.85×
- Total profit
- $427,864
- Equity at exit
- $46,968
- IRR
- —
- Equity multiple
- 12.22×
- Total profit
- $989,628
- Equity at exit
- $27,235
Cash invested: $88,200 (down + closing). Projections, not guarantees.
Landlord ↔ Tenant lean methodology
- Overall (STATE)
- 87 Strongly Landlord-Friendly
- State Texas
- 87 Strongly Landlord-Friendly · R+5
- County
- — inherits STATE
- City
- — inherits STATE
ZIP-level market 77510
- Home prices YoY
- -15.3%
- Active inventory
- 233
- Price-to-rent
- 2.2×
Monthly cashflow live
- Estimated rent
- $12,175 medium interval (Pro) →
- Mortgage (P&I)
- −$1,652
- Tax from tax record
- −$318 /mo · $3,813/yr
- Insurance
- −$131
- HOA
- −$0
- Vacancy / Maint / Mgmt
- −$2,557
- Net cashflow
- $7,517
Break-even live
UW: 25.0% down · 7.5% · 30yr · 1.5% tax · 5.0% vac · 8.0% maint · 8.0% mgmt
Financing live
Cash to close
- Down payment
- $78,750
- Closing costs
- $9,450
- Reserves months
- —
- Total cash needed
- —
Loan-product check · same deal, 3 products live
Conventional
25% down · 7.5% · 30yr
- Down + closing
- —
- Monthly P&I
- —
- Monthly cashflow
- —
- DSCR
- —
- Eligible?
- —
Personal DTI + credit; lowest rate.
DSCR
20% down · 8.5% · 30yr
- Down + closing
- —
- Monthly P&I
- —
- Monthly cashflow
- —
- DSCR
- —
- Eligible?
- —
No personal income docs; deal must DSCR.
Hard money
10% down · 12.0% · 12mo
- Down + closing
- —
- Monthly P&I
- —
- Monthly cashflow
- —
- DSCR
- —
- Eligible?
- —
Short-term bridge; refi at stabilization.
Rent comps 2 comps
| Address | Beds | Baths | Sqft | Rent | $/sqft | DOM | Units | Dist |
|---|---|---|---|---|---|---|---|---|
| 13342 Pecan Trails Dr Santa Fe, TX | 4.0 | 3.0 | 2150 | $2,700 | $1.26 | 43d | 1 | 0.10mi |
| 4120 Avenue O #10 Santa Fe, TX | 3.0 | 2.0 | 1280 | $74,621 | $58.30 | 43d | 1 | 0.81mi |
Listing history 29 events
-
2026-06-18days on market $315,000 Active 102 DOM
-
2026-06-17days on market $315,000 Active 101 DOM
-
2026-06-16days on market $315,000 Active 100 DOM
-
2026-06-15days on market $315,000 Active 99 DOM
-
2026-06-13days on market $315,000 Active 97 DOM
-
2026-06-09days on market $315,000 Active 93 DOM
-
2026-06-08days on market $315,000 Active 92 DOM
-
2026-06-07days on market $315,000 Active 91 DOM
-
2026-06-04days on market $315,000 Active 88 DOM
-
2026-06-03days on market $315,000 Active 87 DOM
-
2026-06-02days on market $315,000 Active 86 DOM
-
2026-06-01days on market $315,000 Active 85 DOM
-
2026-05-31days on market $315,000 Active 84 DOM
-
2026-03-09$315,000 Active 874-char remark
Show marketing remark (874 chars)
Located in the peaceful and growing community of Santa Fe, this charming one-story single-family home offers the perfect blend of space, privacy, and convenience. The property sits on an expansive lot featuring a huge front yard that creates great curb appeal and plenty of room for landscaping, extra parking, or outdoor enjoyment. Inside, the functional single-story layout offers comfortable living spaces filled with natural light, ideal for both everyday living and entertaining. One of the standout features is the enormous backyard, providing endless possibilities for a pool, outdoor kitchen, garden, workshop, or entertainment area. Conveniently located just 3 minutes from Texas State Highway 6 and approximately 10 minutes from Interstate 45, offering quick access to shopping, dining, and commuting routes while still enjoying the quiet charm of Santa Fe living.
-
2026-02-04historical
-
2025-10-30historical $2,100
-
2025-10-09$2,100
-
2025-10-04$315,000 Active
-
2025-09-25historical $1,900
-
2025-09-23historical
-
2025-08-21$1,900
-
2025-08-14price $314,900
-
2025-07-02price $319,900
-
2025-05-25$329,900 Active
-
2025-05-24historical
-
2025-05-20price $329,900
-
2025-05-02$326,000 Active
-
2023-09-26soldstatus
-
2023-09-08soldstatus
ⓘ Source: listings_history table (triggers on properties + properties_extension) + one-shot
backfill from property_details.listing_events for pre-trigger history.
Tax reassessment forecast TX · Resets to sale price
- Current annual tax
- $3,813 · $318/mo
- Projected year-2 tax
- $5,764 · $480/mo
- Expected delta
- +$1,952/yr (+$163/mo · 51.2%)
ⓘ Screening estimate from a state-policy table — verify with the county assessor before closing.
Climate risk First Street
- Flood 1/10 Low FEMA zone X (unshaded) · 0% chance over 30 yrs
- Wildfire 3/10 Moderate
- Heat 10/10 Extreme 7 d/yr ≥109°F today · 26 d/yr by 30 yrs out
- Wind 9/10 Extreme 99% chance of damaging wind over 30 yrs
- Air quality 2/10 Low 1 unhealthy d/yr today · 1 by 30 yrs out
Nearby sold comps map
Loading sold comps map…
Walkable amenities ~0.75 mi
Loading nearby amenities…
Taxation est. · year 1
- Rental income
- $146,097
- − Mortgage interest
- −$17,645
- − Property taxes
- −$3,813
- − Insurance
- −$1,575
- − Repairs & maintenance
- −$11,688
- − Management
- −$11,688
- − Depreciation
- −$9,164
- Taxable income
- $90,525
- Est. tax owed @ 24.0%
- −$21,726
- After-tax cash flow
- $68,480/yr
For passive investors: Depreciation is non-cash, so a rental often shows a tax loss while cash-flowing — sheltering income. Rental losses are passive: they offset passive income freely, and up to $25,000/yr can offset ordinary (W-2) income if you actively participate and your MAGI is under $100k (phasing out to $0 by $150k); unused losses carry forward. On sale, claimed depreciation is recaptured at up to 25%, and gains may owe capital-gains tax (a 1031 exchange can defer both). Figures are a year-1 estimate at your 24.0% rate — not tax advice; consult a CPA.
Schools (NCES district)
- District
- Santa Fe ISD
- NCES district ID
- 4839270
- Math proficiency
- 38% ▼ -10.00%
- Reading proficiency
- 39% ▼ -2.00%
- Median HH income
- $66,769
- Composite
- 34.86/100
- National rank
- #5091
- State rank
- #385 of 826 in TX
Livability — Santa Fe
- Score
- 67/100
- State rank
- #550
- US rank
- #10637
Category grades
Schools grade is shown separately in the Schools card above.
Census & demographics
- Census place
- Santa Fe, TX
- Population (ZIP)
- 13,938
Population outlook (Galveston County) Hauer SSP2
- Today (2025)
- 390,640 people
- By 2030
- 425,226 · +8.9%
- By 2040
- 493,765 · +26.4%
- By 2050
- 559,698 · +43.3%
- By 2075
- 719,260 · +84.1%
- By 2100
- 819,628 · +109.8%
Race, ethnicity, and origin ACS 2023
- Neighborhood character
- Predominantly White (72%)
- Race & ethnicity
- White 72% Hispanic / Latino 21% Two or more races 17% Asian 2%
- Hispanic origin (detail)
- Mexican 14% Puerto Rican 3% Cuban 1%
- Common ancestry
- Lithuanian 4% Italian 3% Slovak 1%
- Foreign-born
- 5% · Canada
- Languages at home
- 89% English-only · Spanish 10% Tagalog/Filipino 1%
Political lean MEDSL · Galveston
- 2024 margin
- Strong R (+27.4) · D 35.7% · R 63.1% · Other 1.2%
- 2008→2024 swing
- -7.9pp toward R · 2008: -19.5pp · 2024: -27.4pp
- All cycles
- 2024: R+27.4 2020: R+22.6 2016: R+22.6 2012: R+26.9 2008: R+19.5
Not yet ingested
- Civics
- —
Market trends
- HPI YoY
- ▼ -54.15%
- Current HPI
- 299.2228
- Rent YoY
- —
- Metro
- —
- State GDP YoY
- ▲ 3.95%
- F500 in state
- 110
Industry mix (Fortune 500 HQ in TX)
| Industry | F500 HQs | Revenue |
|---|---|---|
| Energy | 16 | $1,198B |
|
||
| Technology | 5 | $198B |
|
||
| Engineering / Construction | 4 | $72B |
|
||
| Energy Services | 3 | $60B |
|
||
| Utilities | 3 | $41B |
|
||
| Healthcare | 2 | $330B |
|
||
Price history
-3.4% since first listed16 events — show timeline
- 2026-03-09 Listed $315,000 HARMLS
- 2026-02-04 Listing Removed — HARMLS
- 2025-10-30 Rental Removed $2,100 HARMLS
- 2025-10-09 Listed for Rent $2,100 HARMLS
- 2025-10-04 Listed $315,000 HARMLS
- 2025-09-25 Rental Removed $1,900 HARMLS
- 2025-09-23 Listing Removed — HARMLS
- 2025-08-21 Listed for Rent $1,900 HARMLS
- 2025-08-14 Price Changed $314,900 HARMLS
- 2025-07-02 Price Changed $319,900 HARMLS
- 2025-05-25 Listed $329,900 HARMLS
- 2025-05-24 Listing Removed — HARMLS
- 2025-05-20 Price Changed $329,900 HARMLS
- 2025-05-02 Listed $326,000 HARMLS
- 2023-09-26 Sold (Public Records) — Public Records
- 2023-09-08 Sold (Public Records) — Public Records
Property tax history
+34.5%/yrLatest (2025): $3,813 · +259.8% YoY. Source: county tax records.
Cash-flow waterfall
monthlySold comps — $/sqft
last 12 mo · ≤1 miLoading sold comps…