 🌊 Lakefront
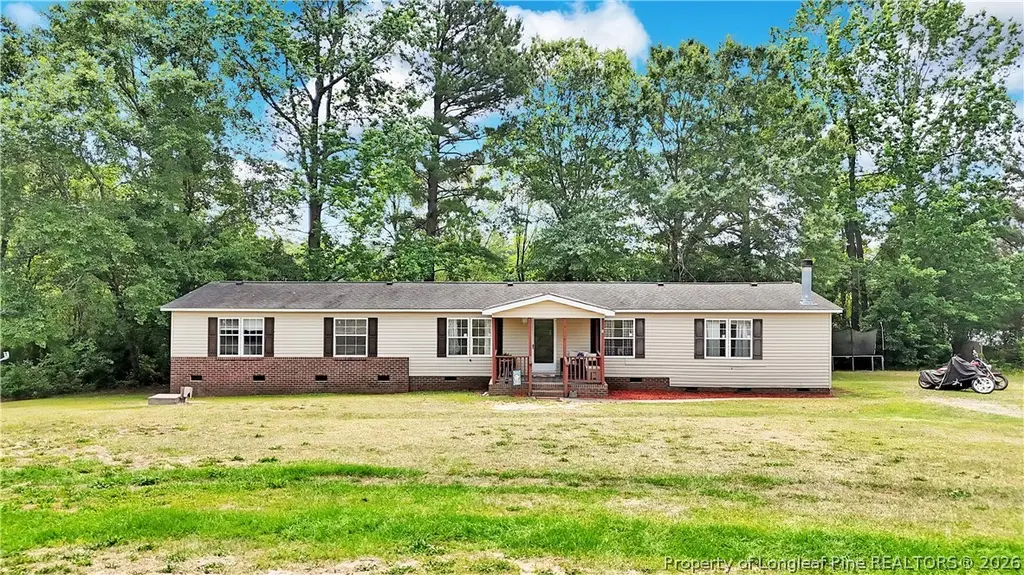
246 Farmhouse Ct · Barbecue, NC
Flood risk 1/10 · Minimal
- FEMA flood zone
- X (unshaded)
- Chance of flooding over 30 yrs
- 0.0%
- Est. flood insurance / yr
- $507 – $1,088
Fire risk 6/10 · Moderate
- Est. fire insurance / yr
- $906 – $1,684
Heat risk 7/10 · Major
- Hot days now (above 105°F)
- 7 days/yr
- Hot days in 30 yrs
- 17 days/yr
Wind risk 6/10 · Moderate
- Chance of severe wind over 30 yrs
- 63.0%
Air-quality risk 1/10 · Minimal
- Unhealthy air days now
- 0 days/yr
- Unhealthy air days in 30 yrs
- 0 days/yr
Risk factors via First Street. Map © Google.
Why this score? — see what drove the D+ grade
The composite is a weighted blend of 9 inputs, each scored 0–100. Each bar is that input's sub-score; the figure is the points it added to the 100-point composite (weight × sub-score).
- ARV discount +15.0/15.0
- Cash flow +14.4/30.0
- DSCR +4.4/10.0
- Rent growth +3.7/5.0
- Schools +3.0/10.0
- 1% rule +2.9/10.0
- Livability +2.5/5.0
- Condition / age +2.5/5.0
- Appreciation +0.0/10.0
$250,000
🖨 Deal sheet (PDF) 📄 Offer letter ✓ Due diligence
Listing remarks MLS
GREAT LOCATION- GREAT HOME, LOCATED CLOSE TO FORT BRAGG AND SANFORD. HOME IS LOCATED IN HARNETT COUNTY. SITTING ON A BEAUTIFUL LAKE, YOU CAN VACATION AT HOME. COMMUNITY ACCESS TO POOL AND PARK LOCATED IN THE COMMUNITY. HOME FEATURES A OPEN FLOOR PLAN WITH LARGE GREAT ROOM, FORMAL DINING ROOM, SITTING AREA, AND LIVING ROOM, EAT-IN KITCHEN AND WONDERFUL MASTER SUITE. HOME HAS APPROXIMATE 2052 SQUARE FEET. GLAMOUR BATH IN MASTER BEDROOM INCLUDES LARGE SOAKING TUB, SHOWER, AND WALK IN CLOSET. MASTER-SUITE INCLUDES A SITTING AREA. LARGE PRIVATE LOT LOCATED IN CUL-DE-SAC. NICE COVERED SITTING PORCH ON THE FRONT OF HOME. BACK OF HOME HAS DOUBLE DOORS LEADING OUT TO THE LAKE. TAKE ADVANTAGE OF OWNING THIS WONDERFUL PROPERTY. CALL TO SCHEDULE YOUR PRIVATE SHOWING TODAY.
Key facts
- Quiet cul-de-sac
- Waterfront scenery
- Large pond lot
Tags
Property features AI
Finance
- Other: Lot is wooded, cleared and sloping; located on a cul-de-sac; paved road access; zoning RA-20 (Residential Agricultural)
- HOA & community: Homeowners association with an annual fee of $315 (about $26.25/month); Subdivision: FIVE PONDS
Exterior
- Utilities: Public water; No sewer available
- Home design: Manufactured home; Residential property; On waterfront with pond view; Has view
- Construction: Vinyl siding
- Exterior features: Dock; Covered front porch; Porch; Patio
Interior
- Kitchen: Refrigerator; Dishwasher; Electric oven
- Flooring: Carpet; Vinyl
- Bathrooms: 2 full bathrooms
- Heating & cooling: Fireplace heating; Central air conditioning; Ceiling fan(s)
- Interior features: Ceiling fans; Double vanity; Eat-in kitchen; Kitchen island; Laminate countertops; Wood-burning fireplace
- Laundry & utility: Electric water heater
Neighborhood map
What this means for you Summary
Snapshot
- This is a 3-bed/2.0-bath manufactured listed at $250k.
Deal economics
- At list price, monthly cash flow is $52 ($619/yr) — positive.
- The deal already cash-flows at list — no discount required.
- To meet the 1% rule (rent ≥ 1% of price), the offer needs to be $199k (20.6% below list).
- Recommended offer: $199k (20.6% below list) — sets the bar for 1% rule.
- Cap rate 6.5% vs local median 4.8% in Barbecue — top-decile yield for the area; either an underpriced asset or a hidden risk that comps aren't pricing in. Stress-test before assuming the spread holds.
Location & tenants
- Location reads: area grade D — affects rentability + tenant quality, not the cash-flow math above.
- Harnett County Schools (rural): math 31% / reading 39% proficiency, ranked #130 of 178 in NC (top 73%) — families likely to look elsewhere, expect single-tenant / working-renter base with shorter leases.
- Zoned schools: Highland Elementary (math 37% / reading 42%, grade F, #694 of 1,410 statewide, top 53%, 891 students, 53% FRL); Western Harnett Middle (math 34% / reading 43%, grade F, #244 of 475 statewide, top 53%, 820 students, 57% FRL); Western Harnett High (math 57% / reading 58%, grade C, #245 of 535 statewide, top 46%, 1,386 students, 60% FRL).
- Market conditions: Rents rising fast (+4.9%/yr); 462 active listings in the ZIP; 1 comparable units currently listed for rent nearby; solid renter incomes; 2,080 units permitted in Harnett County in 2024 (12 in 5+ unit buildings).
- This rent runs 30% of the median local income ($78k/yr) — at the standard rent-burdened threshold; future hikes will face affordability resistance.
Forward outlook
- Local home prices are declining (-3.0%/yr); year-one equity from $2k of loan paydown is wiped out by about $8k of value loss. Plan a longer hold.
- Harnett County population projected at +42% by 2050 — long-run rental-demand tailwind backs the buy-and-hold thesis.
Negotiation context
- It's been on market 19 days — a 2% lower offer ($246k) is reasonable based on typical stale-listing flexibility.
- 4 sale attempts since 21y ago with the ask held roughly flat each time — persistent listings suggest the price (not the market) is what's stuck; bring a comps-based counter.
- Current owner paid $124k; list at $250k implies a 102% gain — meaningful room to come down on a strong offer.
Risks & watch-outs
- Climate carrying-cost: major wind risk, 63% chance of damaging wind over 30y; major wildfire risk; extreme-heat days projected 7→17/yr by 2055 (HVAC capex compounding) — expect insurance premiums to compound above CPI over the hold.
Questions for the listing agent
- What does the HOA fee cover, when was the last increase, and are there any pending special assessments or reserve-fund shortfalls?
- Is there a deadline driving the sale (1031 exchange, divorce, estate, relocation)? That informs how much negotiation room exists.
- The area grade is low — what's the realistic commute time and amenity access for the typical tenant pool here? Any planned neighborhood developments (good or bad) we should know about?
- This sits on a lake — are riparian / water-frontage rights deeded with the parcel? Any dock permits, shoreline easements, or HOA water-use restrictions?
- What's the documented flood / surge / shoreline-erosion history here (FEMA AND non-FEMA — e.g., storm surge, creek backup, septic-field saturation)?
- Any water-quality or seasonal algae-bloom issues that affect tenant satisfaction or short-term-rental demand?
- What's the average days-on-market for RENTAL listings here right now (not sales)? A rising rental-DOM trend means longer vacancies and softer asking-rent achievability than the comps imply.
- What's the recent tenant-quality profile in this submarket — average credit score on applications, eviction rate, late-payment / NSF rate, and stable-employment percentage? A property-management company in the area should have these aggregated.
- How much new for-sale + rental construction is in the pipeline within 1–3 miles? Heavy new supply typically softens prices + rents 12–24 months out; constrained supply supports both.
Investment metrics
- 1% rule
- 0.79% ✗
- Cap rate
- 6.54%
- Cash-on-cash
- 0.88%
- DSCR
- 1.04
- GRM
- 10.5
CMA / ARV
- ARV (on-the-fly)
- $340,735
- Comps found
- 6
Show comp detail 6 sales within ~0.75 mi
| Address | Dist | Beds/Ba | Sqft | Sold | Price | $/sf | Match |
|---|---|---|---|---|---|---|---|
| 60 Jessica Ct | 0.21mi | 3/2.0 | 2,052 (0%) | 1mo | $180,000 | $88 | 90 |
| 118 Cherry Berry Ln | 0.29mi | 3/2.0 | 2,108 (+3%) | 0mo | $259,000 | $123 | 82 |
| 101 Farmhouse Ct | 0.14mi | 3/2.0 | 2,070 (+1%) | 14mo | $244,900 | $118 | 80 |
| 40 Five Ponds Dr | 0.12mi | 3/2.0 | 2,096 (+2%) | 19mo | $235,000 | $112 | 75 |
| 211 Farmhouse Ct | 0.06mi | 4/2.0 (+1) | 2,049 (-0%) | 23mo | $260,000 | $127 | 73 |
| 2 Christopher Dr | 0.37mi | 3/2.0 | 1,801 (-12%) | 6mo | $244,900 | $136 | 58 |
Match score weights: distance 35% · size 25% · config 20% · recency 20%. Top-matched comps best support the ARV.
Projected returns pro-forma
-3.0% appreciation · 4.87% rent growth · sell at horizon
- IRR
- -13.1%
- Equity multiple
- 0.52×
- Total profit
- $-33,522
- Equity at exit
- $37,276
- IRR
- -1.8%
- Equity multiple
- 0.87×
- Total profit
- $-9,147
- Equity at exit
- $21,615
Cash invested: $70,000 (down + closing). Projections, not guarantees.
Landlord ↔ Tenant lean methodology
- Overall (STATE)
- 85 Strongly Landlord-Friendly
- State North Carolina
- 85 Strongly Landlord-Friendly · R+3
- County
- — inherits STATE
- City
- — inherits STATE
ZIP-level market 27332
- Home prices YoY
- -17.8%
- Rents YoY
- 4.9%
- Active inventory
- 462
- Price-to-rent
- 10.5×
Monthly cashflow live
- Estimated rent
- $1,985 medium interval (Pro) →
- Mortgage (P&I)
- −$1,311
- Tax from tax record
- −$75 /mo · $906/yr
- Insurance
- −$104
- HOA
- −$26
- Vacancy / Maint / Mgmt
- −$417
- Net cashflow
- $52
Break-even live
Sensitivity live
| Price | -10% $193 | -5% $122 | +0% $52 | +5% $-19 | +10% $-90 |
|---|---|---|---|---|---|
| Rent | -10% $-105 | -5% $-27 | +0% $52 | +5% $130 | +10% $208 |
| Rate | -1.0pp $177 | -0.5pp $115 | base $52 | +0.5pp $-13 | +1.0pp $-79 |
UW: 25.0% down · 7.5% · 30yr · 1.5% tax · 5.0% vac · 8.0% maint · 8.0% mgmt
Financing live
Cash to close
- Down payment
- $62,500
- Closing costs
- $7,500
- Reserves months
- —
- Total cash needed
- —
Loan-product check · same deal, 3 products live
Conventional
25% down · 7.5% · 30yr
- Down + closing
- —
- Monthly P&I
- —
- Monthly cashflow
- —
- DSCR
- —
- Eligible?
- —
Personal DTI + credit; lowest rate.
DSCR
20% down · 8.5% · 30yr
- Down + closing
- —
- Monthly P&I
- —
- Monthly cashflow
- —
- DSCR
- —
- Eligible?
- —
No personal income docs; deal must DSCR.
Hard money
10% down · 12.0% · 12mo
- Down + closing
- —
- Monthly P&I
- —
- Monthly cashflow
- —
- DSCR
- —
- Eligible?
- —
Short-term bridge; refi at stabilization.
Rent comps 1 comps
| Address | Beds | Baths | Sqft | Rent | $/sqft | DOM | Units | Dist |
|---|---|---|---|---|---|---|---|---|
| 52 Forest Mountain Ct Sanford, NC | 3.0 | 2.5 | 2537 | $2,350 | $0.93 | 25d | 1 | 0.95mi |
HOA detail
- Monthly dues
- $26 · $312/yr
- Likely covers
- pool
Listing history 15 events
-
2026-06-21days on market $250,000 Active 19 DOM
-
2026-06-18days on market $250,000 Active 16 DOM
-
2026-06-17days on market $250,000 Active 15 DOM
-
2026-06-16days on market $250,000 Active 14 DOM
-
2026-06-15days on market $250,000 Active 13 DOM
-
2026-06-14days on market $250,000 Active 11 DOM
-
2026-06-10days on market $250,000 Active 8 DOM
-
2026-06-09days on market $250,000 Active 7 DOM
-
2026-06-08days on market $250,000 Active 6 DOM
-
2026-06-07days on market $250,000 Active 5 DOM
-
2026-06-05days on market $250,000 Active 2 DOM
-
2026-06-03remarks 428-char remark
-
2026-06-03$250,000 Active 1 DOM
-
2026-06-02remarks 427-char remark
-
2026-06-02$250,000 Active 1 DOM
ⓘ Source: listings_history table (triggers on properties + properties_extension) + one-shot
backfill from property_details.listing_events for pre-trigger history.
Tax reassessment forecast NC · Resets to sale price
- Current annual tax
- $906 · $75/mo
- Projected year-2 tax
- $2,050 · $171/mo
- Expected delta
- +$1,144/yr (+$95/mo · 126.3%)
ⓘ Screening estimate from a state-policy table — verify with the county assessor before closing.
Climate risk First Street
- Flood 1/10 Low FEMA zone X (unshaded) · 0% chance over 30 yrs
- Wildfire 6/10 Major
- Heat 7/10 Severe 7 d/yr ≥105°F today · 17 d/yr by 30 yrs out
- Wind 6/10 Major 63% chance of damaging wind over 30 yrs
- Air quality 1/10 Low 0 unhealthy d/yr today · 0 by 30 yrs out
Nearby sold comps map
Loading sold comps map…
Walkable amenities ~0.75 mi
Loading nearby amenities…
Taxation est. · year 1
- Rental income
- $23,821
- − Mortgage interest
- −$14,004
- − Property taxes
- −$906
- − Insurance
- −$1,250
- − Repairs & maintenance
- −$1,906
- − Management
- −$1,906
- − HOA
- −$312
- − Depreciation
- −$7,273
- Taxable loss
- −$3,734
- Est. tax savings @ 24.0%
- +$896
- After-tax cash flow
- $1,515/yr
For passive investors: Depreciation is non-cash, so a rental often shows a tax loss while cash-flowing — sheltering income. Rental losses are passive: they offset passive income freely, and up to $25,000/yr can offset ordinary (W-2) income if you actively participate and your MAGI is under $100k (phasing out to $0 by $150k); unused losses carry forward. On sale, claimed depreciation is recaptured at up to 25%, and gains may owe capital-gains tax (a 1031 exchange can defer both). Figures are a year-1 estimate at your 24.0% rate — not tax advice; consult a CPA.
Schools (NCES district)
- District
- Harnett County Schools
- NCES district ID
- 3702010
- Math proficiency
- 31% ▼ -2.00%
- Reading proficiency
- 39% ▼ -1.00%
- Median HH income
- $45,400
- Composite
- 29.88/100
- National rank
- #6397
- State rank
- #130 of 178 in NC
Livability — Barbecue
No livability data for this city. (Only ~50 U.S. cities are tracked.)
Census & demographics
- Census place
- Barbecue, NC
- County
- Lee County · 76,725 people
- Metro
- Sanford, NC
- Population (ZIP)
- 36,947
- Household income
- $78,447
- Rent vs Own
- Severe rent burden
- 632.0
Population outlook (Harnett County) Hauer SSP2
- Today (2025)
- 153,758 people
- By 2030
- 166,581 · +8.3%
- By 2040
- 192,741 · +25.4%
- By 2050
- 218,332 · +42.0%
- By 2075
- 275,422 · +79.1%
- By 2100
- 313,511 · +103.9%
Race, ethnicity, and origin ACS 2023
- Neighborhood character
- Diverse neighborhood (Simpson 0.59)
- Race & ethnicity
- White 59% Hispanic / Latino 19% Black 16% Two or more races 11% Asian 1%
- Hispanic origin (detail)
- Mexican 9% Puerto Rican 4% Cuban 2%
- Common ancestry
- Serbian 2% Italian 2% Slovak 2%
- Foreign-born
- 8% · Canada, South Korea
- Languages at home
- 82% English-only · Spanish 15%
Political lean MEDSL · Harnett
- 2024 margin
- Strong R (+25.1) · D 36.9% · R 62.0% · Other 1.1%
- 2008→2024 swing
- -8.4pp toward R · 2008: -16.7pp · 2024: -25.1pp
- All cycles
- 2024: R+25.1 2020: R+22.4 2016: R+24.1 2012: R+19.4 2008: R+16.7
Not yet ingested
- Civics
- —
Market trends
- HPI YoY
- ▼ -54.61%
- Current HPI
- 252.2719
- Rent YoY
- ▲ 4.87%
- Metro
- Sanford, NC
- State GDP YoY
- ▲ 3.28%
- F500 in state
- 26
Industry mix (Fortune 500 HQ in NC)
| Industry | F500 HQs | Revenue |
|---|---|---|
| Financial Services | 2 | $213B |
|
||
| Retail | 2 | $95B |
|
||
| Industrial Conglomerate | 1 | $38B |
|
||
| Metals / Steel | 1 | $35B |
|
||
| Utilities | 1 | $30B |
|
||
| Industrial Machinery | 1 | $19B |
|
||
Price history
+284.6% since first listed8 events — show timeline
- 2026-05-27 Listed $250,000 LPRMLS
- 2020-04-21 Sold (Public Records) $124,000 Public Records
- 2020-04-21 Sold (MLS) $124,000 LPRMLS
- 2019-10-29 Listed $124,000 LPRMLS
- 2005-12-15 Sold (MLS) $58,510 AMLSNC
- 2005-12-15 Sold (MLS) $58,510 TMLS
- 2005-01-28 Listed $65,000 AMLSNC
- 2005-01-28 Listed $65,000 TMLS
Property tax history
-0.5%/yrLatest (2025): $906 · +0.0% YoY. Source: county tax records.
Cash-flow waterfall
monthlySold comps — $/sqft
last 12 mo · ≤1 miLoading sold comps…