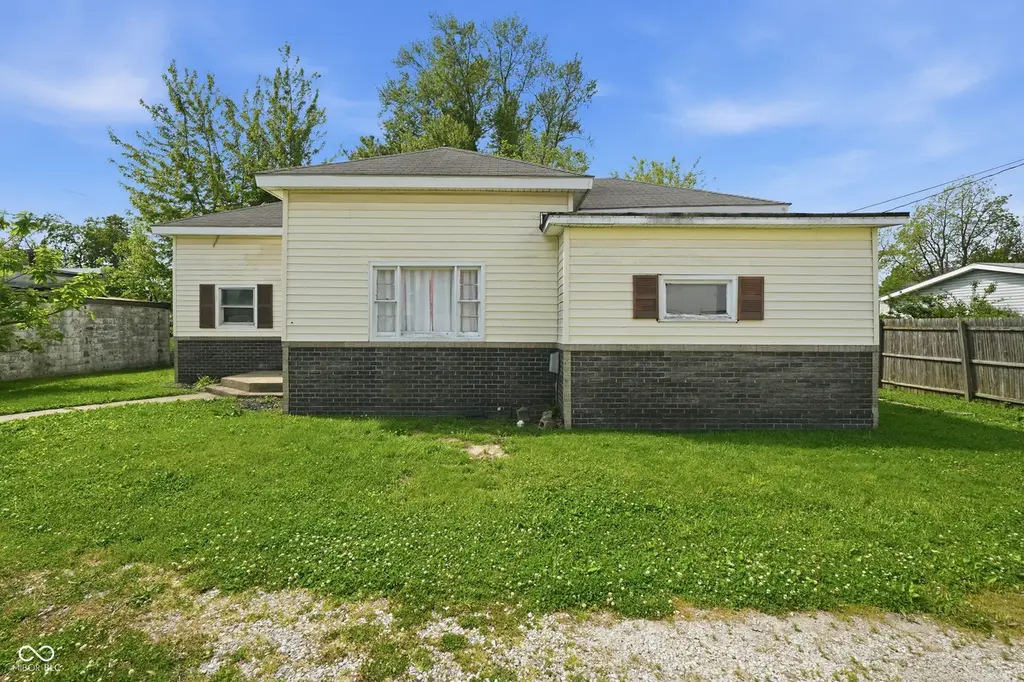
105 W 36th St · Marion, IN
Flood risk 1/10 · Minimal
- FEMA flood zone
- X (unshaded)
- Chance of flooding over 30 yrs
- 0.0%
- Est. flood insurance / yr
- $507 – $1,088
Fire risk 1/10 · Minimal
- Est. fire insurance / yr
- $717 – $1,331
Heat risk 3/10 · Minor
- Hot days now (above 100°F)
- 7 days/yr
- Hot days in 30 yrs
- 18 days/yr
Wind risk 2/10 · Minimal
- Chance of severe wind over 30 yrs
- —
Air-quality risk 2/10 · Minimal
- Unhealthy air days now
- 1 days/yr
- Unhealthy air days in 30 yrs
- 2 days/yr
Risk factors via First Street. Map © Google.
Why this score? — see what drove the B- grade
The composite is a weighted blend of 9 inputs, each scored 0–100. Each bar is that input's sub-score; the figure is the points it added to the 100-point composite (weight × sub-score).
- Cash flow +26.4/30.0
- ARV discount +15.0/15.0
- DSCR +9.0/10.0
- 1% rule +6.4/10.0
- Livability +3.2/5.0
- Rent growth +2.5/5.0
- Condition / age +2.5/5.0
- Schools +1.7/10.0
- Appreciation +0.0/10.0
$80,000
🖨 Deal sheet 📄 Offer letter ✓ Due diligence
Listing remarks MLS
Cozy 3 bedroom close to IWU. Master bedroom has 3 closets! Small lot, easy to maintain! Immediate possession on this one!
Key facts
- 3,445 sq ft lot
- Built 1900
- Listed 22 days
Property features AI
Finance
- Other: Property type: Residential; Lot approximately 0.08 acre; GPS-friendly directions available
Exterior
- Security: Smoke detector(s)
- Utilities: Public water; Municipal sewer connected; No solid waste service listed
- Home design: Single-family residence; One level
- Construction: Brick construction; Crawl space foundation
- Exterior features: Storage shed
Interior
- Kitchen: Refrigerator; Range hood
- Bedrooms: 3 bedrooms (all on the main level) — bedroom sizes include 10 x 15, 10 x 15, and 6 x 10
- Bathrooms: 1 full bathroom (main level)
- Heating & cooling: Natural gas heating; Central air conditioning
- Interior features: Attic access; Living room (10 x 15); Dining room (10 x 8)
- Laundry & utility: Dedicated laundry room; Washer; Dryer
Neighborhood map
What this means for you Summary
Snapshot
- This is a 2-bed/1.0-bath single-family listed at $80k.
Deal economics
- At list price, monthly cash flow is $209 ($3k/yr) — positive.
- The deal already cash-flows at list — no discount required.
- Meets the 1% rule at list price ($909 rent vs $80k).
- Recommended offer: $79k (1.5% below list) — sets the bar for market timing.
Location & tenants
- Location reads 65/100 on livability (#337 in IN) — a middle-class / working-renter tenant base. Strengths: crime A+, cost of living A+, housing A+; Watch: amenities F, commute F, employment F.
- Marion Community Schools (town): math 18% / reading 24% proficiency, ranked #277 of 301 in IN (top 92%) — low school quality limits family demand, transient renter base, plan for 1-2y turnover; 67% free/reduced lunch — lower-income household profile, screen leases tightly.
- Zoned schools: Marion High School (math 12% / reading 47%, grade F, #308 of 369 statewide, top 84%, 1,050 students, 66% FRL) — zoned schools at 66% FRL track the district average.
- Market conditions: 112 active listings in the ZIP; 3 comparable units currently listed for rent nearby; rentals lingering (median 44d on market — plan ~5-8 weeks vacancy on turnover, expect pricing pressure); 100% of comp listings sitting > 30 days — soft ceiling on asking rent; 52 units permitted in Grant County in 2024 (8 in 5+ unit buildings).
Forward outlook
- Local home prices are declining (-3.0%/yr); year-one equity from $553 of loan paydown is wiped out by about $2k of value loss. Plan a longer hold.
- Grant County population projected at -18% by 2050 — secular population decline; favor cash flow + early exit over multi-decade hold.
- At projected returns (-3.0% appreciation + 3.0% rent growth), your $22k cash investment doubles in ~10 years — after that, you're playing with house money.
Negotiation context
- It's been on market 23 days — a 2% lower offer ($79k) is reasonable based on typical stale-listing flexibility.
- 3 sale attempts since 11y ago; this cycle's ask has dropped $5k (6%) from the opening price — seller is motivated, your offer sets the floor, not the list.
- Current owner paid $12k; list at $80k implies a 567% gain — meaningful room to come down on a strong offer.
Risks & watch-outs
- Watch-outs: built in 1900 — expect roof / HVAC / electrical / plumbing capex.
Questions for the listing agent
- Built in 1900 — when were the roof, HVAC, electrical panel, plumbing, and water heater last replaced?
- Is there a deadline driving the sale (1031 exchange, divorce, estate, relocation)? That informs how much negotiation room exists.
- Schools are F-rated, which usually means shorter tenancies and higher turnover. Who's the typical renter profile here, and what's been the actual vacancy rate?
- What's the average days-on-market for RENTAL listings here right now (not sales)? A rising rental-DOM trend means longer vacancies and softer asking-rent achievability than the comps imply.
- What's the recent tenant-quality profile in this submarket — average credit score on applications, eviction rate, late-payment / NSF rate, and stable-employment percentage? A property-management company in the area should have these aggregated.
- How much new for-sale + rental construction is in the pipeline within 1–3 miles? Heavy new supply typically softens prices + rents 12–24 months out; constrained supply supports both.
Investment metrics
- 1% rule
- 1.14% ✓
- Cap rate
- 9.43%
- Cash-on-cash
- 11.22%
- DSCR
- 1.50
- GRM
- 7.3
CMA / ARV
- ARV (on-the-fly)
- $102,505
- Comps found
- 12
Show comp detail 12 sales within ~0.75 mi
| Address | Dist | Beds/Ba | Sqft | Sold | Price | $/sf | Match |
|---|---|---|---|---|---|---|---|
| 3706 S Gallatin St | 0.18mi | 2/1.5 | 984 (-9%) | 1mo | $49,000 | $50 | 74 |
| 3609 S Boots St | 0.21mi | 3/1.0 (+1) | 1,012 (-6%) | 1mo | $121,000 | $120 | 74 |
| 3640 S Adams St | 0.33mi | 2/1.0 | 1,156 (+7%) | 7mo | $41,000 | $35 | 67 |
| 4118 S Landess St | 0.54mi | 2/1.0 | 1,024 (-5%) | 6mo | $97,000 | $95 | 61 |
| 817 E 39th St | 0.47mi | 3/1.0 (+1) | 1,048 (-3%) | 9mo | $142,000 | $135 | 61 |
| 3748 S Adams St | 0.36mi | 3/2.0 (+1) | 1,040 (-4%) | 10mo | $149,900 | $144 | 60 |
| 3902 S Meridian St | 0.64mi | 2/1.0 | 1,152 (+7%) | 1mo | $85,000 | $74 | 58 |
| 2809 S Landess St | 0.66mi | 2/1.0 | 1,054 (-2%) | 9mo | $90,000 | $85 | 58 |
| 3639 S Felton St | 0.29mi | 3/1.0 (+1) | 960 (-11%) | 9mo | $74,000 | $77 | 56 |
| 3804 S Carey St | 0.41mi | 3/1.0 (+1) | 960 (-11%) | 5mo | $102,000 | $106 | 54 |
| 4104 S Poplar St | 0.59mi | 2/1.0 | 1,200 (+11%) | 4mo | $48,900 | $41 | 50 |
| 2906 S Hamaker St | 0.60mi | 3/1.0 (+1) | 1,008 (-7%) | 8mo | $110,000 | $109 | 50 |
Match score weights: distance 35% · size 25% · config 20% · recency 20%. Top-matched comps best support the ARV.
Projected returns pro-forma
-3.0% appreciation · 3.0% rent growth · sell at horizon
- IRR
- 0.4%
- Equity multiple
- 1.02×
- Total profit
- $359
- Equity at exit
- $11,928
- IRR
- 10.1%
- Equity multiple
- 1.78×
- Total profit
- $17,430
- Equity at exit
- $6,917
Cash invested: $22,400 (down + closing). Projections, not guarantees.
Landlord ↔ Tenant lean methodology
- Overall (STATE)
- 90 Strongly Landlord-Friendly
- State Indiana
- 90 Strongly Landlord-Friendly · R+11
- County
- — inherits STATE
- City
- — inherits STATE
ZIP-level market 46953
- Home prices YoY
- -23.4%
- Active inventory
- 112
- Price-to-rent
- 7.3×
Monthly cashflow live
- Estimated rent
- $909 medium interval (Pro) →
- Mortgage (P&I)
- −$420
- Tax from tax record
- −$56 /mo · $668/yr
- Insurance
- −$33
- HOA
- −$0
- Vacancy / Maint / Mgmt
- −$191
- Net cashflow
- $209
Break-even live
UW: 25.0% down · 7.5% · 30yr · 1.5% tax · 5.0% vac · 8.0% maint · 8.0% mgmt
Financing live
Cash to close
- Down payment
- $20,000
- Closing costs
- $2,400
- Reserves months
- —
- Total cash needed
- —
Loan-product check · same deal, 3 products live
Conventional
25% down · 7.5% · 30yr
- Down + closing
- —
- Monthly P&I
- —
- Monthly cashflow
- —
- DSCR
- —
- Eligible?
- —
Personal DTI + credit; lowest rate.
DSCR
20% down · 8.5% · 30yr
- Down + closing
- —
- Monthly P&I
- —
- Monthly cashflow
- —
- DSCR
- —
- Eligible?
- —
No personal income docs; deal must DSCR.
Hard money
10% down · 12.0% · 12mo
- Down + closing
- —
- Monthly P&I
- —
- Monthly cashflow
- —
- DSCR
- —
- Eligible?
- —
Short-term bridge; refi at stabilization.
Rent comps 3 comps
| Address | Beds | Baths | Sqft | Rent | $/sqft | DOM | Units | Dist |
|---|---|---|---|---|---|---|---|---|
| 2516 S Washington St Unit 1 Marion, IN | 1.0 | 1.0 | 800 | $675 | $0.84 | 43d | 1 | 0.84mi |
| 703 E 28th St Marion, IN | 2.0 | 1.0 | 1085 | $1,200 | $1.11 | 43d | 1 | 0.91mi |
| 5000 Prestwick Sq Marion, IN | 2.0–3.0 | 2.0 | 884 | $915 | $1.04 | 43d | 5 | 1.16mi |
Listing history 22 events
-
2026-06-19days on market $80,000 Active 23 DOM
-
2026-06-18days on market $80,000 Active 22 DOM
-
2026-06-17days on market $80,000 Active 21 DOM
-
2026-06-16days on market $80,000 Active 20 DOM
-
2026-06-15days on market $80,000 Active 19 DOM
-
2026-06-14days on market $80,000 Active 17 DOM
-
2026-06-12days on market $80,000 Active 16 DOM
-
2026-06-09days on market $80,000 Active 13 DOM
-
2026-06-09price $80,000 Active 12 DOM
-
2026-06-08days on market $84,900 Active 12 DOM
-
2026-06-07days on market $84,900 Active 11 DOM
-
2026-06-02days on market $84,900 Active 6 DOM
-
2026-06-01days on market $84,900 Active 5 DOM
-
2026-05-31days on market $84,900 Active 4 DOM
-
2026-05-30days on market $84,900 Active 3 DOM
-
2026-05-27$84,900 Active
-
2025-02-22historical $949
-
2025-02-14price $949
-
2025-01-10price $999
-
2024-11-08$1,099
-
2015-12-03soldstatus $12,000 124-char remark
Show marketing remark (124 chars)
Cozy 3 bedroom close to IWU. Master bedroom has 3 closets! Small lot, easy to maintain! Immediate possession on this one!
-
2015-05-11$14,900 124-char remark
Show marketing remark (124 chars)
Cozy 3 bedroom close to IWU. Master bedroom has 3 closets! Small lot, easy to maintain! Immediate possession on this one!
ⓘ Source: listings_history table (triggers on properties + properties_extension) + one-shot
backfill from property_details.listing_events for pre-trigger history.
Tax reassessment forecast IN · Partial reset (capped growth)
- Current annual tax
- $668 · $56/mo
- Projected year-2 tax
- $674 · $56/mo
- Expected delta
- +$6/yr ($0/mo · 0.9%)
ⓘ Screening estimate from a state-policy table — verify with the county assessor before closing.
Climate risk First Street
- Flood 1/10 Low FEMA zone X (unshaded) · 0% chance over 30 yrs
- Wildfire 1/10 Low
- Heat 3/10 Moderate 7 d/yr ≥100°F today · 18 d/yr by 30 yrs out
- Wind 2/10 Low
- Air quality 2/10 Low 1 unhealthy d/yr today · 2 by 30 yrs out
Nearby sold comps map
Loading sold comps map…
Walkable amenities ~0.75 mi
Loading nearby amenities…
Taxation est. · year 1
- Rental income
- $10,905
- − Mortgage interest
- −$4,481
- − Property taxes
- −$668
- − Insurance
- −$400
- − Repairs & maintenance
- −$872
- − Management
- −$872
- − Depreciation
- −$2,327
- Taxable income
- $1,284
- Est. tax owed @ 24.0%
- −$308
- After-tax cash flow
- $2,205/yr
For passive investors: Depreciation is non-cash, so a rental often shows a tax loss while cash-flowing — sheltering income. Rental losses are passive: they offset passive income freely, and up to $25,000/yr can offset ordinary (W-2) income if you actively participate and your MAGI is under $100k (phasing out to $0 by $150k); unused losses carry forward. On sale, claimed depreciation is recaptured at up to 25%, and gains may owe capital-gains tax (a 1031 exchange can defer both). Figures are a year-1 estimate at your 24.0% rate — not tax advice; consult a CPA.
Schools (NCES district)
- District
- Marion Community Schools
- NCES district ID
- 1806390
- Math proficiency
- 18% ▼ -9.00%
- Reading proficiency
- 24% ▼ -6.00%
- Median HH income
- $33,415
- Composite
- 17.13/100
- National rank
- #9115
- State rank
- #277 of 301 in IN
Livability — Marion
- Score
- 65/100
- State rank
- #337
- US rank
- #13006
Category grades
Schools grade is shown separately in the Schools card above.
Census & demographics
- Census place
- Marion, IN
- County
- Grant County · 41,561 people
- City population
- 41,561
- Metro
- Marion, IN
- Population (ZIP)
- 23,372
- Household income
- $46,288
- Rent vs Own
- Severe rent burden
- 597.0
Population outlook (Grant County) Hauer SSP2
- Today (2025)
- 64,394 people
- By 2030
- 62,145 · -3.5%
- By 2040
- 57,252 · -11.1%
- By 2050
- 52,968 · -17.7%
- By 2075
- 45,986 · -28.6%
- By 2100
- 39,400 · -38.8%
Race, ethnicity, and origin ACS 2023
- Neighborhood character
- Predominantly White (77%)
- Race & ethnicity
- White 77% Black 10% Two or more races 9% Hispanic / Latino 6%
- Hispanic origin (detail)
- Mexican 4%
- Common ancestry
- Italian 3% Iranian 1% Slovak 1%
- Foreign-born
- 2% · Canada
- Languages at home
- 96% English-only · Spanish 3%
Political lean MEDSL · Grant
- 2024 margin
- Solid R (+41.8) · D 28.2% · R 70.0% · Other 1.9%
- 2008→2024 swing
- -28.7pp toward R · 2008: -13.1pp · 2024: -41.8pp
- All cycles
- 2024: R+41.8 2020: R+38.8 2016: R+39.5 2012: R+22.0 2008: R+13.1
Not yet ingested
- Civics
- —
Market trends
- HPI YoY
- ▼ -52.47%
- Current HPI
- 171.7246
- Rent YoY
- —
- Metro
- Marion, IN
- State GDP YoY
- ▲ 2.90%
- F500 in state
- 18
Industry mix (Fortune 500 HQ in IN)
| Industry | F500 HQs | Revenue |
|---|---|---|
| Industrial Machinery | 2 | $37B |
|
||
| Healthcare | 1 | $177B |
|
||
| Pharmaceuticals | 1 | $45B |
|
||
| Metals / Steel | 1 | $18B |
|
||
| Agriculture | 1 | $17B |
|
||
| Packaging | 1 | $12B |
|
||
Price history
+469.8% since first listed7 events — show timeline
- 2026-05-27 Listed $84,900 MIBOR as Distributed by MLS Grid
- 2025-02-22 Rental Removed $949 APPFOLIO
- 2025-02-14 Price Changed $949 APPFOLIO
- 2025-01-10 Price Changed $999 APPFOLIO
- 2024-11-08 Listed for Rent $1,099 APPFOLIO
- 2015-12-03 Sold (MLS) $12,000 IRMLS
- 2015-05-11 Listed $14,900 IRMLS
Property tax history
+6.7%/yrLatest (2025): $668 · +8.8% YoY. Source: county tax records.
Cash-flow waterfall
monthlySold comps — $/sqft
last 12 mo · ≤1 miLoading sold comps…