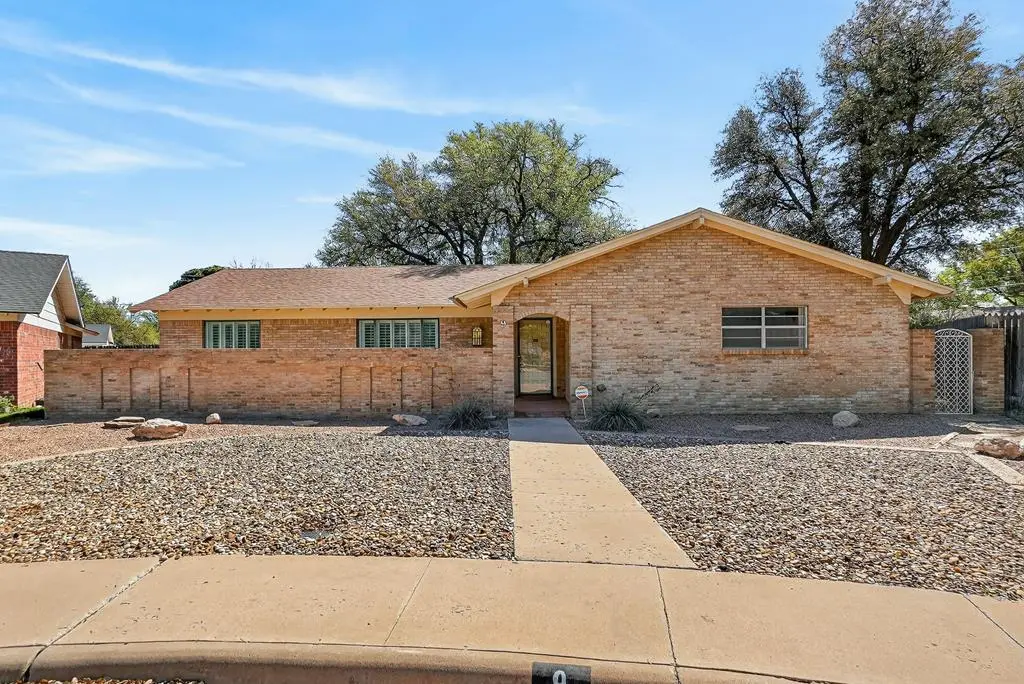
9 Marchelle Ct · Midland, TX
Flood risk 7/10 · Major
- FEMA flood zone
- —
- Chance of flooding over 30 yrs
- 0.76%
- Est. flood insurance / yr
- —
Fire risk 6/10 · Moderate
- Est. fire insurance / yr
- $1,222 – $2,270
Heat risk 6/10 · Moderate
- Hot days now (above 102°F)
- 7 days/yr
- Hot days in 30 yrs
- 21 days/yr
Wind risk 2/10 · Minimal
- Chance of severe wind over 30 yrs
- 3.0%
Air-quality risk 1/10 · Minimal
- Unhealthy air days now
- 0 days/yr
- Unhealthy air days in 30 yrs
- 0 days/yr
Risk factors via First Street. Map © Google.
Why this score? — see what drove the D grade
The composite is a weighted blend of 9 inputs, each scored 0–100. Each bar is that input's sub-score; the figure is the points it added to the 100-point composite (weight × sub-score).
- Cash flow +13.1/30.0
- ARV discount +7.5/15.0
- Livability +4.0/5.0
- DSCR +3.9/10.0
- 1% rule +3.8/10.0
- Schools +3.2/10.0
- Rent growth +3.1/5.0
- Condition / age +2.5/5.0
- Appreciation +0.0/10.0
$335,000
🖨 Deal sheet 📄 Offer letter ✓ Due diligence
Listing remarks
Beautifully maintained 3-bed, 2-bath home on a spacious lot at the end of a tree-lined cul-de-sac. Low-maintenance landscaping in both the front & back yards. Thoughtful layout featuring formal living and dining spaces, & a large, light-filled den boasting vaulted ceilings & beams. The backyard is a true retreat, complete with a wood deck & storage building. Tankless water heater, classic wood shutters, & appliances that have been used once, per the estate. Refrigerator, washer, and dryer all convey with sale. Beautiful built ins throughout the home make for easy storage. Bring offers!
Key facts
- Wood deck
- Spacious lot
- Vaulted ceilings
Tags
Property features AI
Exterior
- Parking: 2-car garage with garage door opener
- Security: Security system; Smoke detectors
- Utilities: Public water; Public sewer
- Home design: Single-family residence; One-story
- Construction: Brick veneer exterior; Composition roof; Slab foundation; Built as a residential single family home
- Exterior features: Patio; Deck; Wood fencing; Shed; Located on a cul-de-sac
Interior
- Kitchen: Oven; Electric range; Microwave; Dishwasher; Garbage disposal; Refrigerator
- Flooring: Carpet; Tile
- Bathrooms: Two full bathrooms and one half bathroom
- Heating & cooling: Central heating; Central air conditioning; Ceiling fans
- Interior features: Pantry; Built-in bookcases; Wood-burning fireplace in the den; Water softener
- Laundry & utility: Dryer; Gas water heater
Neighborhood map
What this means for you Summary
Snapshot
- This is a 3-bed/2.5-bath single-family listed at $335k.
Deal economics
- At list price, monthly cash flow is $-13 ($-157/yr) — negative.
- To cash-flow at today's rent, offer at most $333k (0.7% below list).
- To meet the 1% rule (rent ≥ 1% of price), the offer needs to be $295k (11.9% below list).
- Recommended offer: $295k (11.9% below list) — sets the bar for 1% rule.
- Cap rate 6.2% vs local median 4.7% in Midland — top-decile yield for the area; either an underpriced asset or a hidden risk that comps aren't pricing in. Stress-test before assuming the spread holds.
Location & tenants
- Location reads 79/100 on livability (#57 in TX, #2,192 nationally) — a middle-class / working-renter tenant base. Strengths: employment A+, housing A+, health & safety A+; Watch: crime C-, commute D+, amenities D.
- Midland ISD (urban): math 34% / reading 36% proficiency, ranked #477 of 826 in TX (top 58%) — families likely to look elsewhere, expect single-tenant / working-renter base with shorter leases.
- Zoned schools: Fannin El (math 34% / reading 33%, grade F, #2,174 of 4,322 statewide, top 51%, 603 students, 44% FRL); San Jacinto J H (math 26% / reading 35%, grade F, #1,036 of 1,662 statewide, top 63%, 829 students, 54% FRL); Midland H S (math 37% / reading 7%, grade F, #1,366 of 1,632 statewide, top 84%, 2,492 students, 44% FRL) — zoned schools at 47% FRL track the district average.
- Market conditions: Rents rising (+2.6%/yr); 452 active listings in the ZIP; 27 comparable units currently listed for rent nearby; rentals at typical pace (median 21d on market — plan ~3-4 weeks tenant-placement turnaround); 44% of comp listings sitting > 30 days — soft ceiling on asking rent; solid renter incomes; 1,504 units permitted in Midland County in 2024 (0 in 5+ unit buildings).
- This rent runs 34% of the median local income ($105k/yr) — at the standard rent-burdened threshold; future hikes will face affordability resistance.
Forward outlook
- Local home prices are declining (-3.0%/yr); year-one equity from $2k of loan paydown is wiped out by about $10k of value loss. Plan a longer hold.
- Midland County population projected at +83% by 2050 — long-run rental-demand tailwind backs the buy-and-hold thesis.
Negotiation context
- It's been on market 19 days — a 2% lower offer ($330k) is reasonable based on typical stale-listing flexibility.
Risks & watch-outs
- Climate carrying-cost: major flood risk; major wildfire risk; extreme-heat days projected 7→21/yr by 2055 (HVAC capex compounding) — expect insurance premiums to compound above CPI over the hold.
Questions for the listing agent
- What do current leases actually rent for vs. the listed asking? Can we see a recent rent roll and the last 12 months of T-12 income?
- Built in 1967 — when were the roof, HVAC, electrical panel, plumbing, and water heater last replaced?
- Is there a deadline driving the sale (1031 exchange, divorce, estate, relocation)? That informs how much negotiation room exists.
- The area grade is low — what's the realistic commute time and amenity access for the typical tenant pool here? Any planned neighborhood developments (good or bad) we should know about?
- What's the average days-on-market for RENTAL listings here right now (not sales)? A rising rental-DOM trend means longer vacancies and softer asking-rent achievability than the comps imply.
- What's the recent tenant-quality profile in this submarket — average credit score on applications, eviction rate, late-payment / NSF rate, and stable-employment percentage? A property-management company in the area should have these aggregated.
- How much new for-sale + rental construction is in the pipeline within 1–3 miles? Heavy new supply typically softens prices + rents 12–24 months out; constrained supply supports both.
Investment metrics
- 1% rule
- 0.88% ✗
- Cap rate
- 6.25%
- Cash-on-cash
- -0.17%
- DSCR
- 0.99
- GRM
- 9.5
CMA / ARV
No comps found within radius.
Projected returns pro-forma
-3.0% appreciation · 2.56% rent growth · sell at horizon
- IRR
- -17.1%
- Equity multiple
- 0.40×
- Total profit
- $-56,356
- Equity at exit
- $49,950
- IRR
- -9.8%
- Equity multiple
- 0.41×
- Total profit
- $-55,184
- Equity at exit
- $28,965
Cash invested: $93,800 (down + closing). Projections, not guarantees.
Landlord ↔ Tenant lean methodology
- Overall (STATE)
- 87 Strongly Landlord-Friendly
- State Texas
- 87 Strongly Landlord-Friendly · R+5
- County
- — inherits STATE
- City
- — inherits STATE
ZIP-level market 79705
- Rents YoY
- 2.6%
- Active inventory
- 452
- Price-to-rent
- 9.5×
Monthly cashflow live
- Estimated rent
- $2,951 high interval (Pro) →
- Mortgage (P&I)
- −$1,757
- Tax from tax record
- −$448 /mo · $5,373/yr
- Insurance
- −$140
- HOA
- −$0
- Vacancy / Maint / Mgmt
- −$620
- Net cashflow
- $-13
Break-even live
UW: 25.0% down · 7.5% · 30yr · 1.5% tax · 5.0% vac · 8.0% maint · 8.0% mgmt
Financing live
Cash to close
- Down payment
- $83,750
- Closing costs
- $10,050
- Reserves months
- —
- Total cash needed
- —
Loan-product check · same deal, 3 products live
Conventional
25% down · 7.5% · 30yr
- Down + closing
- —
- Monthly P&I
- —
- Monthly cashflow
- —
- DSCR
- —
- Eligible?
- —
Personal DTI + credit; lowest rate.
DSCR
20% down · 8.5% · 30yr
- Down + closing
- —
- Monthly P&I
- —
- Monthly cashflow
- —
- DSCR
- —
- Eligible?
- —
No personal income docs; deal must DSCR.
Hard money
10% down · 12.0% · 12mo
- Down + closing
- —
- Monthly P&I
- —
- Monthly cashflow
- —
- DSCR
- —
- Eligible?
- —
Short-term bridge; refi at stabilization.
Rent comps 27 comps
| Address | Beds | Baths | Sqft | Rent | $/sqft | DOM | Units | Dist |
|---|---|---|---|---|---|---|---|---|
| 11 Marchelle Ct Midland, TX | 4.0 | 2.0 | 2714 | $3,200 | $1.18 | 43d | 1 | 0.02mi |
| 3300 Durant Dr Midland, TX | 4.0 | 3.5 | 2982 | $3,650 | $1.22 | 13d | 1 | 0.41mi |
| 3300 Durant Dr Midland, TX | 3.0 | 3.5 | 2982 | $4,400 | $1.48 | 43d | 1 | 0.41mi |
| 3317 Providence Dr Midland, TX | 3.0 | 2.0 | 1810 | $2,500 | $1.38 | 43d | 1 | 0.58mi |
| 3326 W Dengar Ave Midland, TX | 4.0 | 3.0 | 2000 | $2,500 | $1.25 | 21d | 1 | 0.62mi |
| 2900 Goddard Pl Midland, TX | 4.0 | 3.0 | 2570 | $3,400 | $1.32 | 13d | 1 | 0.73mi |
| 2900 Goddard Pl Midland, TX | 4.0 | 3.0 | 2570 | $3,400 | $1.32 | 21d | 1 | 0.73mi |
| 2100 W Wadley Ave Unit L1 Midland, TX | 3.0 | 3.0 | 1854 | $2,300 | $1.24 | 43d | 1 | 0.76mi |
| 3114 Shell Ave Midland, TX | 4.0 | 2.0 | 2260 | $2,999 | $1.33 | 21d | 1 | 0.77mi |
| 3306 Haynes Ave Midland, TX | 4.0 | 2.5 | 3481 | $3,800 | $1.09 | 21d | 1 | 0.79mi |
| 3306 Haynes Ave Midland, TX | 4.0 | 2.5 | 3481 | $3,950 | $1.13 | 43d | 1 | 0.79mi |
| 2404 Goddard Ct Midland, TX | 3.0 | 2.0 | 1894 | $3,100 | $1.64 | 21d | 1 | 0.84mi |
| 2404 Northtown Ct Midland, TX | 3.0 | 2.0 | 1994 | $2,700 | $1.35 | 13d | 1 | 0.89mi |
| 2801 Exeter Ave Midland, TX | 4.0 | 2.5 | 2394 | $2,900 | $1.21 | 43d | 1 | 0.90mi |
| 3134 Tealwood Pl Midland, TX | 3.0 | 2.0 | 1974 | $2,500 | $1.27 | 21d | 1 | 0.92mi |
| 3315 Godfrey St Midland, TX | 1.0–3.0 | 1.5–4.0 | 1764 | $2,800 | $1.59 | 13d | 8 | 0.94mi |
| 2204 Boyd Ave Midland, TX | 3.0 | 2.0 | 2068 | $3,000 | $1.45 | 43d | 1 | 1.09mi |
| 2218 N H St Midland, TX | 2.0 | 3.0 | 2272 | $3,500 | $1.54 | 43d | 1 | 1.21mi |
| 4027 Angelina Dr Midland, TX | 3.0 | 2.0 | 2228 | $2,900 | $1.30 | 13d | 1 | 1.25mi |
| 1902 N I St Midland, TX | 3.0 | 2.5 | 2178 | $2,400 | $1.10 | 43d | 1 | 1.27mi |
| 1413 Ventura Ave Midland, TX | 3.0 | 2.0 | 2400 | $2,895 | $1.21 | 43d | 1 | 1.28mi |
| 1603 N L St Midland, TX | 4.0 | 3.0 | 2230 | $3,200 | $1.43 | 43d | 1 | 1.31mi |
| 2601 Bedford Dr Midland, TX | 3.0 | 2.0 | 2108 | $2,200 | $1.04 | 13d | 1 | 1.32mi |
| 4801 Whitman Dr Midland, TX | 4.0 | 2.5 | 2158 | $2,800 | $1.30 | 13d | 1 | 1.36mi |
| 4801 Whitman Dr Midland, TX | 4.0 | 2.5 | 2158 | $2,800 | $1.30 | 21d | 1 | 1.36mi |
| 4801 Whitman Dr Midland, TX | 4.0 | 2.5 | 2158 | $3,000 | $1.39 | 43d | 1 | 1.36mi |
| 2606 Keswick Cv Midland, TX | 3.0 | 2.5 | 2027 | $2,600 | $1.28 | 13d | 1 | 1.46mi |
Listing history 6 events
-
2026-04-27status Pending
-
2026-04-10historical Active Under Contract
-
2026-03-23historical
-
2026-03-20$335,000 Active
-
2009-10-08soldstatus
-
1967-11-15soldstatus
ⓘ Source: listings_history table (triggers on properties + properties_extension) + one-shot
backfill from property_details.listing_events for pre-trigger history.
Tax reassessment forecast TX · Resets to sale price
- Current annual tax
- $5,373 · $448/mo
- Projected year-2 tax
- $6,130 · $511/mo
- Expected delta
- +$757/yr (+$63/mo · 14.1%)
ⓘ Screening estimate from a state-policy table — verify with the county assessor before closing.
Climate risk First Street
- Flood 7/10 Severe 76% chance over 30 yrs
- Wildfire 6/10 Major
- Heat 6/10 Major 7 d/yr ≥102°F today · 21 d/yr by 30 yrs out
- Wind 2/10 Low 3% chance of damaging wind over 30 yrs
- Air quality 1/10 Low 0 unhealthy d/yr today · 0 by 30 yrs out
Nearby sold comps map
Loading sold comps map…
Walkable amenities ~0.75 mi
Loading nearby amenities…
Taxation est. · year 1
- Rental income
- $35,408
- − Mortgage interest
- −$18,765
- − Property taxes
- −$5,373
- − Insurance
- −$1,675
- − Repairs & maintenance
- −$2,833
- − Management
- −$2,833
- − Depreciation
- −$9,745
- Taxable loss
- −$5,816
- Est. tax savings @ 24.0%
- +$1,396
- After-tax cash flow
- $1,239/yr
For passive investors: Depreciation is non-cash, so a rental often shows a tax loss while cash-flowing — sheltering income. Rental losses are passive: they offset passive income freely, and up to $25,000/yr can offset ordinary (W-2) income if you actively participate and your MAGI is under $100k (phasing out to $0 by $150k); unused losses carry forward. On sale, claimed depreciation is recaptured at up to 25%, and gains may owe capital-gains tax (a 1031 exchange can defer both). Figures are a year-1 estimate at your 24.0% rate — not tax advice; consult a CPA.
Schools (NCES district)
- District
- Midland ISD
- NCES district ID
- 4830570
- Math proficiency
- 34% ▼ -7.00%
- Reading proficiency
- 36% ▬ 0.00%
- Median HH income
- $63,457
- Composite
- 31.63/100
- National rank
- #5938
- State rank
- #477 of 826 in TX
Livability — Midland
- Score
- 79/100
- State rank
- #57
- US rank
- #2192
Category grades
Schools grade is shown separately in the Schools card above.
Census & demographics
- Census place
- Midland, TX
- County
- Midland County · 168,494 people
- City population
- 168,494
- Metro
- Midland, TX
- Population (ZIP)
- 46,653
- Household income
- $105,310
- Rent vs Own
- Severe rent burden
- 1557.0
Population outlook (Midland County) Hauer SSP2
- Today (2025)
- 220,895 people
- By 2030
- 253,667 · +14.8%
- By 2040
- 325,498 · +47.4%
- By 2050
- 404,168 · +83.0%
- By 2075
- 609,802 · +176.1%
- By 2100
- 760,172 · +244.1%
Race, ethnicity, and origin ACS 2023
- Neighborhood character
- Diverse neighborhood (Simpson 0.60)
- Race & ethnicity
- White 46% Hispanic / Latino 43% Two or more races 20% Black 8%
- Hispanic origin (detail)
- Mexican 35%
- Common ancestry
- Slovak 1% Lithuanian 1% Serbian 1%
- Foreign-born
- 10% · Canada, Jamaica
- Languages at home
- 72% English-only · Spanish 24% Arabic 1%
Political lean MEDSL · Midland
- 2024 margin
- Solid R (+60.5) · D 19.3% · R 79.8%
- 2008→2024 swing
- -3.3pp toward R · 2008: -57.3pp · 2024: -60.5pp
- All cycles
- 2024: R+60.5 2020: R+56.6 2016: R+55.2 2012: R+61.5 2008: R+57.3
Not yet ingested
- Civics
- —
Market trends
- HPI YoY
- ▼ -300.44%
- Current HPI
- 207.2904
- Rent YoY
- ▲ 2.56%
- Metro
- Midland, TX
- State GDP YoY
- ▲ 3.95%
- F500 in state
- 110
Industry mix (Fortune 500 HQ in TX)
| Industry | F500 HQs | Revenue |
|---|---|---|
| Energy | 16 | $1,198B |
|
||
| Technology | 5 | $198B |
|
||
| Engineering / Construction | 4 | $72B |
|
||
| Energy Services | 3 | $60B |
|
||
| Utilities | 3 | $41B |
|
||
| Healthcare | 2 | $330B |
|
||
Price history
6 events — show timeline
- 2026-04-27 Pending — PBBOR
- 2026-04-10 Contingent — PBBOR
- 2026-03-23 Delisted — PBBOR
- 2026-03-20 Listed $335,000 PBBOR
- 2009-10-08 Sold (Public Records) — Public Records
- 1967-11-15 Sold (Public Records) — Public Records
Property tax history
-0.1%/yrLatest (2025): $5,373 · -8.0% YoY. Source: county tax records.
Cash-flow waterfall
monthlySold comps — $/sqft
last 12 mo · ≤1 miLoading sold comps…