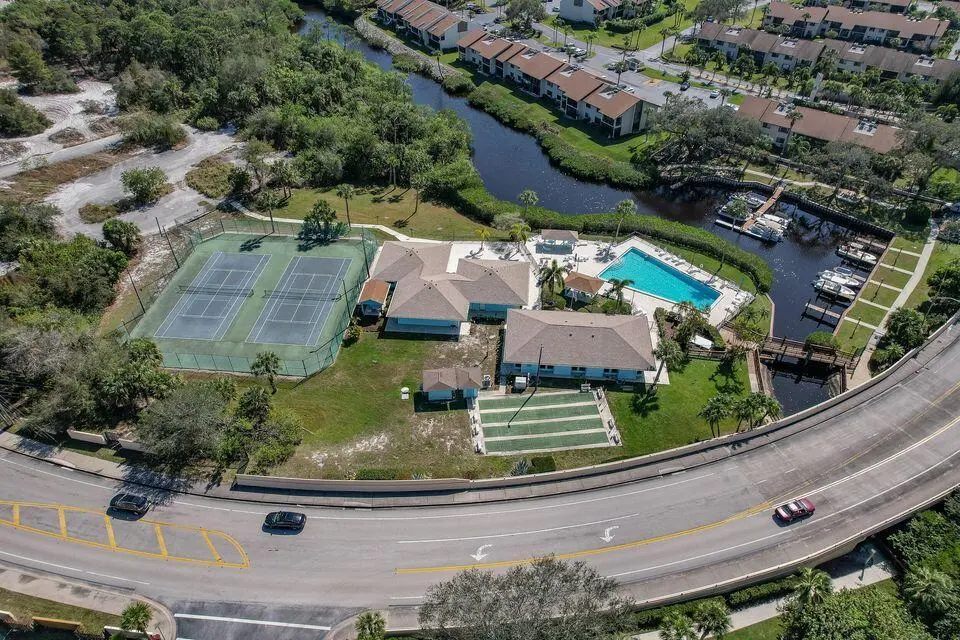
1551 NE 13th Terrace Ter NE Unit A13 · Jensen Beach, FL
Flood risk 5/10 · Moderate
- FEMA flood zone
- X (unshaded)
- Chance of flooding over 30 yrs
- 0.23%
- Est. flood insurance / yr
- $507 – $1,088
Fire risk 1/10 · Minimal
- Est. fire insurance / yr
- $947 – $1,759
Heat risk 10/10 · Severe
- Hot days now (above 106°F)
- 7 days/yr
- Hot days in 30 yrs
- 25 days/yr
Wind risk 10/10 · Severe
- Chance of severe wind over 30 yrs
- 99.0%
Air-quality risk 2/10 · Minimal
- Unhealthy air days now
- 2 days/yr
- Unhealthy air days in 30 yrs
- 2 days/yr
Risk factors via First Street. Map © Google.
Why this score? — see what drove the B- grade
The composite is a weighted blend of 9 inputs, each scored 0–100. Each bar is that input's sub-score; the figure is the points it added to the 100-point composite (weight × sub-score).
- Cash flow +21.6/30.0
- ARV discount +15.0/15.0
- 1% rule +10.0/10.0
- DSCR +6.9/10.0
- Schools +4.5/10.0
- Livability +3.5/5.0
- Rent growth +2.8/5.0
- Condition / age +2.5/5.0
- Appreciation +0.0/10.0
$135,000
🖨 Deal sheet 📄 Offer letter ✓ Due diligence
Listing remarks MLS
2nd floor 2/2 Updated corner unit with recent upgrades. 2nd bath remodeled, all knock down removed, and new hot water heater just installed. Laminate flooring in all main living areas. Covered parking spot and extra storage. Located in waterfront condo community with private marina and boat storage. Clubhouse, with sauna, pool tables, rec room, and pickle ball courts, and shuffle board courts. Large 2/2 split plan with enclosed screened porch, 1,272 under air. Close to waterfront parks, dining and shopping.
Key facts
- $650 HOA
- Parking
- Built 1973
Neighborhood map
What this means for you Summary
Snapshot
- This is a 2-bed/2.0-bath condo listed at $135k.
Deal economics
- At list price, monthly cash flow is $204 ($2k/yr) — positive.
- The deal already cash-flows at list — no discount required.
- Meets the 1% rule at list price ($2k rent vs $135k).
- Recommended offer: $131k (3.0% below list) — sets the bar for market timing.
- Cap rate 8.1% vs local median 4.1% in Jensen Beach — top-decile yield for the area; either an underpriced asset or a hidden risk that comps aren't pricing in. Stress-test before assuming the spread holds.
Location & tenants
- Location reads 70/100 on livability (#432 in FL) — a middle-class / working-renter tenant base. Strengths: crime A+, housing A+, cost of living B+; Watch: amenities F, commute F, health & safety D-.
- Martin (suburban): math 52% / reading 53% proficiency, ranked #24 of 73 in FL (top 33%) — acceptable for families but not a draw, mixed tenant base, ~2y average lease.
- Market conditions: Rents rising (+1.0%/yr); 536 active listings in the ZIP; 26 comparable units currently listed for rent nearby; rentals at typical pace (median 23d on market — plan ~3-4 weeks tenant-placement turnaround); 737 units permitted in Martin County in 2024 (167 in 5+ unit buildings).
- This rent runs 39% of the median local income ($70k/yr) — at the standard rent-burdened threshold; future hikes will face affordability resistance.
Forward outlook
- Local home prices are declining (-3.0%/yr); year-one equity from $933 of loan paydown is wiped out by about $4k of value loss. Plan a longer hold.
- Martin County population projected at +19% by 2050 — long-run rental-demand tailwind backs the buy-and-hold thesis.
Negotiation context
- It's been on market 36 days — a 3% lower offer ($131k) is reasonable based on typical stale-listing flexibility.
- 2 sale attempts since 2y ago with the ask held roughly flat each time — persistent listings suggest the price (not the market) is what's stuck; bring a comps-based counter.
- Current owner paid $44k; list at $135k implies a 207% gain — meaningful room to come down on a strong offer.
Risks & watch-outs
- Watch-outs: HOA is 28% of rent.
- Climate carrying-cost: moderate flood risk; severe wind risk, 99% chance of damaging wind over 30y; extreme-heat days projected 7→25/yr by 2055 (HVAC capex compounding) — expect insurance premiums to compound above CPI over the hold.
Questions for the listing agent
- It's been on market 36 days. Have you received any prior offers? Is the seller open to a 3% concession, seller financing, or rate buy-down credit?
- Built in 1973 — when were the roof, HVAC, electrical panel, plumbing, and water heater last replaced?
- What does the HOA fee cover, when was the last increase, and are there any pending special assessments or reserve-fund shortfalls?
- Any open or pending special assessments — roof, HVAC, plumbing, elevator, façade? What's the per-unit balance and payoff schedule, and is the seller paying it off at close or rolling it to the buyer?
- Is there a deadline driving the sale (1031 exchange, divorce, estate, relocation)? That informs how much negotiation room exists.
- Schools are B-rated — typically a magnet for longer-tenancy family renters. What's the average tenant stay here, and is there a school-zone premium baked into asking?
- What's the average days-on-market for RENTAL listings here right now (not sales)? A rising rental-DOM trend means longer vacancies and softer asking-rent achievability than the comps imply.
- What's the recent tenant-quality profile in this submarket — average credit score on applications, eviction rate, late-payment / NSF rate, and stable-employment percentage? A property-management company in the area should have these aggregated.
- How much new apartment / multifamily construction is in the pipeline within 1–3 miles? Heavy new supply (>2% of stock underway) typically softens rents 12–24 months out; light construction supports rent growth.
Investment metrics
- 1% rule
- 1.72% ✓
- Cap rate
- 8.11%
- Cash-on-cash
- 6.47%
- DSCR
- 1.29
- GRM
- 4.9
CMA / ARV
- ARV (median comp)
- $176,379
- List price
- $135,000
- Delta
- -23.46%
- Verdict
- UNDERPRICED
- Comps
- 20 within 1.0 mi
Projected returns pro-forma
-3.0% appreciation · 1.0% rent growth · sell at horizon
- IRR
- -9.7%
- Equity multiple
- 0.66×
- Total profit
- $-13,000
- Equity at exit
- $20,129
- IRR
- -5.0%
- Equity multiple
- 0.72×
- Total profit
- $-10,742
- Equity at exit
- $11,672
Cash invested: $37,800 (down + closing). Projections, not guarantees.
Landlord ↔ Tenant lean methodology
- Overall (STATE)
- 87 Strongly Landlord-Friendly
- State Florida
- 87 Strongly Landlord-Friendly · R+3
- County
- — inherits STATE
- City
- — inherits STATE
ZIP-level market 34957
- Rents YoY
- 1.0%
- Active inventory
- 536
- Price-to-rent
- 4.9×
Monthly cashflow live
- Estimated rent
- $2,316 high interval (Pro) →
- Mortgage (P&I)
- −$708
- Tax from tax record
- −$212 /mo · $2,539/yr
- Insurance
- −$56
- HOA
- −$650
- Vacancy / Maint / Mgmt
- −$486
- Net cashflow
- $204
Break-even live
UW: 25.0% down · 7.5% · 30yr · 1.5% tax · 5.0% vac · 8.0% maint · 8.0% mgmt
Financing live
Cash to close
- Down payment
- $33,750
- Closing costs
- $4,050
- Reserves months
- —
- Total cash needed
- —
Loan-product check · same deal, 3 products live
Conventional
25% down · 7.5% · 30yr
- Down + closing
- —
- Monthly P&I
- —
- Monthly cashflow
- —
- DSCR
- —
- Eligible?
- —
Personal DTI + credit; lowest rate.
DSCR
20% down · 8.5% · 30yr
- Down + closing
- —
- Monthly P&I
- —
- Monthly cashflow
- —
- DSCR
- —
- Eligible?
- —
No personal income docs; deal must DSCR.
Hard money
10% down · 12.0% · 12mo
- Down + closing
- —
- Monthly P&I
- —
- Monthly cashflow
- —
- DSCR
- —
- Eligible?
- —
Short-term bridge; refi at stabilization.
Rent comps 26 comps
| Address | Beds | Baths | Sqft | Rent | $/sqft | DOM | Units | Dist |
|---|---|---|---|---|---|---|---|---|
| 1550 NE 13th Ter Unit B16 Jensen Beach, FL | 2.0 | 2.0 | 1272 | $1,800 | $1.42 | 23d | 1 | 0.02mi |
| 1411 NE 14th Ct #13 Jensen Beach, FL | 2.0 | 2.0 | 1100 | $3,000 | $2.73 | 23d | 1 | 0.11mi |
| 1600 NE Dixie Hwy Unit 10-203 Jensen Beach, FL | 2.0 | 2.0 | 1072 | $2,300 | $2.15 | 23d | 1 | 0.18mi |
| 1617 NE Nautical Pl Jensen Beach, FL | 2.0 | 2.0 | 961 | $1,850 | $1.93 | 13d | 1 | 0.18mi |
| 1585 NE Beacon Dr #1103 Jensen Beach, FL | 2.0 | 2.0 | 961 | $1,495 | $1.56 | 23d | 1 | 0.24mi |
| 1097 NE Kubin Ave Jensen Beach, FL | 2.0 | 1.5 | 952 | $2,450 | $2.57 | 23d | 1 | 0.61mi |
| 2013 NE Collins Cir #50 Jensen Beach, FL | 2.0 | 2.0 | 903 | $1,800 | $1.99 | 13d | 1 | 0.66mi |
| 1971 NE Collins Cir #20 Jensen Beach, FL | 2.0 | 2.0 | 1037 | $1,750 | $1.69 | 23d | 1 | 0.66mi |
| 1999 NE Collins Cir Unit 3-80 Jensen Beach, FL | 2.0 | 2.0 | 1067 | $1,775 | $1.66 | 23d | 1 | 0.68mi |
| 1001 NE Baker Rd Stuart, FL | 1.0–3.0 | 1.0–2.0 | 952 | $2,280 | $2.40 | 13d | 27 | 0.85mi |
| 590 NE Lima Vias Jensen Beach, FL | 2.0 | 2.0 | 1295 | $3,300 | $2.55 | 23d | 1 | 0.91mi |
| 257 Preserve Trl N Stuart, FL | 3.0 | 2.5 | 1652 | $2,700 | $1.63 | 23d | 1 | 1.04mi |
| 1903 NE Media Ave Jensen Beach, FL | 2.0 | 2.0 | 1324 | $2,400 | $1.81 | 23d | 1 | 1.06mi |
| 2563 NE Palm Ave Jensen Beach, FL | 2.0 | 2.0 | 950 | $2,400 | $2.53 | 23d | 1 | 1.16mi |
| 2506 NE Heron's Walk Jensen Beach, FL | 2.0 | 1.0 | 1000 | $2,400 | $2.40 | 23d | 1 | 1.23mi |
| 2646 NE Pelican Way Jensen Beach, FL | 1.0 | 1.0 | 1000 | $2,400 | $2.40 | 23d | 1 | 1.27mi |
| 2632 NE Pelican Way Jensen Beach, FL | 2.0 | 1.0 | 1000 | $4,800 | $4.80 | 23d | 1 | 1.27mi |
| 2831 NE Savannah Rd Jensen Beach, FL | 3.0 | 2.0 | 1248 | $3,000 | $2.40 | 23d | 1 | 1.29mi |
| 25 NE 17th St Stuart, FL | 3.0 | 2.0 | 990 | $2,000 | $2.02 | 23d | 1 | 1.31mi |
| 150 SE Four Winds Dr Unit B303 Stuart, FL | 2.0 | 2.0 | 1359 | $2,500 | $1.84 | 23d | 1 | 1.31mi |
| 1398 NW Cavendish Ct Stuart, FL | 2.0–3.0 | 2.5 | 1242 | $2,393 | $1.93 | 21d | 11 | 1.38mi |
| 2952 NE Savannah Rd Jensen Beach, FL | 3.0 | 2.0 | 1056 | $3,000 | $2.84 | 23d | 1 | 1.39mi |
| 175 SE Saint Lucie Blvd Stuart, FL | 2.0 | 2.0–2.5 | 1300 | $2,600 | $2.00 | 23d | 4 | 1.43mi |
| 1366 NE Hilltop St Jensen Beach, FL | 2.0 | 2.0 | 1596 | $2,700 | $1.69 | 23d | 1 | 1.48mi |
| 3111 NE Savannah Rd Jensen Beach, FL | 2.0 | 1.0 | 1085 | $1,995 | $1.84 | 13d | 1 | 1.49mi |
| 262 SE Monterey Ave Stuart, FL | 3.0 | 1.0 | 1001 | $3,500 | $3.50 | 23d | 1 | 1.49mi |
HOA detail condo
- Monthly dues
- $650 · $7,800/yr
- Likely covers
- waterpool
- Assessments
- None detected in remarks — confirm with the listing agent.
Listing history 9 events
-
2026-05-31status $135,000 Pending 36 DOM
-
2026-05-31days on market $135,000 Active 36 DOM
-
2026-05-31days on market $135,000 Active 35 DOM
-
2026-04-25$135,000 Active 518-char remark
Show marketing remark (518 chars)
2nd floor 2/2 Updated corner unit with recent upgrades. 2nd bath remodeled, all knock down removed, and new hot water heater just installed. Laminate flooring in all main living areas. Covered parking spot and extra storage. Located in waterfront condo community with private marina and boat storage. Clubhouse, with sauna, pool tables, rec room, and pickle ball courts, and shuffle board courts. Large 2/2 split plan with enclosed screened porch, 1,272 under air. Close to waterfront parks, dining and shopping.
-
2024-10-05historical
-
2024-09-04price $140,000
-
2024-08-15price $155,000
-
2024-07-21$169,900 Active
-
1995-05-31soldstatus $44,000
ⓘ Source: listings_history table (triggers on properties + properties_extension) + one-shot
backfill from property_details.listing_events for pre-trigger history.
Tax reassessment forecast FL · Resets to sale price
- Current annual tax
- $2,539 · $212/mo
- Projected year-2 tax
- $2,539 · $212/mo
- Expected delta
- $0/yr ($0/mo · 0.0%)
ⓘ Screening estimate from a state-policy table — verify with the county assessor before closing.
Climate risk First Street
- Flood 5/10 Major FEMA zone X (unshaded) · 23% chance over 30 yrs
- Wildfire 1/10 Low
- Heat 10/10 Extreme 7 d/yr ≥106°F today · 25 d/yr by 30 yrs out
- Wind 10/10 Extreme 99% chance of damaging wind over 30 yrs
- Air quality 2/10 Low 2 unhealthy d/yr today · 2 by 30 yrs out
Nearby sold comps map
Loading sold comps map…
Walkable amenities ~0.75 mi
Loading nearby amenities…
Taxation est. · year 1
- Rental income
- $27,793
- − Mortgage interest
- −$7,562
- − Property taxes
- −$2,539
- − Insurance
- −$675
- − Repairs & maintenance
- −$2,223
- − Management
- −$2,223
- − HOA
- −$7,800
- − Depreciation
- −$3,927
- Taxable income
- $842
- Est. tax owed @ 24.0%
- −$202
- After-tax cash flow
- $2,244/yr
For passive investors: Depreciation is non-cash, so a rental often shows a tax loss while cash-flowing — sheltering income. Rental losses are passive: they offset passive income freely, and up to $25,000/yr can offset ordinary (W-2) income if you actively participate and your MAGI is under $100k (phasing out to $0 by $150k); unused losses carry forward. On sale, claimed depreciation is recaptured at up to 25%, and gains may owe capital-gains tax (a 1031 exchange can defer both). Figures are a year-1 estimate at your 24.0% rate — not tax advice; consult a CPA.
Schools (NCES district)
- District
- Martin
- NCES district ID
- 1201290
- Math proficiency
- 52% ▼ -14.00%
- Reading proficiency
- 53% ▼ -4.00%
- Median HH income
- $52,482
- Composite
- 45.1/100
- National rank
- #2690
- State rank
- #24 of 73 in FL
Livability — Jensen Beach
- Score
- 70/100
- State rank
- #432
- US rank
- #7719
Category grades
Schools grade is shown separately in the Schools card above.
Census & demographics
- Census place
- Jensen Beach, FL
- County
- Martin County · 165,223 people
- City population
- 23,462
- Metro
- Port St. Lucie, FL
- Population (ZIP)
- 23,462
- Household income
- $70,403
- Rent vs Own
- Severe rent burden
- 946.0
Population outlook (Martin County) Hauer SSP2
- Today (2025)
- 172,383 people
- By 2030
- 180,192 · +4.5%
- By 2040
- 194,114 · +12.6%
- By 2050
- 204,992 · +18.9%
- By 2075
- 229,641 · +33.2%
- By 2100
- 232,146 · +34.7%
Race, ethnicity, and origin ACS 2023
- Neighborhood character
- Predominantly White (85%)
- Race & ethnicity
- White 85% Hispanic / Latino 7% Two or more races 6% Asian 2% Black 2%
- Hispanic origin (detail)
- Mexican 1% Puerto Rican 2% Cuban 1%
- Common ancestry
- Romanian 4% Slovak 3% Lithuanian 3%
- Foreign-born
- 10% · Canada, Jamaica
- Languages at home
- 90% English-only · Spanish 5% Other Indo-European 2% Tagalog/Filipino 1%
Political lean MEDSL · Martin
- 2024 margin
- Solid R (+31.1) · D 34.1% · R 65.2%
- 2008→2024 swing
- -17.5pp toward R · 2008: -13.6pp · 2024: -31.1pp
- All cycles
- 2024: R+31.1 2020: R+24.6 2016: R+26.9 2012: R+22.9 2008: R+13.6
Not yet ingested
- Civics
- —
Market trends
- HPI YoY
- ▼ -319.66%
- Current HPI
- 340.0172
- Rent YoY
- ▲ 1.00%
- Metro
- Port St. Lucie, FL
- State GDP YoY
- ▲ 3.28%
- F500 in state
- 36
Industry mix (Fortune 500 HQ in FL)
| Industry | F500 HQs | Revenue |
|---|---|---|
| Industrial Technology | 2 | $29B |
|
||
| Insurance | 2 | $17B |
|
||
| Retail | 1 | $60B |
|
||
| Technology Distribution | 1 | $58B |
|
||
| Homebuilding | 1 | $35B |
|
||
| Technology Manufacturing | 1 | $35B |
|
||
Price history
+206.8% since first listed6 events — show timeline
- 2026-04-25 Listed $135,000 Beaches MLS
- 2024-10-05 Listing Removed — Beaches MLS
- 2024-09-04 Price Changed $140,000 Beaches MLS
- 2024-08-15 Price Changed $155,000 Beaches MLS
- 2024-07-21 Listed $169,900 Beaches MLS
- 1995-05-31 Sold (Public Records) $44,000 Public Records
Property tax history
+21.4%/yrLatest (2025): $2,539 · +1720.4% YoY. Source: county tax records.
Cash-flow waterfall
monthlySold comps — $/sqft
last 12 mo · ≤1 miLoading sold comps…