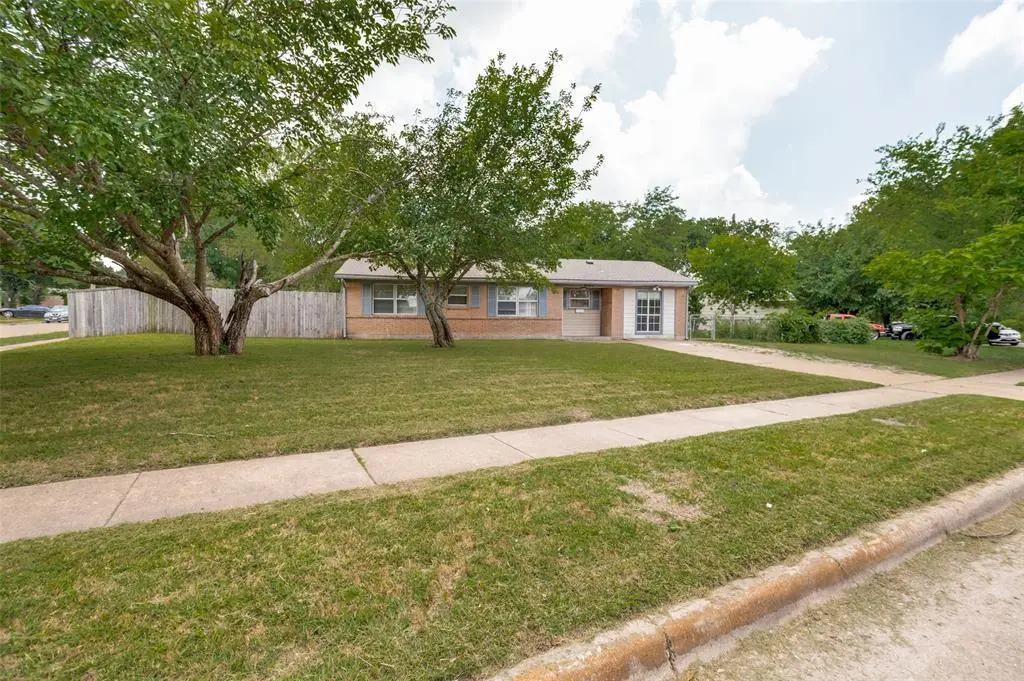
2524 Suffolk Ln · Lancaster, TX
Flood risk 1/10 · Minimal
- FEMA flood zone
- X (unshaded)
- Chance of flooding over 30 yrs
- 0.0%
- Est. flood insurance / yr
- $507 – $1,088
Fire risk 3/10 · Minor
- Est. fire insurance / yr
- $1,222 – $2,270
Heat risk 7/10 · Major
- Hot days now (above 110°F)
- 7 days/yr
- Hot days in 30 yrs
- 24 days/yr
Wind risk 6/10 · Moderate
- Chance of severe wind over 30 yrs
- 27.0%
Air-quality risk 2/10 · Minimal
- Unhealthy air days now
- 2 days/yr
- Unhealthy air days in 30 yrs
- 2 days/yr
Risk factors via First Street. Map © Google.
Why this score? — see what drove the D+ grade
The composite is a weighted blend of 9 inputs, each scored 0–100. Each bar is that input's sub-score; the figure is the points it added to the 100-point composite (weight × sub-score).
- Cash flow +15.5/30.0
- ARV discount +11.1/15.0
- 1% rule +4.9/10.0
- DSCR +4.8/10.0
- Livability +3.1/5.0
- Rent growth +2.6/5.0
- Condition / age +2.5/5.0
- Schools +2.1/10.0
- Appreciation +0.0/10.0
$209,000
🖨 Deal sheet 📄 Offer letter ✓ Due diligence
Listing remarks MLS
This corner lot home has tons of potential & loads of possibilities. A covered porch for relaxing, a detached grg ideal for a workshop and plenty of yard for family gatherings. Inside you'll find a large dining & pass through kitchen that overlook the family room so no one is left out of conversations. The original grg has been convered to additional living space, but could easily be re-converted the way you want it. Don't miss this opportunity!
Key facts
- Covered deck
- Tile flooring
- Corner lot
Tags
Property features AI
Finance
- HOA & community: No association (None)
Exterior
- Parking: Driveway; Garage; One covered parking space; One garage space
- Utilities: City water; City sewer; Cable available
- Home design: Single family residence; Residential property; One story; Built in 1962; Not attached to another property
- Construction: Brick and wood construction; Composition roof; Slab foundation
- Exterior features: Covered deck; Corner lot; Interior lot; Large backyard with grass
Interior
- Kitchen: Dishwasher; Electric cooktop; Electric oven; Vented exhaust fan; Granite countertop in bath (granite counters noted in interior features)
- Bedrooms: Total of 4 bedrooms; Primary bedroom on main level
- Flooring: Ceramic tile; Laminate
- Bathrooms: 1 full bathroom
- Heating & cooling: Central heating (natural gas); Central air conditioning; Ceiling fan(s); Electric cooling components
- Interior features: Cable TV available; Granite counters; High-speed internet available; Window coverings; One living area; One dining area; Total room count: 8; Levels: One
- Laundry & utility: Washer hookup
Neighborhood map
What this means for you Summary
Snapshot
- This is a 3-bed/1.5-bath single-family listed at $209k.
Deal economics
- At list price, monthly cash flow is $82 ($989/yr) — positive.
- The deal already cash-flows at list — no discount required.
- To meet the 1% rule (rent ≥ 1% of price), the offer needs to be $207k (1.2% below list).
- Recommended offer: $207k (1.2% below list) — sets the bar for 1% rule.
- Cap rate 6.8% vs local median 4.8% in Lancaster — top-decile yield for the area; either an underpriced asset or a hidden risk that comps aren't pricing in. Stress-test before assuming the spread holds.
Location & tenants
- Location reads 62/100 on livability (#926 in TX) — a middle-class / working-renter tenant base. Strengths: cost of living A+, housing A+; Watch: employment C-, crime F, amenities F.
- Lancaster ISD (suburban): math 19% / reading 29% proficiency, ranked #714 of 826 in TX (top 86%) — low school quality limits family demand, transient renter base, plan for 1-2y turnover; 78% free/reduced lunch — lower-income household profile, screen leases tightly.
- Zoned schools: Pleasant Run El (math 22% / reading 22%, grade F, #3,333 of 4,322 statewide, top 80%, 622 students, 99% FRL) — zoned schools average 99% FRL vs 78% district-wide (21 pts higher); higher-poverty schools than district average — tighter screening recommended.
- Market conditions: Rents flat; 102 active listings in the ZIP; 15 comparable units currently listed for rent nearby; rentals at typical pace (median 24d on market — plan ~3-4 weeks tenant-placement turnaround); 47% of comp listings sitting > 30 days — soft ceiling on asking rent; 12,577 units permitted in Dallas County in 2024 (6,829 in 5+ unit buildings).
- This rent runs 36% of the median local income ($70k/yr) — at the standard rent-burdened threshold; future hikes will face affordability resistance.
Forward outlook
- Local home prices are declining (-3.0%/yr); year-one equity from $1k of loan paydown is wiped out by about $6k of value loss. Plan a longer hold.
- Dallas County population projected at +35% by 2050 — long-run rental-demand tailwind backs the buy-and-hold thesis.
Negotiation context
- Only 1 days on market — expect competitive offers; lowballing is unlikely to land.
- 5 sale attempts since 24y ago with the ask held roughly flat each time — persistent listings suggest the price (not the market) is what's stuck; bring a comps-based counter.
Risks & watch-outs
- Climate carrying-cost: major wind risk, 27% chance of damaging wind over 30y; extreme-heat days projected 7→24/yr by 2055 (HVAC capex compounding) — expect insurance premiums to compound above CPI over the hold.
Questions for the listing agent
- Built in 1962 — when were the roof, HVAC, electrical panel, plumbing, and water heater last replaced?
- Is there a deadline driving the sale (1031 exchange, divorce, estate, relocation)? That informs how much negotiation room exists.
- Schools are D-rated, which usually means shorter tenancies and higher turnover. Who's the typical renter profile here, and what's been the actual vacancy rate?
- Crime grade is F in this area — have there been break-ins, vandalism, or insurance claims at this property in the last 3 years? What carrier currently insures it and at what premium?
- The area grade is low — what's the realistic commute time and amenity access for the typical tenant pool here? Any planned neighborhood developments (good or bad) we should know about?
- What's the average days-on-market for RENTAL listings here right now (not sales)? A rising rental-DOM trend means longer vacancies and softer asking-rent achievability than the comps imply.
- What's the recent tenant-quality profile in this submarket — average credit score on applications, eviction rate, late-payment / NSF rate, and stable-employment percentage? A property-management company in the area should have these aggregated.
- How much new for-sale + rental construction is in the pipeline within 1–3 miles? Heavy new supply typically softens prices + rents 12–24 months out; constrained supply supports both.
Investment metrics
- 1% rule
- 0.99% ✗
- Cap rate
- 6.77%
- Cash-on-cash
- 1.69%
- DSCR
- 1.08
- GRM
- 8.4
CMA / ARV
- ARV (on-the-fly)
- $227,392
- Comps found
- 12
Show comp detail 12 sales within ~0.75 mi
| Address | Dist | Beds/Ba | Sqft | Sold | Price | $/sf | Match |
|---|---|---|---|---|---|---|---|
| 605 Colgate Dr | 0.31mi | 3/2.0 | 1,172 (-4%) | 3mo | $219,000 | $187 | 75 |
| 606 Colgate Dr | 0.33mi | 3/2.0 | 1,172 (-4%) | 11mo | $260,000 | $222 | 67 |
| 842 Potomac Dr | 0.36mi | 3/2.0 | 1,254 (+3%) | 14mo | $235,000 | $187 | 64 |
| 840 Potomac Dr | 0.36mi | 3/2.0 | 1,289 (+6%) | 14mo | $235,000 | $182 | 59 |
| 2916 Tanglewood Dr | 0.51mi | 3/2.5 | 1,248 (+3%) | 14mo | $189,900 | $152 | 56 |
| 610 Colgate Dr | 0.32mi | 2/2.0 (-1) | 1,087 (-11%) | 5mo | $219,900 | $202 | 56 |
| 2742 E Pepperidge Dr | 0.42mi | 3/2.0 | 1,390 (+14%) | 2mo | $230,000 | $165 | 53 |
| 2910 Tanglewood Dr | 0.50mi | 2/1.5 (-1) | 1,080 (-11%) | 2mo | $145,999 | $135 | 52 |
| 1443 Irene Ave | 0.55mi | 2/1.0 (-1) | 1,094 (-10%) | 10mo | $240,000 | $219 | 42 |
| 2833 Stonycroft Ct | 0.40mi | 2/1.0 (-1) | 1,057 (-13%) | 13mo | $188,000 | $178 | 42 |
| 1116 Cresthaven Dr | 0.71mi | 3/2.0 | 1,383 (+14%) | 5mo | $278,000 | $201 | 38 |
| 879 W Wintergreen Rd | 0.74mi | 3/2.0 | 1,383 (+14%) | 9mo | $250,000 | $181 | 33 |
Match score weights: distance 35% · size 25% · config 20% · recency 20%. Top-matched comps best support the ARV.
Projected returns pro-forma
-3.0% appreciation · 0.33% rent growth · sell at horizon
- IRR
- -16.8%
- Equity multiple
- 0.42×
- Total profit
- $-33,924
- Equity at exit
- $31,163
- IRR
- -14.9%
- Equity multiple
- 0.26×
- Total profit
- $-43,411
- Equity at exit
- $18,071
Cash invested: $58,520 (down + closing). Projections, not guarantees.
Landlord ↔ Tenant lean methodology
- Overall (STATE)
- 87 Strongly Landlord-Friendly
- State Texas
- 87 Strongly Landlord-Friendly · R+5
- County
- — inherits STATE
- City
- — inherits STATE
ZIP-level market 75134
- Home prices YoY
- -17.1%
- Rents YoY
- 0.3%
- Active inventory
- 102
- Price-to-rent
- 8.4×
Monthly cashflow live
- Estimated rent
- $2,065 high interval (Pro) →
- Mortgage (P&I)
- −$1,096
- Tax from tax record
- −$366 /mo · $4,391/yr
- Insurance
- −$87
- HOA
- −$0
- Vacancy / Maint / Mgmt
- −$434
- Net cashflow
- $82
Break-even live
UW: 25.0% down · 7.5% · 30yr · 1.5% tax · 5.0% vac · 8.0% maint · 8.0% mgmt
Financing live
Cash to close
- Down payment
- $52,250
- Closing costs
- $6,270
- Reserves months
- —
- Total cash needed
- —
Loan-product check · same deal, 3 products live
Conventional
25% down · 7.5% · 30yr
- Down + closing
- —
- Monthly P&I
- —
- Monthly cashflow
- —
- DSCR
- —
- Eligible?
- —
Personal DTI + credit; lowest rate.
DSCR
20% down · 8.5% · 30yr
- Down + closing
- —
- Monthly P&I
- —
- Monthly cashflow
- —
- DSCR
- —
- Eligible?
- —
No personal income docs; deal must DSCR.
Hard money
10% down · 12.0% · 12mo
- Down + closing
- —
- Monthly P&I
- —
- Monthly cashflow
- —
- DSCR
- —
- Eligible?
- —
Short-term bridge; refi at stabilization.
Rent comps 15 comps
| Address | Beds | Baths | Sqft | Rent | $/sqft | DOM | Units | Dist |
|---|---|---|---|---|---|---|---|---|
| 2617 Arcady Cir Lancaster, TX | 3.0 | 2.0 | 1361 | $1,950 | $1.43 | 20d | 1 | 0.14mi |
| 2617 Arcady Cir Lancaster, TX | 3.0 | 2.0 | 1361 | $1,950 | $1.43 | 43d | 1 | 0.14mi |
| 833 Stanford Dr Lancaster, TX | 3.0 | 1.0 | 1008 | $1,725 | $1.71 | 43d | 1 | 0.22mi |
| 834 Apple Valley Dr Lancaster, TX | 3.0 | 2.0 | 1425 | $2,275 | $1.60 | 43d | 1 | 0.34mi |
| 719 Westover Dr Lancaster, TX | 3.0 | 2.0 | 1248 | $1,900 | $1.52 | 24d | 1 | 0.48mi |
| 2746 Town North Dr Lancaster, TX | 4.0 | 2.0 | 1377 | $2,000 | $1.45 | 7d | 1 | 0.52mi |
| 2922 E Pepperidge Dr Lancaster, TX | 4.0 | 2.0 | 1444 | $2,000 | $1.39 | 43d | 1 | 0.55mi |
| 907 Cresthaven Dr Lancaster, TX | 3.0 | 2.0 | 1366 | $1,850 | $1.35 | 24d | 1 | 0.67mi |
| 509 Arbor Ln Lancaster, TX | 3.0 | 2.0 | 1494 | $1,875 | $1.26 | 43d | 1 | 0.69mi |
| 1326 Johns Ave Lancaster, TX | 4.0 | 2.0 | 1236 | $2,100 | $1.70 | 43d | 1 | 0.70mi |
| 1533 Prescott Dr Lancaster, TX | 3.0 | 2.0 | 1500 | $1,975 | $1.32 | 4d | 1 | 0.85mi |
| 1532 Linda Ln Lancaster, TX | 3.0 | 2.0 | 1380 | $2,000 | $1.45 | 24d | 1 | 0.92mi |
| 1255 W Pleasant Run Rd Lancaster, TX | 1.0–2.0 | 1.0–2.0 | 802 | $1,450 | $1.81 | 7d | 10 | 1.12mi |
| 577 W 6th St Lancaster, TX | 3.0 | 1.0 | 954 | $1,600 | $1.68 | 43d | 1 | 1.30mi |
| 823 N Dallas Ave Lancaster, TX | 2.0 | 1.0 | 1156 | $1,425 | $1.23 | 10d | 1 | 1.38mi |
Listing history 2 events
-
2026-06-18remarks 693-char remark
-
2026-06-18$209,000 Active 1 DOM
ⓘ Source: listings_history table (triggers on properties + properties_extension) + one-shot
backfill from property_details.listing_events for pre-trigger history.
Tax reassessment forecast TX · Resets to sale price
- Current annual tax
- $4,391 · $366/mo
- Projected year-2 tax
- $4,391 · $366/mo
- Expected delta
- $0/yr ($0/mo · 0.0%)
ⓘ Screening estimate from a state-policy table — verify with the county assessor before closing.
Climate risk First Street
- Flood 1/10 Low FEMA zone X (unshaded) · 0% chance over 30 yrs
- Wildfire 3/10 Moderate
- Heat 7/10 Severe 7 d/yr ≥110°F today · 24 d/yr by 30 yrs out
- Wind 6/10 Major 27% chance of damaging wind over 30 yrs
- Air quality 2/10 Low 2 unhealthy d/yr today · 2 by 30 yrs out
Nearby sold comps map
Loading sold comps map…
Walkable amenities ~0.75 mi
Loading nearby amenities…
Taxation est. · year 1
- Rental income
- $24,782
- − Mortgage interest
- −$11,707
- − Property taxes
- −$4,391
- − Insurance
- −$1,045
- − Repairs & maintenance
- −$1,983
- − Management
- −$1,983
- − Depreciation
- −$6,080
- Taxable loss
- −$2,407
- Est. tax savings @ 24.0%
- +$578
- After-tax cash flow
- $1,567/yr
For passive investors: Depreciation is non-cash, so a rental often shows a tax loss while cash-flowing — sheltering income. Rental losses are passive: they offset passive income freely, and up to $25,000/yr can offset ordinary (W-2) income if you actively participate and your MAGI is under $100k (phasing out to $0 by $150k); unused losses carry forward. On sale, claimed depreciation is recaptured at up to 25%, and gains may owe capital-gains tax (a 1031 exchange can defer both). Figures are a year-1 estimate at your 24.0% rate — not tax advice; consult a CPA.
Schools (NCES district)
- District
- Lancaster ISD
- NCES district ID
- 4826670
- Math proficiency
- 19% ▼ -29.00%
- Reading proficiency
- 29% ▼ -11.00%
- Median HH income
- $52,275
- Composite
- 21.41/100
- National rank
- #8349
- State rank
- #714 of 826 in TX
Livability — Lancaster
- Score
- 62/100
- State rank
- #926
- US rank
- #16461
Category grades
Schools grade is shown separately in the Schools card above.
Census & demographics
- Census place
- Lancaster, TX
- County
- Dallas County · 2,612,404 people
- City population
- 44,142
- Metro
- Dallas-Fort Worth-Arlington, TX
- Population (ZIP)
- 19,045
- Household income
- $69,778
- Rent vs Own
- Severe rent burden
- 399.0
Population outlook (Dallas County) Hauer SSP2
- Today (2025)
- 2,979,839 people
- By 2030
- 3,191,823 · +7.1%
- By 2040
- 3,619,611 · +21.5%
- By 2050
- 4,026,915 · +35.1%
- By 2075
- 4,957,073 · +66.4%
- By 2100
- 5,508,725 · +84.9%
Race, ethnicity, and origin ACS 2023
- Neighborhood character
- Predominantly Black (68%)
- Race & ethnicity
- Black 68% Hispanic / Latino 22% Two or more races 9% White 8%
- Hispanic origin (detail)
- Mexican 20%
- Common ancestry
- Slovak 1%
- Foreign-born
- 9% · Canada
- Languages at home
- 79% English-only · Spanish 20%
Political lean MEDSL · Dallas
- 2024 margin
- Strong D (+22.2) · D 60.2% · R 38.0% · Other 1.8%
- 2008→2024 swing
- +6.9pp toward D · 2008: 15.3pp · 2024: 22.2pp
- All cycles
- 2024: D+22.2 2020: D+31.6 2016: D+26.2 2012: D+15.4 2008: D+15.3
Not yet ingested
- Civics
- —
Market trends
- HPI YoY
- ▼ -66.51%
- Current HPI
- 323.4396
- Rent YoY
- ▲ 0.33%
- Metro
- Dallas-Fort Worth-Arlington, TX
- State GDP YoY
- ▲ 3.95%
- F500 in state
- 110
Industry mix (Fortune 500 HQ in TX)
| Industry | F500 HQs | Revenue |
|---|---|---|
| Energy | 16 | $1,198B |
|
||
| Technology | 5 | $198B |
|
||
| Engineering / Construction | 4 | $72B |
|
||
| Energy Services | 3 | $60B |
|
||
| Utilities | 3 | $41B |
|
||
| Healthcare | 2 | $330B |
|
||
Price history
+188.3% since first listed15 events — show timeline
- 2026-06-18 Listed $209,000 NTREIS
- 2011-10-17 Sold (Public Records) — Public Records
- 2011-03-30 Sold (MLS) — NTREIS
- 2011-03-09 Pending — NTREIS
- 2011-02-27 Price Changed $26,900 NTREIS
- 2011-01-25 Relisted — NTREIS
- 2011-01-25 Price Changed $31,900 NTREIS
- 2011-01-24 Listing Removed — NTREIS
- 2011-01-07 Listed $36,900 NTREIS
- 2011-01-07 Listing Removed — NTREIS
- 2010-10-01 Listing Removed — NTREIS
- 2010-05-18 Listed $36,900 NTREIS
- 2002-12-13 Sold (Public Records) — Public Records
- 2002-11-18 Listing Removed — NTREIS
- 2002-11-03 Listed $72,500 NTREIS
Property tax history
+9.2%/yrLatest (2025): $4,391 · -0.2% YoY. Source: county tax records.
Cash-flow waterfall
monthlySold comps — $/sqft
last 12 mo · ≤1 miLoading sold comps…