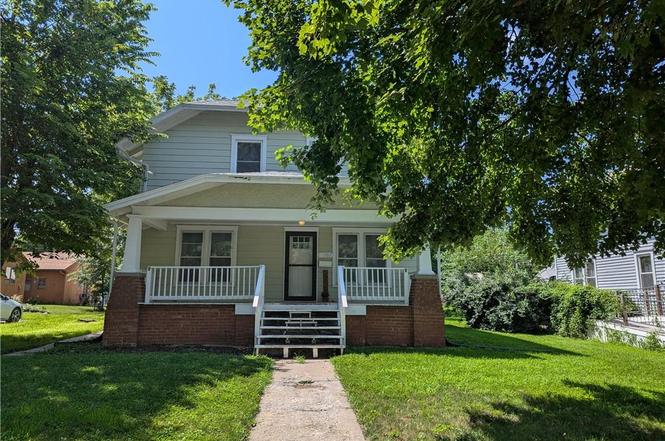
505 Shawnee St · Hiawatha, KS
Flood risk 1/10 · Minimal
- FEMA flood zone
- X (unshaded)
- Chance of flooding over 30 yrs
- 0.0%
- Est. flood insurance / yr
- $473 – $860
Fire risk 2/10 · Minimal
- Est. fire insurance / yr
- $1,154 – $2,142
Heat risk 3/10 · Minor
- Hot days now (above 107°F)
- 7 days/yr
- Hot days in 30 yrs
- 16 days/yr
Wind risk 2/10 · Minimal
- Chance of severe wind over 30 yrs
- —
Air-quality risk 2/10 · Minimal
- Unhealthy air days now
- 0 days/yr
- Unhealthy air days in 30 yrs
- 1 days/yr
Risk factors via First Street. Map © Google.
Why this score? — see what drove the C- grade
The composite is a weighted blend of 9 inputs, each scored 0–100. Each bar is that input's sub-score; the figure is the points it added to the 100-point composite (weight × sub-score).
- Cash flow +15.8/30.0
- ARV discount +15.0/15.0
- DSCR +4.9/10.0
- 1% rule +4.2/10.0
- Livability +3.7/5.0
- Rent growth +2.5/5.0
- Schools +2.5/10.0
- Condition / age +2.5/5.0
- Appreciation +0.0/10.0
$127,000
🖨 Deal sheet (PDF) 📄 Offer letter ✓ Due diligence
Key facts
- Covered front porch
- Detached garage
- Built-ins
Tags
Property features AI
Finance
- Other: Directions: Hwy 73 to Hiawatha, turn west on Shawnee from 1st Street and travel 5 blocks to home on the south side of the street.
- HOA & community: No association fees
Exterior
- Parking: Detached 1-car garage
- Utilities: City/public water (verify); Public sewer
- Home design: Single-family residence; Residential property; 2 stories; Living area about 1,568 above-grade square feet
- Construction: Wood siding; Composition roof; Built over 100 years ago
- Exterior features: Lot approximately 7,000 square feet; Not in a flood plain; Public road maintenance
Interior
- Bedrooms: 4 bedrooms
- Bathrooms: 2 full bathrooms; 1 half bathroom
- Heating & cooling: Natural gas heating; Electric cooling (has central or electric cooling)
- Interior features: Full basement; Enclosed porch; 8 total rooms; 2-story floor plan
Neighborhood map
What this means for you Summary
Snapshot
- This is a 4-bed/2.5-bath single-family listed at $127k.
Deal economics
- At list price, monthly cash flow is $59 ($710/yr) — positive.
- The deal already cash-flows at list — no discount required.
- To meet the 1% rule (rent ≥ 1% of price), the offer needs to be $117k (8.2% below list).
- Recommended offer: $112k (12.0% below list) — sets the bar for market timing.
Location & tenants
- Location reads 74/100 on livability (#90 in KS, #4,934 nationally) — a middle-class / working-renter tenant base. Strengths: cost of living A+, health & safety A+, housing A-; Watch: crime D-, commute F, employment F.
- Hiawatha (town): math 26% / reading 32% proficiency, ranked #112 of 169 in KS (top 66%) — low school quality limits family demand, transient renter base, plan for 1-2y turnover.
- Zoned schools: Hiawatha Elem (math 27% / reading 32%, grade F, #463 of 684 statewide, top 73%, 359 students, 59% FRL); Hiawatha Middle School (math 26% / reading 34%, grade F, #64 of 219 statewide, top 32%, 276 students, 51% FRL); Hiawatha Sr High (math 22% / reading 22%, grade F, #165 of 327 statewide, top 55%, 267 students, 47% FRL).
- Market conditions: 32 active listings in the ZIP; 2 units permitted in Brown County in 2024 (0 in 5+ unit buildings).
Forward outlook
- Local home prices are declining (-3.0%/yr); year-one equity from $878 of loan paydown is wiped out by about $4k of value loss. Plan a longer hold.
- Brown County population projected at -12% by 2050 — secular population decline; favor cash flow + early exit over multi-decade hold.
Negotiation context
- It's been on market 326 days — a 12% lower offer ($112k) is reasonable based on typical stale-listing flexibility.
- Current owner paid $55k; list at $127k implies a 131% gain — meaningful room to come down on a strong offer.
Risks & watch-outs
- Watch-outs: built in 1920 — expect roof / HVAC / electrical / plumbing capex.
Questions for the listing agent
- It's been on market 326 days. Have you received any prior offers? Is the seller open to a 12% concession, seller financing, or rate buy-down credit?
- Built in 1920 — when were the roof, HVAC, electrical panel, plumbing, and water heater last replaced?
- Why hasn't it sold? Are there any deal-killer items the seller is aware of (foundation, flood, title, zoning, code violations)?
- Is there a deadline driving the sale (1031 exchange, divorce, estate, relocation)? That informs how much negotiation room exists.
- Schools are D-rated, which usually means shorter tenancies and higher turnover. Who's the typical renter profile here, and what's been the actual vacancy rate?
- Crime grade is D in this area — have there been break-ins, vandalism, or insurance claims at this property in the last 3 years? What carrier currently insures it and at what premium?
- What's the average days-on-market for RENTAL listings here right now (not sales)? A rising rental-DOM trend means longer vacancies and softer asking-rent achievability than the comps imply.
- What's the recent tenant-quality profile in this submarket — average credit score on applications, eviction rate, late-payment / NSF rate, and stable-employment percentage? A property-management company in the area should have these aggregated.
- How much new for-sale + rental construction is in the pipeline within 1–3 miles? Heavy new supply typically softens prices + rents 12–24 months out; constrained supply supports both.
Investment metrics
- 1% rule
- 0.92% ✗
- Cap rate
- 6.85%
- Cash-on-cash
- 2.00%
- DSCR
- 1.09
- GRM
- 9.1
CMA / ARV
- ARV (on-the-fly)
- $169,344
- Comps found
- 9
Show comp detail 9 sales within ~0.75 mi
| Address | Dist | Beds/Ba | Sqft | Sold | Price | $/sf | Match |
|---|---|---|---|---|---|---|---|
| 313 Shawnee St | 0.14mi | 3/1.0 (-1) | 1,640 (+5%) | 2mo | $127,000 | $77 | 73 |
| 301 S 6th St | 0.30mi | 3/2.5 (-1) | 1,587 (+1%) | 10mo | $279,000 | $176 | 71 |
| 500 N 4th St | 0.21mi | 3/2.5 (-1) | 1,400 (-11%) | 4mo | $194,000 | $139 | 64 |
| 311 Miami St | 0.16mi | 3/2.0 (-1) | 1,441 (-8%) | 15mo | $110,000 | $76 | 60 |
| 209 Shawnee St | 0.25mi | 3/2.0 (-1) | 1,625 (+4%) | 20mo | $175,000 | $108 | 59 |
| 110 N 2nd St | 0.29mi | 4/1.5 | 1,803 (+15%) | 12mo | $212,000 | $118 | 47 |
| 205 Cheyenne Ave | 0.44mi | 3/1.0 (-1) | 1,510 (-4%) | 18mo | $137,000 | $91 | 47 |
| 524 Kansas Ave | 0.26mi | 3/1.0 (-1) | 1,784 (+14%) | 14mo | $127,000 | $71 | 42 |
| 111 Pawnee St | 0.52mi | 3/1.5 (-1) | 1,788 (+14%) | 2mo | $210,000 | $117 | 41 |
Match score weights: distance 35% · size 25% · config 20% · recency 20%. Top-matched comps best support the ARV.
Projected returns pro-forma
-3.0% appreciation · 3.0% rent growth · sell at horizon
- IRR
- -13.1%
- Equity multiple
- 0.53×
- Total profit
- $-16,805
- Equity at exit
- $18,936
- IRR
- -4.1%
- Equity multiple
- 0.73×
- Total profit
- $-9,752
- Equity at exit
- $10,981
Cash invested: $35,560 (down + closing). Projections, not guarantees.
Landlord ↔ Tenant lean methodology
- Overall (STATE)
- 83 Strongly Landlord-Friendly
- State Kansas
- 83 Strongly Landlord-Friendly · R+10
- County
- — inherits STATE
- City
- — inherits STATE
ZIP-level market 66434
- Home prices YoY
- -19.1%
- Active inventory
- 32
- Price-to-rent
- 9.1×
Monthly cashflow live
- Estimated rent
- $1,166 medium interval (Pro) →
- Mortgage (P&I)
- −$666
- Tax from tax record
- −$143 /mo · $1,713/yr
- Insurance
- −$53
- HOA
- −$0
- Vacancy / Maint / Mgmt
- −$245
- Net cashflow
- $59
Break-even live
Sensitivity live
| Price | -10% $131 | -5% $95 | +0% $59 | +5% $23 | +10% $-13 |
|---|---|---|---|---|---|
| Rent | -10% $-33 | -5% $13 | +0% $59 | +5% $105 | +10% $151 |
| Rate | -1.0pp $123 | -0.5pp $91 | base $59 | +0.5pp $26 | +1.0pp $-7 |
UW: 25.0% down · 7.5% · 30yr · 1.5% tax · 5.0% vac · 8.0% maint · 8.0% mgmt
Financing live
Cash to close
- Down payment
- $31,750
- Closing costs
- $3,810
- Reserves months
- —
- Total cash needed
- —
Loan-product check · same deal, 3 products live
Conventional
25% down · 7.5% · 30yr
- Down + closing
- —
- Monthly P&I
- —
- Monthly cashflow
- —
- DSCR
- —
- Eligible?
- —
Personal DTI + credit; lowest rate.
DSCR
20% down · 8.5% · 30yr
- Down + closing
- —
- Monthly P&I
- —
- Monthly cashflow
- —
- DSCR
- —
- Eligible?
- —
No personal income docs; deal must DSCR.
Hard money
10% down · 12.0% · 12mo
- Down + closing
- —
- Monthly P&I
- —
- Monthly cashflow
- —
- DSCR
- —
- Eligible?
- —
Short-term bridge; refi at stabilization.
Listing history 24 events
-
2026-06-21days on market $127,000 Active 326 DOM
-
2026-06-21days on market $127,000 Active 325 DOM
-
2026-06-18days on market $127,000 Active 323 DOM
-
2026-06-17days on market $127,000 Active 322 DOM
-
2026-06-16days on market $127,000 Active 321 DOM
-
2026-06-15days on market $127,000 Active 320 DOM
-
2026-06-13days on market $127,000 Active 318 DOM
-
2026-06-12days on market $127,000 Active 317 DOM
-
2026-06-09days on market $127,000 Active 314 DOM
-
2026-06-08days on market $127,000 Active 313 DOM
-
2026-06-07days on market $127,000 Active 312 DOM
-
2026-06-05days on market $127,000 Active 310 DOM
-
2026-06-04days on market $127,000 Active 308 DOM
-
2026-06-02days on market $127,000 Active 307 DOM
-
2026-06-01days on market $127,000 Active 306 DOM
-
2026-05-31days on market $127,000 Active 305 DOM
-
2026-05-31days on market $127,000 Active 304 DOM
-
2026-04-03price $127,000
-
2026-02-26price $135,000
-
2025-08-28price $143,000
-
2025-07-30$147,000 Active
-
2007-07-01soldstatus $55,000
-
1999-11-01soldstatus $64,000
-
1992-09-01soldstatus $43,000
ⓘ Source: listings_history table (triggers on properties + properties_extension) + one-shot
backfill from property_details.listing_events for pre-trigger history.
Tax reassessment forecast KS · Resets to sale price
- Current annual tax
- $1,713 · $143/mo
- Projected year-2 tax
- $1,791 · $149/mo
- Expected delta
- +$78/yr (+$7/mo · 4.6%)
ⓘ Screening estimate from a state-policy table — verify with the county assessor before closing.
Climate risk First Street
- Flood 1/10 Low FEMA zone X (unshaded) · 0% chance over 30 yrs
- Wildfire 2/10 Low
- Heat 3/10 Moderate 7 d/yr ≥107°F today · 16 d/yr by 30 yrs out
- Wind 2/10 Low
- Air quality 2/10 Low 0 unhealthy d/yr today · 1 by 30 yrs out
Nearby sold comps map
Loading sold comps map…
Walkable amenities ~0.75 mi
Loading nearby amenities…
Taxation est. · year 1
- Rental income
- $13,986
- − Mortgage interest
- −$7,114
- − Property taxes
- −$1,713
- − Insurance
- −$635
- − Repairs & maintenance
- −$1,119
- − Management
- −$1,119
- − Depreciation
- −$3,695
- Taxable loss
- −$1,408
- Est. tax savings @ 24.0%
- +$338
- After-tax cash flow
- $1,047/yr
For passive investors: Depreciation is non-cash, so a rental often shows a tax loss while cash-flowing — sheltering income. Rental losses are passive: they offset passive income freely, and up to $25,000/yr can offset ordinary (W-2) income if you actively participate and your MAGI is under $100k (phasing out to $0 by $150k); unused losses carry forward. On sale, claimed depreciation is recaptured at up to 25%, and gains may owe capital-gains tax (a 1031 exchange can defer both). Figures are a year-1 estimate at your 24.0% rate — not tax advice; consult a CPA.
Schools (NCES district)
- District
- Hiawatha
- NCES district ID
- 2000006
- Math proficiency
- 26% ▼ -4.00%
- Reading proficiency
- 32% ▼ -11.00%
- Median HH income
- $41,098
- Composite
- 24.5/100
- National rank
- #7653
- State rank
- #112 of 169 in KS
Livability — Hiawatha
- Score
- 74/100
- State rank
- #90
- US rank
- #4934
Category grades
Schools grade is shown separately in the Schools card above.
Census & demographics
- Census place
- Hiawatha, KS
- Population (ZIP)
- 4,738
Population outlook (Brown County) Hauer SSP2
- Today (2025)
- 9,357 people
- By 2030
- 9,119 · -2.5%
- By 2040
- 8,629 · -7.8%
- By 2050
- 8,188 · -12.5%
- By 2075
- 7,138 · -23.7%
- By 2100
- 5,586 · -40.3%
Race, ethnicity, and origin ACS 2023
- Neighborhood character
- Predominantly White (88%)
- Race & ethnicity
- White 88% Two or more races 5% Hispanic / Latino 2% Native American 2% Black 2%
- Common ancestry
- Romanian 3% Iranian 3% Slovak 2%
- Foreign-born
- 2% · Canada, China
- Languages at home
- 98% English-only · Spanish 1%
Political lean MEDSL · Brown
- 2024 margin
- Solid R (+47.9) · D 25.0% · R 73.0% · Other 2.0%
- 2008→2024 swing
- -9.8pp toward R · 2008: -38.1pp · 2024: -47.9pp
- All cycles
- 2024: R+47.9 2020: R+48.2 2016: R+50.8 2012: R+44.0 2008: R+38.1
Not yet ingested
- Civics
- —
Market trends
- HPI YoY
- ▼ -55.16%
- Current HPI
- 233.9129
- Rent YoY
- —
- Metro
- —
- State GDP YoY
- —
- F500 in state
- 0
Price history
+195.3% since first listed7 events — show timeline
- 2026-04-03 Price Changed $127,000 Heartland MLS as Distributed by MLS Grid
- 2026-02-26 Price Changed $135,000 Heartland MLS as Distributed by MLS Grid
- 2025-08-28 Price Changed $143,000 Heartland MLS as Distributed by MLS Grid
- 2025-07-30 Listed $147,000 Heartland MLS as Distributed by MLS Grid
- 2007-07-01 Sold (Public Records) $55,000 Public Records
- 1999-11-01 Sold (Public Records) $64,000 Public Records
- 1992-09-01 Sold (Public Records) $43,000 Public Records
Property tax history
+4.9%/yrLatest (2025): $1,713 · +11.9% YoY. Source: county tax records.
Cash-flow waterfall
monthlySold comps — $/sqft
last 12 mo · ≤1 miLoading sold comps…