 Fourplex
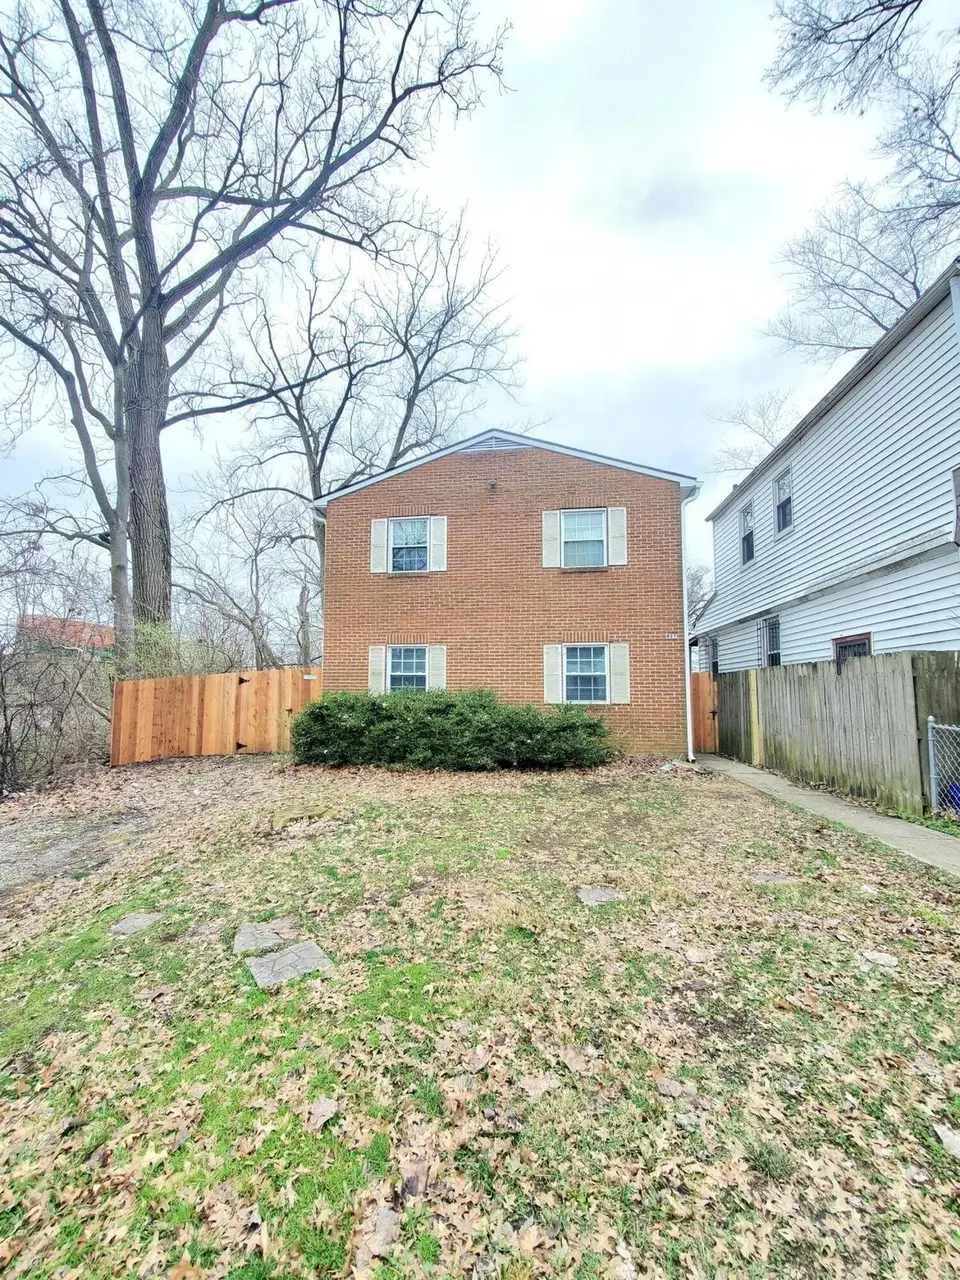
497 E Oakland Ave · Columbus, OH
Flood risk 1/10 · Minimal
- FEMA flood zone
- X (unshaded)
- Chance of flooding over 30 yrs
- 0.0%
- Est. flood insurance / yr
- $507 – $1,088
Fire risk 1/10 · Minimal
- Est. fire insurance / yr
- $713 – $1,323
Heat risk 3/10 · Minor
- Hot days now (above 100°F)
- 7 days/yr
- Hot days in 30 yrs
- 18 days/yr
Wind risk 2/10 · Minimal
- Chance of severe wind over 30 yrs
- 0.0%
Air-quality risk 3/10 · Minor
- Unhealthy air days now
- 2 days/yr
- Unhealthy air days in 30 yrs
- 4 days/yr
Risk factors via First Street. Map © Google.
Why this score? — see what drove the D grade
The composite is a weighted blend of 9 inputs, each scored 0–100. Each bar is that input's sub-score; the figure is the points it added to the 100-point composite (weight × sub-score).
- Cash flow +14.3/30.0
- ARV discount +9.3/15.0
- 1% rule +4.7/10.0
- DSCR +4.3/10.0
- Livability +4.0/5.0
- Rent growth +2.6/5.0
- Condition / age +2.5/5.0
- Schools +1.7/10.0
- Appreciation +0.0/10.0
$475,000
🖨 Deal sheet (PDF) 📄 Offer letter ✓ Due diligence
Multi-family units
County records classify this as Multi-Family (5+ Unit). Listing-text estimate: 4 units. estimate disagrees with records
5+ unit building — per-unit beds/baths from public records are typically unavailable; the breakdown below (if shown) is an estimate from the listing text.
Listing remarks
Excellent investment opportunity near Ohio State University and the Ohio Expo Center & State Fair. This fully occupied 4-unit building features four 2 bedroom, 1 bath units, providing immediate rental income potential. Each unit is separately sub-metered for all utilities, including water, offering convenience and expense control for ownership. Recent improvements include new fencing with gated access, new gutters with leaf guards, off-street parking, and updates throughout the property. With strong rental demand in the area and close proximity to dining, shopping, entertainment, and major employers in Columbus, this is a fantastic addition to any investment portfolio.
Key facts
- New fencing
- Gated access
- New gutters
Tags
Property features AI
Finance
- Financial info: 4 total units; Net operating income approximately $34,800; Operating expenses approximately $22,500
Exterior
- Utilities: Public water; Public sewer; Natural gas available; Electricity available
- Home design: Midrise property; Built in 1969
- Exterior features: Lot about 0.1 acres
Interior
- Heating & cooling: Forced air heating; No cooling
- Interior features: Forced air heating; No central cooling
Neighborhood map
What this means for you Summary
Snapshot
- This is a 4 × 2-bed/1-bath units multifamily listed at $475k.
Deal economics
- At list price, monthly cash flow is $84 ($1k/yr) — positive. Per door: $21/mo.
- The deal already cash-flows at list — no discount required.
- To meet the 1% rule (rent ≥ 1% of price), the offer needs to be $460k (3.1% below list).
- Recommended offer: $446k (6.0% below list) — sets the bar for market timing.
- Cap rate 6.5% vs local median 3.8% in Columbus — top-decile yield for the area; either an underpriced asset or a hidden risk that comps aren't pricing in. Stress-test before assuming the spread holds.
Location & tenants
- Location reads 81/100 on livability (#97 in OH, #1,491 nationally) — a professional / high-income tenant draw. Strengths: commute A+, cost of living A+, housing A+; Watch: employment C-, crime F.
- Columbus City School District (urban): math 15% / reading 26% proficiency, ranked #626 of 656 in OH (top 95%) — low school quality limits family demand, transient renter base, plan for 1-2y turnover; 72% free/reduced lunch — lower-income household profile, screen leases tightly.
- Zoned schools: Indianola Informal K-8 School (math 43% / reading 58%, grade D+, #896 of 1,584 statewide, top 57%, 684 students, 0% FRL); Dominion Middle School (math 39% / reading 50%, grade D, #477 of 654 statewide, top 74%, 717 students, 0% FRL); Whetstone High School (math 17% / reading 44%, grade F, #615 of 781 statewide, top 79%, 976 students, 0% FRL) — zoned schools average 0% FRL vs 72% district-wide (72 pts lower); this property's tenant base skews higher-income than the district average.
- Zoned-school proficiency averages 42% at this address vs 20% district-wide (+21 pts) — the actual schools serving this property are materially stronger than the Columbus City School District average implies; a family-tenant draw the district grade alone would hide.
- Market conditions: Rents flat; 49 active listings in the ZIP; 8,139 units permitted in Franklin County in 2024 (5,940 in 5+ unit buildings).
- At $4,602/mo this rent would consume 79% of the median local household income ($70k/yr) (locally 1426% of renters already pay >50% of income on rent) — very limited rent-growth headroom before tenants either downsize or default.
Forward outlook
- Local home prices are declining (-3.0%/yr); year-one equity from $3k of loan paydown is wiped out by about $14k of value loss. Plan a longer hold.
- Franklin County population projected at +34% by 2050 — long-run rental-demand tailwind backs the buy-and-hold thesis.
Negotiation context
- It's been on market 62 days — a 6% lower offer ($446k) is reasonable based on typical stale-listing flexibility.
- 9 sale attempts since 20y ago with the ask held roughly flat each time — persistent listings suggest the price (not the market) is what's stuck; bring a comps-based counter.
Questions for the listing agent
- It's been on market 62 days. Have you received any prior offers? Is the seller open to a 6% concession, seller financing, or rate buy-down credit?
- Can we see the unit-by-unit rent roll, current vacancy, and any below-market leases? What's the average tenancy length?
- What capital expenditures (roof, boiler, parking lot, exteriors) have been made in the last 5 years, and what's planned in the next 2?
- Built in 1969 — when were the roof, HVAC, electrical panel, plumbing, and water heater last replaced?
- Why hasn't it sold? Are there any deal-killer items the seller is aware of (foundation, flood, title, zoning, code violations)?
- Is there a deadline driving the sale (1031 exchange, divorce, estate, relocation)? That informs how much negotiation room exists.
- Crime grade is F in this area — have there been break-ins, vandalism, or insurance claims at this property in the last 3 years? What carrier currently insures it and at what premium?
- The area grade is low — what's the realistic commute time and amenity access for the typical tenant pool here? Any planned neighborhood developments (good or bad) we should know about?
- What's the average days-on-market for RENTAL listings here right now (not sales)? A rising rental-DOM trend means longer vacancies and softer asking-rent achievability than the comps imply.
- What's the recent tenant-quality profile in this submarket — average credit score on applications, eviction rate, late-payment / NSF rate, and stable-employment percentage? A property-management company in the area should have these aggregated.
- How much new apartment / multifamily construction is in the pipeline within 1–3 miles? Heavy new supply (>2% of stock underway) typically softens rents 12–24 months out; light construction supports rent growth.
Investment metrics
- 1% rule
- 0.97% ✗
- Cap rate
- 6.51%
- Cash-on-cash
- 0.76%
- DSCR
- 1.03
- GRM
- 8.6
CMA / ARV
- ARV (median comp)
- $495,181
- List price
- $475,000
- Delta
- -4.08%
- Verdict
- FAIR
- Comps
- 20 within 1.0 mi
Show comp detail 4 sales within ~0.75 mi
| Address | Dist | Beds/Ba | Sqft | Sold | Price | $/sf | Match |
|---|---|---|---|---|---|---|---|
| 261 E Northwood Ave #40 | 0.33mi | 9/— (+1) | 3,180 (+2%) | 6mo | $500,000 | $157 | 71 |
| 2075 N 4th St | 0.24mi | 8/— | 3,276 (+5%) | 12mo | $539,900 | $165 | 71 |
| 1988 1990 N 4th St | 0.34mi | 7/— (-1) | 3,240 (+4%) | 3mo | $440,951 | $136 | 70 |
| 2210-2212 Indianola Ave | 0.33mi | 8/— | 3,348 (+7%) | 10mo | $625,000 | $187 | 64 |
Match score weights: distance 35% · size 25% · config 20% · recency 20%. Top-matched comps best support the ARV.
Projected returns pro-forma
-3.0% appreciation · 0.59% rent growth · sell at horizon
- IRR
- -18.0%
- Equity multiple
- 0.38×
- Total profit
- $-82,283
- Equity at exit
- $70,824
- IRR
- -16.2%
- Equity multiple
- 0.20×
- Total profit
- $-106,416
- Equity at exit
- $41,069
Cash invested: $133,000 (down + closing). Projections, not guarantees.
Landlord ↔ Tenant lean methodology
- Overall (STATE)
- 73 Landlord-Friendly
- State Ohio
- 73 Landlord-Friendly · R+6
- County
- — inherits STATE
- City
- — inherits STATE
ZIP-level market 43202
- Rents YoY
- 0.6%
- Active inventory
- 49
- Price-to-rent
- 34.4×
Monthly cashflow live
- Estimated rent
- $4,602 high interval (Pro) →
- Mortgage (P&I)
- −$2,491
- Tax from tax record
- −$863 /mo · $10,353/yr
- Insurance
- −$198
- HOA
- −$0
- Vacancy / Maint / Mgmt
- −$966
- Net cashflow
- $84
Break-even live
Sensitivity live
| Price | -10% $353 | -5% $218 | +0% $84 | +5% $-50 | +10% $-185 |
|---|---|---|---|---|---|
| Rent | -10% $-280 | -5% $-98 | +0% $84 | +5% $266 | +10% $448 |
| Rate | -1.0pp $323 | -0.5pp $205 | base $84 | +0.5pp $-39 | +1.0pp $-164 |
4-unit breakdown (identical units grouped — click to expand)
| Units | Beds | Baths | Est. rent |
|---|---|---|---|
| 4× units | 2 | 1 | $4,604 |
| #1 | 2 | 1 | $1,151 |
| #2 | 2 | 1 | $1,151 |
| #3 | 2 | 1 | $1,151 |
| #4 | 2 | 1 | $1,151 |
| Total (4 units) | $4,602 | ||
UW: 25.0% down · 7.5% · 30yr · 1.5% tax · 5.0% vac · 8.0% maint · 8.0% mgmt
Financing live
Cash to close
- Down payment
- $118,750
- Closing costs
- $14,250
- Reserves months
- —
- Total cash needed
- —
Loan-product check · same deal, 3 products live
Conventional
25% down · 7.5% · 30yr
- Down + closing
- —
- Monthly P&I
- —
- Monthly cashflow
- —
- DSCR
- —
- Eligible?
- —
Personal DTI + credit; lowest rate.
DSCR
20% down · 8.5% · 30yr
- Down + closing
- —
- Monthly P&I
- —
- Monthly cashflow
- —
- DSCR
- —
- Eligible?
- —
No personal income docs; deal must DSCR.
Hard money
10% down · 12.0% · 12mo
- Down + closing
- —
- Monthly P&I
- —
- Monthly cashflow
- —
- DSCR
- —
- Eligible?
- —
Short-term bridge; refi at stabilization.
Listing history 42 events
-
2026-06-21days on market $475,000 Active 62 DOM
-
2026-06-18days on market $475,000 Active 59 DOM
-
2026-06-17days on market $475,000 Active 58 DOM
-
2026-06-16days on market $475,000 Active 57 DOM
-
2026-06-15days on market $475,000 Active 56 DOM
-
2026-06-13days on market $475,000 Active 54 DOM
-
2026-06-13days on market $475,000 Active 53 DOM
-
2026-06-09days on market $475,000 Active 50 DOM
-
2026-06-08days on market $475,000 Active 49 DOM
-
2026-06-07days on market $475,000 Active 48 DOM
-
2026-06-05days on market $475,000 Active 45 DOM
-
2026-06-03days on market $475,000 Active 44 DOM
-
2026-06-02days on market $475,000 Active 43 DOM
-
2026-06-01days on market $475,000 Active 42 DOM
-
2026-05-31days on market $475,000 Active 41 DOM
-
2026-05-01status Active 683-char remark
-
2026-04-20historical Contingent 683-char remark
-
2026-04-20$475,000 Active 683-char remark
-
2026-02-14price $479,000
-
2026-01-22status Active
-
2026-01-14status Pending
-
2026-01-14historical
-
2026-01-06price $495,000
-
2025-10-20$515,000 Active
-
2024-11-20historical
-
2024-11-06status Active
-
2024-11-01status Pending
-
2024-10-30price $515,000
-
2024-10-18price $525,000
-
2024-09-19$535,000 Active
-
2022-09-23soldstatus $420,000
-
2022-09-20soldstatus $420,000
-
2022-09-20$420,000
-
2021-11-15soldstatus $357,000
-
2015-03-03soldstatus $199,900
-
2015-03-03$199,900
-
2008-03-04historical
-
2006-08-09$199,900
-
1998-08-12soldstatus $95,000
-
1998-08-12soldstatus $95,000
-
1991-08-09soldstatus $65,000
-
1987-07-17soldstatus $67,000
ⓘ Source: listings_history table (triggers on properties + properties_extension) + one-shot
backfill from property_details.listing_events for pre-trigger history.
Tax reassessment forecast OH · Partial reset (capped growth)
- Current annual tax
- $10,353 · $863/mo
- Projected year-2 tax
- $10,353 · $863/mo
- Expected delta
- $0/yr ($0/mo · 0.0%)
ⓘ Screening estimate from a state-policy table — verify with the county assessor before closing.
Climate risk First Street
- Flood 1/10 Low FEMA zone X (unshaded) · 0% chance over 30 yrs
- Wildfire 1/10 Low
- Heat 3/10 Moderate 7 d/yr ≥100°F today · 18 d/yr by 30 yrs out
- Wind 2/10 Low 0% chance of damaging wind over 30 yrs
- Air quality 3/10 Moderate 2 unhealthy d/yr today · 4 by 30 yrs out
Nearby sold comps map
Loading sold comps map…
Walkable amenities ~0.75 mi
Loading nearby amenities…
Taxation est. · year 1
- Rental income
- $55,224
- − Mortgage interest
- −$26,607
- − Property taxes
- −$10,353
- − Insurance
- −$2,375
- − Repairs & maintenance
- −$4,418
- − Management
- −$4,418
- − Depreciation
- −$13,818
- Taxable loss
- −$6,765
- Est. tax savings @ 24.0%
- +$1,624
- After-tax cash flow
- $2,632/yr
For passive investors: Depreciation is non-cash, so a rental often shows a tax loss while cash-flowing — sheltering income. Rental losses are passive: they offset passive income freely, and up to $25,000/yr can offset ordinary (W-2) income if you actively participate and your MAGI is under $100k (phasing out to $0 by $150k); unused losses carry forward. On sale, claimed depreciation is recaptured at up to 25%, and gains may owe capital-gains tax (a 1031 exchange can defer both). Figures are a year-1 estimate at your 24.0% rate — not tax advice; consult a CPA.
Schools (NCES district)
- District
- Columbus City School District
- NCES district ID
- 3904380
- Math proficiency
- 15% ▼ -17.00%
- Reading proficiency
- 26% ▼ -12.00%
- Median HH income
- $38,483
- Composite
- 17.19/100
- National rank
- #9105
- State rank
- #626 of 656 in OH
Livability — Columbus
- Score
- 81/100
- State rank
- #97
- US rank
- #1491
Category grades
Schools grade is shown separately in the Schools card above.
Census & demographics
- Census place
- Columbus, OH
- County
- Franklin County · 1,351,780 people
- City population
- 612,189
- Metro
- Columbus, OH
- Population (ZIP)
- 20,854
- Household income
- $69,524
- Rent vs Own
- Severe rent burden
- 1426.0
Population outlook (Franklin County) Hauer SSP2
- Today (2025)
- 1,456,139 people
- By 2030
- 1,556,890 · +6.9%
- By 2040
- 1,757,349 · +20.7%
- By 2050
- 1,950,539 · +34.0%
- By 2075
- 2,376,171 · +63.2%
- By 2100
- 2,636,796 · +81.1%
Race, ethnicity, and origin ACS 2023
- Neighborhood character
- Predominantly White (75%)
- Race & ethnicity
- White 75% Asian 11% Two or more races 6% Black 5% Hispanic / Latino 4%
- Common ancestry
- Romanian 4% Italian 3% Slovak 3%
- Foreign-born
- 15% · China, Canada, South Korea
- Languages at home
- 83% English-only · Other Indo-European 5% Spanish 2% Chinese 2%
Political lean MEDSL · Franklin
- 2024 margin
- Strong D (+28.4) · D 63.7% · R 35.3% · Other 1.0%
- 2008→2024 swing
- +7.7pp toward D · 2008: 20.7pp · 2024: 28.4pp
- All cycles
- 2024: D+28.4 2020: D+31.4 2016: D+25.9 2012: D+21.7 2008: D+20.7
Not yet ingested
- Civics
- —
Market trends
- HPI YoY
- ▼ -513.39%
- Current HPI
- 245.448
- Rent YoY
- ▲ 0.59%
- Metro
- Columbus, OH
- State GDP YoY
- ▲ 1.98%
- F500 in state
- 48
Industry mix (Fortune 500 HQ in OH)
| Industry | F500 HQs | Revenue |
|---|---|---|
| Insurance | 3 | $145B |
|
||
| Industrial Machinery | 3 | $49B |
|
||
| Financial Services | 3 | $24B |
|
||
| Consumer Goods | 2 | $93B |
|
||
| Aerospace / Defense | 2 | $47B |
|
||
| Utilities | 2 | $33B |
|
||
Price history
+609.0% since first listed27 events — show timeline
- 2026-05-01 Relisted — CBRMLS
- 2026-04-20 Contingent — CBRMLS
- 2026-04-20 Listed $475,000 CBRMLS
- 2026-02-14 Price Changed $479,000 CBRMLS
- 2026-01-22 Relisted — CBRMLS
- 2026-01-14 Pending — CBRMLS
- 2026-01-14 Listing Removed — CBRMLS
- 2026-01-06 Price Changed $495,000 CBRMLS
- 2025-10-20 Listed $515,000 CBRMLS
- 2024-11-20 Listing Removed — CBRMLS
- 2024-11-06 Relisted — CBRMLS
- 2024-11-01 Pending — CBRMLS
- 2024-10-30 Price Changed $515,000 CBRMLS
- 2024-10-18 Price Changed $525,000 CBRMLS
- 2024-09-19 Listed $535,000 CBRMLS
- 2022-09-23 Sold (Public Records) $420,000 Public Records
- 2022-09-20 Listed $420,000 CBRMLS
- 2022-09-20 Sold (MLS) $420,000 CBRMLS
- 2021-11-15 Sold (Public Records) $357,000 Public Records
- 2015-03-03 Listed $199,900 CBRMLS
- 2015-03-03 Sold (MLS) $199,900 CBRMLS
- 2008-03-04 Listing Removed — CBRMLS
- 2006-08-09 Listed $199,900 CBRMLS
- 1998-08-12 Sold (Public Records) $95,000 Public Records
- 1998-08-12 Sold (Public Records) $95,000 Public Records
- 1991-08-09 Sold (Public Records) $65,000 Public Records
- 1987-07-17 Sold (Public Records) $67,000 Public Records
Property tax history
+8.5%/yrLatest (2024): $10,353 · +1.6% YoY. Source: county tax records.
Cash-flow waterfall
monthlySold comps — $/sqft
last 12 mo · ≤1 miLoading sold comps…