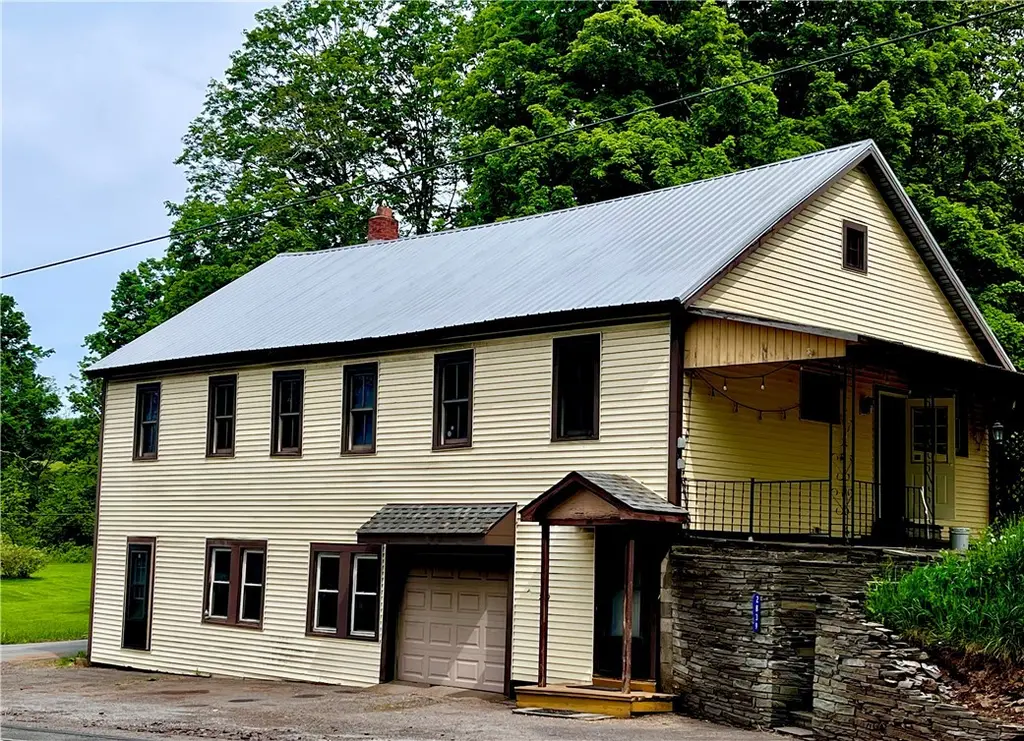
2839 State Highway 28 S · Oneonta, NY
Flood risk 1/10 · Minimal
- FEMA flood zone
- X (unshaded)
- Chance of flooding over 30 yrs
- 0.0%
- Est. flood insurance / yr
- $507 – $1,088
Fire risk 3/10 · Minor
- Est. fire insurance / yr
- $691 – $1,283
Heat risk 2/10 · Minimal
- Hot days now (above 90°F)
- 8 days/yr
- Hot days in 30 yrs
- 18 days/yr
Wind risk 2/10 · Minimal
- Chance of severe wind over 30 yrs
- 1.0%
Air-quality risk 1/10 · Minimal
- Unhealthy air days now
- 0 days/yr
- Unhealthy air days in 30 yrs
- 0 days/yr
Risk factors via First Street. Map © Google.
Why this score? — see what drove the B- grade
The composite is a weighted blend of 9 inputs, each scored 0–100. Each bar is that input's sub-score; the figure is the points it added to the 100-point composite (weight × sub-score).
- Cash flow +24.8/30.0
- Appreciation +10.0/10.0
- DSCR +8.0/10.0
- ARV discount +7.5/15.0
- 1% rule +6.6/10.0
- Livability +3.8/5.0
- Schools +3.5/10.0
- Rent growth +2.5/5.0
- Condition / age +2.5/5.0
$159,000
🖨 Deal sheet 📄 Offer letter ✓ Due diligence
Listing remarks
Steeped in local history and re imagined for modern living, this unique High Ranch at 2389 State Highway 28 S offers a rare blend of heritage and massive utility. Originally the Franklin Grange Hall, this 1920s landmark has been transformed into a sprawling residence that perfectly balances style with serious workspace. Upper Level Living (1,500 Sq. Ft. ): The main living floor features an expansive, open-concept layout with brand-new Luxury Vinyl Plank (LVP) flooring throughout for a sleek, durable finish. Flooded with natural light through high-end Anderson Windows, the space feels airy and bright, honoring its historic roots while providing all the comforts of a contemporary home. Lower
Key facts
- 0.5 acre lot
- Garage
- Built 1920
Property features AI
Exterior
- Parking: Underground parking; 1-car garage
- Utilities: Well water; Septic tank
- Home design: Two-story home; Existing/Resale property
- Construction: Frame construction with vinyl siding; Attic/crawl hatchway(s) insulated; Block foundation
- Exterior features: Awning(s); Blacktop driveway; Patio; Main thoroughfare frontage; Rectangular/rectangular lot; Agricultural lot characteristics; Lot dimensions approximately 90 x 140
Interior
- Kitchen: Electric cooktop; Electric oven; Electric range; Range hood; Exhaust fan; Freezer; Refrigerator
- Flooring: Luxury vinyl; Tile; Varies
- Bathrooms: 1 full bathroom
- Heating & cooling: Oil heating; Forced air heating
- Interior features: Separate/formal dining room; Workshop; Full basement
- Laundry & utility: Washer; Dryer; Laundry in basement; Oil water heater
Neighborhood map
What this means for you Summary
Snapshot
- This is a 4-bed/1.0-bath single-family listed at $159k.
Deal economics
- At list price, monthly cash flow is $337 ($4k/yr) — positive.
- The deal already cash-flows at list — no discount required.
- Meets the 1% rule at list price ($2k rent vs $159k).
- Recommended offer: $157k (1.5% below list) — sets the bar for market timing.
- Cap rate 8.8% vs local median 5.5% in Oneonta — top-decile yield for the area; either an underpriced asset or a hidden risk that comps aren't pricing in. Stress-test before assuming the spread holds.
Location & tenants
- Location reads 75/100 on livability (#253 in NY, #4,021 nationally) — a middle-class / working-renter tenant base. Strengths: housing A+, health & safety A+, cost of living B+; Watch: amenities C-, crime F, commute F.
- Franklin Central School District (rural): math 35% / reading 40% proficiency, ranked #664 of 755 in NY (top 88%) — families likely to look elsewhere, expect single-tenant / working-renter base with shorter leases.
- Market conditions: 118 active listings in the ZIP; 66 units permitted in Delaware County in 2024 (0 in 5+ unit buildings).
- This rent runs 34% of the median local income ($66k/yr) — at the standard rent-burdened threshold; future hikes will face affordability resistance.
Forward outlook
- In year one you build about $17k of equity ($1k loan paydown + $16k appreciation (10.0% local appreciation)).
- Delaware County population projected at -27% by 2050 — secular population decline; favor cash flow + early exit over multi-decade hold.
- At projected returns (10.0% appreciation + 3.0% rent growth), your $45k cash investment doubles in ~3 years — after that, you're playing with house money.
- By year 3, paydown + projected appreciation supports a ~$43k cash-out refi (75% LTV) — recoverable capital for the next deal without selling this one.
Negotiation context
- It's been on market 26 days — a 2% lower offer ($157k) is reasonable based on typical stale-listing flexibility.
- Current owner paid $65k; list at $159k implies a 145% gain — meaningful room to come down on a strong offer.
Risks & watch-outs
- Watch-outs: built in 1920 — expect roof / HVAC / electrical / plumbing capex.
Questions for the listing agent
- Built in 1920 — when were the roof, HVAC, electrical panel, plumbing, and water heater last replaced?
- Is there a deadline driving the sale (1031 exchange, divorce, estate, relocation)? That informs how much negotiation room exists.
- Crime grade is F in this area — have there been break-ins, vandalism, or insurance claims at this property in the last 3 years? What carrier currently insures it and at what premium?
- What's the average days-on-market for RENTAL listings here right now (not sales)? A rising rental-DOM trend means longer vacancies and softer asking-rent achievability than the comps imply.
- What's the recent tenant-quality profile in this submarket — average credit score on applications, eviction rate, late-payment / NSF rate, and stable-employment percentage? A property-management company in the area should have these aggregated.
- How much new for-sale + rental construction is in the pipeline within 1–3 miles? Heavy new supply typically softens prices + rents 12–24 months out; constrained supply supports both.
Investment metrics
- 1% rule
- 1.16% ✓
- Cap rate
- 8.84%
- Cash-on-cash
- 9.09%
- DSCR
- 1.40
- GRM
- 7.2
CMA / ARV
No comps found within radius.
Projected returns pro-forma
10.0% appreciation · 3.0% rent growth · sell at horizon
- IRR
- 30.9%
- Equity multiple
- 3.43×
- Total profit
- $108,121
- Equity at exit
- $143,240
- IRR
- 26.8%
- Equity multiple
- 7.77×
- Total profit
- $301,590
- Equity at exit
- $308,902
Cash invested: $44,520 (down + closing). Projections, not guarantees.
Landlord ↔ Tenant lean methodology
- Overall (STATE)
- 15 Strongly Tenant-Friendly
- State New York
- 15 Strongly Tenant-Friendly · D+10
- County
- — inherits STATE
- City
- — inherits STATE
ZIP-level market 13820
- Home prices YoY
- 22.7%
- Active inventory
- 118
- Price-to-rent
- 7.2×
Monthly cashflow live
- Estimated rent
- $1,849 medium interval (Pro) →
- Mortgage (P&I)
- −$834
- Tax from tax record
- −$223 /mo · $2,682/yr
- Insurance
- −$66
- HOA
- −$0
- Vacancy / Maint / Mgmt
- −$388
- Net cashflow
- $337
Break-even live
UW: 25.0% down · 7.5% · 30yr · 1.5% tax · 5.0% vac · 8.0% maint · 8.0% mgmt
Financing live
Cash to close
- Down payment
- $39,750
- Closing costs
- $4,770
- Reserves months
- —
- Total cash needed
- —
Loan-product check · same deal, 3 products live
Conventional
25% down · 7.5% · 30yr
- Down + closing
- —
- Monthly P&I
- —
- Monthly cashflow
- —
- DSCR
- —
- Eligible?
- —
Personal DTI + credit; lowest rate.
DSCR
20% down · 8.5% · 30yr
- Down + closing
- —
- Monthly P&I
- —
- Monthly cashflow
- —
- DSCR
- —
- Eligible?
- —
No personal income docs; deal must DSCR.
Hard money
10% down · 12.0% · 12mo
- Down + closing
- —
- Monthly P&I
- —
- Monthly cashflow
- —
- DSCR
- —
- Eligible?
- —
Short-term bridge; refi at stabilization.
Listing history 18 events
-
2026-06-19days on market $159,000 Active 26 DOM
-
2026-06-18days on market $159,000 Active 25 DOM
-
2026-06-17days on market $159,000 Active 24 DOM
-
2026-06-16days on market $159,000 Active 23 DOM
-
2026-06-15days on market $159,000 Active 22 DOM
-
2026-06-14days on market $159,000 Active 20 DOM
-
2026-06-12days on market $159,000 Active 19 DOM
-
2026-06-09days on market $159,000 Active 16 DOM
-
2026-06-08days on market $159,000 Active 15 DOM
-
2026-06-07days on market $159,000 Active 14 DOM
-
2026-06-07days on market $159,000 Active 13 DOM
-
2026-06-02days on market $159,000 Active 9 DOM
-
2026-06-01days on market $159,000 Active 8 DOM
-
2026-05-31days on market $159,000 Active 7 DOM
-
2026-05-31days on market $159,000 Active 6 DOM
-
2026-05-01status Pending
-
2026-04-27$159,000 Active
-
2005-01-04soldstatus $65,000
ⓘ Source: listings_history table (triggers on properties + properties_extension) + one-shot
backfill from property_details.listing_events for pre-trigger history.
Tax reassessment forecast NY · Partial reset (capped growth)
- Current annual tax
- $2,682 · $223/mo
- Projected year-2 tax
- $2,685 · $224/mo
- Expected delta
- +$3/yr ($0/mo · 0.1%)
ⓘ Screening estimate from a state-policy table — verify with the county assessor before closing.
Climate risk First Street
- Flood 1/10 Low FEMA zone X (unshaded) · 0% chance over 30 yrs
- Wildfire 3/10 Moderate
- Heat 2/10 Low 8 d/yr ≥90°F today · 18 d/yr by 30 yrs out
- Wind 2/10 Low 100% chance of damaging wind over 30 yrs
- Air quality 1/10 Low 0 unhealthy d/yr today · 0 by 30 yrs out
Nearby sold comps map
Loading sold comps map…
Walkable amenities ~0.75 mi
Loading nearby amenities…
Taxation est. · year 1
- Rental income
- $22,190
- − Mortgage interest
- −$8,906
- − Property taxes
- −$2,682
- − Insurance
- −$795
- − Repairs & maintenance
- −$1,775
- − Management
- −$1,775
- − Depreciation
- −$4,625
- Taxable income
- $1,631
- Est. tax owed @ 24.0%
- −$391
- After-tax cash flow
- $3,656/yr
For passive investors: Depreciation is non-cash, so a rental often shows a tax loss while cash-flowing — sheltering income. Rental losses are passive: they offset passive income freely, and up to $25,000/yr can offset ordinary (W-2) income if you actively participate and your MAGI is under $100k (phasing out to $0 by $150k); unused losses carry forward. On sale, claimed depreciation is recaptured at up to 25%, and gains may owe capital-gains tax (a 1031 exchange can defer both). Figures are a year-1 estimate at your 24.0% rate — not tax advice; consult a CPA.
Schools (NCES district)
- District
- Franklin Central School District
- NCES district ID
- 3611430
- Math proficiency
- 35% ▼ -5.00%
- Reading proficiency
- 40% ▼ -5.00%
- Median HH income
- $51,231
- Composite
- 35.06/100
- National rank
- #9920
- State rank
- #664 of 755 in NY
Livability — Oneonta
- Score
- 75/100
- State rank
- #253
- US rank
- #4021
Category grades
Schools grade is shown separately in the Schools card above.
Census & demographics
- County
- Otsego County · 23,056 people
- City population
- 23,056
- Metro
- Oneonta, NY
- Population (ZIP)
- 23,056
- Household income
- $65,953
- Rent vs Own
- Severe rent burden
- 662.0
Population outlook (Delaware County) Hauer SSP2
- Today (2025)
- 42,668 people
- By 2030
- 40,337 · -5.5%
- By 2040
- 35,514 · -16.8%
- By 2050
- 31,265 · -26.7%
- By 2075
- 24,455 · -42.7%
- By 2100
- 19,529 · -54.2%
Race, ethnicity, and origin ACS 2023
- Neighborhood character
- Predominantly White (84%)
- Race & ethnicity
- White 84% Hispanic / Latino 6% Black 5% Two or more races 5% Asian 2%
- Hispanic origin (detail)
- Puerto Rican 2%
- Common ancestry
- Romanian 4% Slovak 2% Lithuanian 2%
- Foreign-born
- 5% · Canada, China
- Languages at home
- 94% English-only · Spanish 3% Russian/Polish/Slavic 1% Other Indo-European 1%
Political lean MEDSL · Delaware
- 2024 margin
- R (+19.8) · D 40.1% · R 59.9%
- 2008→2024 swing
- -14.6pp toward R · 2008: -5.2pp · 2024: -19.8pp
- All cycles
- 2024: R+19.8 2020: R+18.4 2016: R+29.2 2012: R+9.6 2008: R+5.2
Not yet ingested
- Civics
- —
Market trends
- HPI YoY
- ▲ 67.86%
- Current HPI
- 366.3391
- Rent YoY
- —
- Metro
- Oneonta, NY
- State GDP YoY
- ▲ 2.60%
- F500 in state
- 92
Industry mix (Fortune 500 HQ in NY)
| Industry | F500 HQs | Revenue |
|---|---|---|
| Financial Services | 10 | $950B |
|
||
| Consumer Goods | 9 | $162B |
|
||
| Insurance | 4 | $225B |
|
||
| Telecommunications | 2 | $144B |
|
||
| Pharmaceuticals | 2 | $112B |
|
||
| Media / Entertainment | 2 | $69B |
|
||
Price history
+144.6% since first listed3 events — show timeline
- 2026-05-01 Pending — UNYREIS
- 2026-04-27 Listed $159,000 UNYREIS
- 2005-01-04 Sold (Public Records) $65,000 Public Records
Property tax history
+3.1%/yrLatest (2025): $2,682 · +3.3% YoY. Source: county tax records.
Cash-flow waterfall
monthlySold comps — $/sqft
last 12 mo · ≤1 miLoading sold comps…