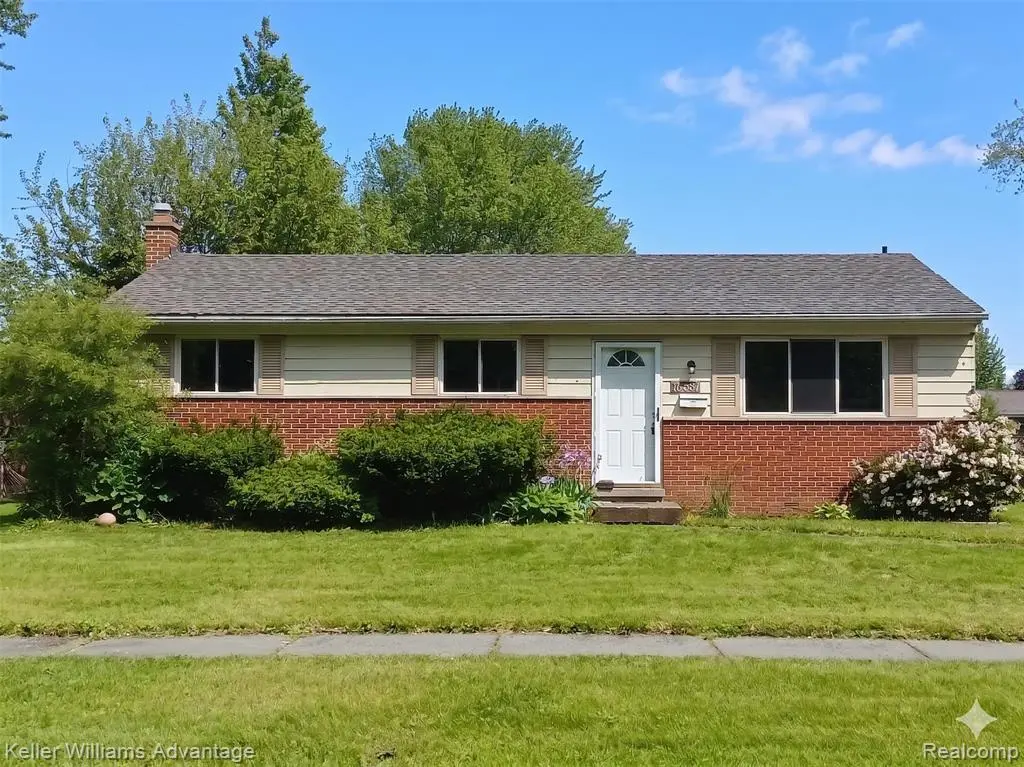
15587 Oakbrook St · Romulus, MI
Flood risk 1/10 · Minimal
- FEMA flood zone
- X (unshaded)
- Chance of flooding over 30 yrs
- 0.0%
- Est. flood insurance / yr
- $473 – $860
Fire risk 2/10 · Minimal
- Est. fire insurance / yr
- $784 – $1,456
Heat risk 3/10 · Minor
- Hot days now (above 97°F)
- 7 days/yr
- Hot days in 30 yrs
- 15 days/yr
Wind risk 2/10 · Minimal
- Chance of severe wind over 30 yrs
- —
Air-quality risk 2/10 · Minimal
- Unhealthy air days now
- 1 days/yr
- Unhealthy air days in 30 yrs
- 3 days/yr
Risk factors via First Street. Map © Google.
Why this score? — see what drove the C grade
The composite is a weighted blend of 9 inputs, each scored 0–100. Each bar is that input's sub-score; the figure is the points it added to the 100-point composite (weight × sub-score).
- Cash flow +22.9/30.0
- ARV discount +14.1/15.0
- DSCR +7.3/10.0
- 1% rule +5.9/10.0
- Livability +3.0/5.0
- Rent growth +2.5/5.0
- Condition / age +2.5/5.0
- Schools +1.3/10.0
- Appreciation +0.0/10.0
$140,000
🖨 Deal sheet 📄 Offer letter ✓ Due diligence
Listing remarks MLS
Welcome to 15587 Oakbrook Street in Romulus - a solid brick ranch in a prime location with convenient access to everything Metro Detroit has to offer. Built in 1968, this classic mid-century ranch features 3 bedrooms, 1.5 bathrooms, a functional single-level layout, a full basement, and a spacious backyard ideal for entertaining, pets, gardening, or future outdoor improvements. Major mechanical updates have already been addressed with a newer roof, furnace, and hot water tank, giving buyers confidence and reducing immediate capital expenses. Whether you're a first-time homebuyer looking to build equity, an owner-occupant seeking an affordable home that is well positioned for thoughtful updates and improvements, or an investor searching for your next rental, fix-and-flip, or buy-and-hold property, this home checks all the boxes. The property has strong long-term rental potential in a neighborhood with strong rental demand thanks to its desirable and strategic location near major employment and transportation corridors. Minutes from Detroit Metro Airport (DTW), I-275, I-94, Telegraph Road (US-24), shopping, dining, parks, and everyday conveniences. This home has solid bones, key mechanical updates, and strong investment potential. Whether you're looking for your next home or your next addition to your real estate portfolio, this property is worth seeing. Schedule your private showing today.
Key facts
- Spacious backyard
- Newer furnace
- Newer roof
Tags
Property features AI
Finance
- Other: Located in the Oakbrook subdivision; Directions: From Eureka, go south on Brandt St. to Dorset St., then west on Dorset St. to Oakbrook St. Go south on Oakbrook St.; home is on the left about 1 block down.
Exterior
- Parking: No garage
- Utilities: Public water; Public sewer
- Home design: Single-family residence; One level; Ground-level entry with steps
- Construction: Brick and wood siding construction
- Exterior features: Paved road access; Lot approximately 0.17 acres (60 x 125); No pool
Interior
- Bathrooms: 1 full bathroom; 1 half bathroom
- Heating & cooling: Central air conditioning; Forced air heating (natural gas)
- Interior features: Unfurnished; Unfinished basement
- Laundry & utility: Washer hookup; Gas dryer hookup; Washer and dryer included; Gas water heater
Neighborhood map
What this means for you Summary
Snapshot
- This is a 3-bed/1.5-bath single-family listed at $140k.
Deal economics
- At list price, monthly cash flow is $245 ($3k/yr) — positive.
- The deal already cash-flows at list — no discount required.
- Meets the 1% rule at list price ($2k rent vs $140k).
- Recommended offer: $138k (1.5% below list) — sets the bar for market timing.
- Cap rate 8.4% vs local median 4.2% in Romulus — top-decile yield for the area; either an underpriced asset or a hidden risk that comps aren't pricing in. Stress-test before assuming the spread holds.
Location & tenants
- Location reads 60/100 on livability (#593 in MI) — a middle-class / working-renter tenant base. Strengths: cost of living A+, housing A+; Watch: commute D+, schools F, crime F.
- Romulus Community Schools (suburban): math 9% / reading 21% proficiency, ranked #498 of 540 in MI (top 92%) — low school quality limits family demand, transient renter base, plan for 1-2y turnover; 69% free/reduced lunch — lower-income household profile, screen leases tightly.
- Market conditions: 215 active listings in the ZIP; 2,639 units permitted in Wayne County in 2024 (1,216 in 5+ unit buildings).
Forward outlook
- Local home prices are declining (-3.0%/yr); year-one equity from $968 of loan paydown is wiped out by about $4k of value loss. Plan a longer hold.
- Wayne County population projected at -17% by 2050 — secular population decline; favor cash flow + early exit over multi-decade hold.
Negotiation context
- It's been on market 26 days — a 2% lower offer ($138k) is reasonable based on typical stale-listing flexibility.
- 21 sale attempts since 30y ago with the ask held roughly flat each time — persistent listings suggest the price (not the market) is what's stuck; bring a comps-based counter.
- Current owner paid $975; list at $140k implies a 14259% gain — meaningful room to come down on a strong offer.
Questions for the listing agent
- Built in 1968 — when were the roof, HVAC, electrical panel, plumbing, and water heater last replaced?
- Is there a deadline driving the sale (1031 exchange, divorce, estate, relocation)? That informs how much negotiation room exists.
- Schools are F-rated, which usually means shorter tenancies and higher turnover. Who's the typical renter profile here, and what's been the actual vacancy rate?
- Crime grade is F in this area — have there been break-ins, vandalism, or insurance claims at this property in the last 3 years? What carrier currently insures it and at what premium?
- What's the average days-on-market for RENTAL listings here right now (not sales)? A rising rental-DOM trend means longer vacancies and softer asking-rent achievability than the comps imply.
- What's the recent tenant-quality profile in this submarket — average credit score on applications, eviction rate, late-payment / NSF rate, and stable-employment percentage? A property-management company in the area should have these aggregated.
- How much new for-sale + rental construction is in the pipeline within 1–3 miles? Heavy new supply typically softens prices + rents 12–24 months out; constrained supply supports both.
Investment metrics
- 1% rule
- 1.09% ✓
- Cap rate
- 8.40%
- Cash-on-cash
- 7.51%
- DSCR
- 1.33
- GRM
- 7.7
CMA / ARV
- ARV (on-the-fly)
- $164,160
- Comps found
- 12
Show comp detail 12 sales within ~0.75 mi
| Address | Dist | Beds/Ba | Sqft | Sold | Price | $/sf | Match |
|---|---|---|---|---|---|---|---|
| 30771 Halecreek St | 0.20mi | 3/1.0 | 960 (0%) | 3mo | $135,000 | $141 | 86 |
| 30570 Leroy St | 0.18mi | 3/1.0 | 960 (0%) | 8mo | $199,500 | $208 | 83 |
| 15700 Oakbrook St | 0.03mi | 3/1.5 | 1,050 (+9%) | 4mo | $180,000 | $171 | 80 |
| 15447 Anthony St | 0.15mi | 3/1.0 | 1,032 (+8%) | 4mo | $195,000 | $189 | 76 |
| 16223 Oakbrook St | 0.29mi | 3/1.5 | 960 (0%) | 15mo | $192,000 | $200 | 74 |
| 30431 Cherry Ave | 0.19mi | 3/1.0 | 1,006 (+5%) | 8mo | $175,000 | $174 | 74 |
| 15521 Brandt St | 0.08mi | 3/1.5 | 1,100 (+15%) | 2mo | $187,900 | $171 | 70 |
| 29934 Spain St | 0.33mi | 3/2.0 | 1,032 (+8%) | 2mo | $150,000 | $145 | 69 |
| 15447 Taft St | 0.10mi | 3/1.0 | 1,056 (+10%) | 10mo | $152,500 | $144 | 68 |
| 16010 Hollywood St | 0.48mi | 3/1.5 | 984 (+2%) | 13mo | $152,500 | $155 | 62 |
| 16404 Brandt St | 0.36mi | 3/1.0 | 1,026 (+7%) | 10mo | $215,000 | $210 | 62 |
| 16365 Farnum St | 0.67mi | 2/1.0 (-1) | 852 (-11%) | 19mo | $137,000 | $161 | 27 |
Match score weights: distance 35% · size 25% · config 20% · recency 20%. Top-matched comps best support the ARV.
Projected returns pro-forma
-3.0% appreciation · 3.0% rent growth · sell at horizon
- IRR
- -4.8%
- Equity multiple
- 0.82×
- Total profit
- $-7,042
- Equity at exit
- $20,874
- IRR
- 4.9%
- Equity multiple
- 1.36×
- Total profit
- $14,057
- Equity at exit
- $12,105
Cash invested: $39,200 (down + closing). Projections, not guarantees.
Landlord ↔ Tenant lean methodology
- Overall (STATE)
- 62 Landlord-Friendly
- State Michigan
- 62 Landlord-Friendly · EVEN
- County
- — inherits STATE
- City
- — inherits STATE
ZIP-level market 48174
- Active inventory
- 215
- Price-to-rent
- 7.7×
Monthly cashflow live
- Estimated rent
- $1,521 medium interval (Pro) →
- Mortgage (P&I)
- −$734
- Tax from tax record
- −$163 /mo · $1,961/yr
- Insurance
- −$58
- HOA
- −$0
- Vacancy / Maint / Mgmt
- −$319
- Net cashflow
- $245
Break-even live
UW: 25.0% down · 7.5% · 30yr · 1.5% tax · 5.0% vac · 8.0% maint · 8.0% mgmt
Financing live
Cash to close
- Down payment
- $35,000
- Closing costs
- $4,200
- Reserves months
- —
- Total cash needed
- —
Loan-product check · same deal, 3 products live
Conventional
25% down · 7.5% · 30yr
- Down + closing
- —
- Monthly P&I
- —
- Monthly cashflow
- —
- DSCR
- —
- Eligible?
- —
Personal DTI + credit; lowest rate.
DSCR
20% down · 8.5% · 30yr
- Down + closing
- —
- Monthly P&I
- —
- Monthly cashflow
- —
- DSCR
- —
- Eligible?
- —
No personal income docs; deal must DSCR.
Hard money
10% down · 12.0% · 12mo
- Down + closing
- —
- Monthly P&I
- —
- Monthly cashflow
- —
- DSCR
- —
- Eligible?
- —
Short-term bridge; refi at stabilization.
Listing history 50 events
-
2026-06-18days on market $140,000 Active 26 DOM
-
2026-06-17days on market $140,000 Active 25 DOM
-
2026-06-16days on market $140,000 Active 24 DOM
-
2026-06-15days on market $140,000 Active 23 DOM
-
2026-06-13days on market $140,000 Active 21 DOM
-
2026-06-13days on market $140,000 Active 20 DOM
-
2026-06-09days on market $140,000 Active 17 DOM
-
2026-06-08days on market $140,000 Active 16 DOM
-
2026-06-07days on market $140,000 Active 15 DOM
-
2026-06-04days on market $140,000 Active 12 DOM
-
2026-06-03days on market $140,000 Active 11 DOM
-
2026-06-02days on market $140,000 Active 10 DOM
-
2026-06-01days on market $140,000 Active 9 DOM
-
2026-05-31days on market $140,000 Active 8 DOM
-
2026-05-23$140,000 Active 1411-char remark
Show marketing remark (1411 chars)
Welcome to 15587 Oakbrook Street in Romulus - a solid brick ranch in a prime location with convenient access to everything Metro Detroit has to offer. Built in 1968, this classic mid-century ranch features 3 bedrooms, 1.5 bathrooms, a functional single-level layout, a full basement, and a spacious backyard ideal for entertaining, pets, gardening, or future outdoor improvements. Major mechanical updates have already been addressed with a newer roof, furnace, and hot water tank, giving buyers confidence and reducing immediate capital expenses. Whether you're a first-time homebuyer looking to build equity, an owner-occupant seeking an affordable home that is well positioned for thoughtful updates and improvements, or an investor searching for your next rental, fix-and-flip, or buy-and-hold property, this home checks all the boxes. The property has strong long-term rental potential in a neighborhood with strong rental demand thanks to its desirable and strategic location near major employment and transportation corridors. Minutes from Detroit Metro Airport (DTW), I-275, I-94, Telegraph Road (US-24), shopping, dining, parks, and everyday conveniences. This home has solid bones, key mechanical updates, and strong investment potential. Whether you're looking for your next home or your next addition to your real estate portfolio, this property is worth seeing. Schedule your private showing today.
-
2026-05-23$140,000 Active
Show marketing remark (1411 chars)
Welcome to 15587 Oakbrook Street in Romulus - a solid brick ranch in a prime location with convenient access to everything Metro Detroit has to offer. Built in 1968, this classic mid-century ranch features 3 bedrooms, 1.5 bathrooms, a functional single-level layout, a full basement, and a spacious backyard ideal for entertaining, pets, gardening, or future outdoor improvements. Major mechanical updates have already been addressed with a newer roof, furnace, and hot water tank, giving buyers confidence and reducing immediate capital expenses. Whether you're a first-time homebuyer looking to build equity, an owner-occupant seeking an affordable home that is well positioned for thoughtful updates and improvements, or an investor searching for your next rental, fix-and-flip, or buy-and-hold property, this home checks all the boxes. The property has strong long-term rental potential in a neighborhood with strong rental demand thanks to its desirable and strategic location near major employment and transportation corridors. Minutes from Detroit Metro Airport (DTW), I-275, I-94, Telegraph Road (US-24), shopping, dining, parks, and everyday conveniences. This home has solid bones, key mechanical updates, and strong investment potential. Whether you're looking for your next home or your next addition to your real estate portfolio, this property is worth seeing. Schedule your private showing today.
-
2026-02-10historical
-
2026-02-10historical
-
2026-02-03price $149,990
-
2026-02-03price $149,990
-
2026-01-15price $154,990
-
2026-01-14price $154,990
-
2025-12-30price $164,990
-
2025-12-29price $164,990
-
2025-12-19price $174,990
-
2025-12-19price $174,990
-
2025-12-13price $179,990
-
2025-12-12price $179,990
-
2025-12-07$184,990 Active
-
2025-12-07$184,990 Active
-
2015-02-03soldstatus $975
-
2015-01-08soldstatus $45,000
-
2014-12-22$950
-
2014-12-05soldstatus $45,000
-
2014-12-05soldstatus $45,000
-
2014-10-23historical
-
2014-10-16$45,000
-
2014-10-16$45,000
-
2009-03-03historical
-
2008-09-03$70,000
-
2008-04-27historical
-
2008-04-27historical
-
2008-02-20historical
-
2007-11-07$109,900
-
2007-11-07$109,900
-
2007-10-27historical
-
2007-10-27historical
-
2007-04-27$99,900
-
2007-04-27$109,900
-
2007-04-27$114,900
ⓘ Source: listings_history table (triggers on properties + properties_extension) + one-shot
backfill from property_details.listing_events for pre-trigger history.
Tax reassessment forecast MI · Partial reset (capped growth)
- Current annual tax
- $1,961 · $163/mo
- Projected year-2 tax
- $2,058 · $172/mo
- Expected delta
- +$98/yr (+$8/mo · 5.0%)
ⓘ Screening estimate from a state-policy table — verify with the county assessor before closing.
Climate risk First Street
- Flood 1/10 Low FEMA zone X (unshaded) · 0% chance over 30 yrs
- Wildfire 2/10 Low
- Heat 3/10 Moderate 7 d/yr ≥97°F today · 15 d/yr by 30 yrs out
- Wind 2/10 Low
- Air quality 2/10 Low 1 unhealthy d/yr today · 3 by 30 yrs out
Nearby sold comps map
Loading sold comps map…
Walkable amenities ~0.75 mi
Loading nearby amenities…
Taxation est. · year 1
- Rental income
- $18,247
- − Mortgage interest
- −$7,842
- − Property taxes
- −$1,961
- − Insurance
- −$700
- − Repairs & maintenance
- −$1,460
- − Management
- −$1,460
- − Depreciation
- −$4,073
- Taxable income
- $752
- Est. tax owed @ 24.0%
- −$181
- After-tax cash flow
- $2,764/yr
For passive investors: Depreciation is non-cash, so a rental often shows a tax loss while cash-flowing — sheltering income. Rental losses are passive: they offset passive income freely, and up to $25,000/yr can offset ordinary (W-2) income if you actively participate and your MAGI is under $100k (phasing out to $0 by $150k); unused losses carry forward. On sale, claimed depreciation is recaptured at up to 25%, and gains may owe capital-gains tax (a 1031 exchange can defer both). Figures are a year-1 estimate at your 24.0% rate — not tax advice; consult a CPA.
Schools (NCES district)
- District
- Romulus Community Schools
- NCES district ID
- 2630120
- Math proficiency
- 9% ▼ -14.00%
- Reading proficiency
- 21% ▼ -9.00%
- Median HH income
- $44,165
- Composite
- 13.17/100
- National rank
- #9556
- State rank
- #498 of 540 in MI
Livability — Romulus
- Score
- 60/100
- State rank
- #593
- US rank
- #19387
Category grades
Schools grade is shown separately in the Schools card above.
Census & demographics
- Census place
- Romulus, MI
- County
- Wayne County · 1,562,939 people
- City population
- 32,211
- Metro
- Detroit-Warren-Dearborn, MI
- Population (ZIP)
- 32,211
- Household income
- $67,056
- Rent vs Own
- Severe rent burden
- 755.0
Population outlook (Wayne County) Hauer SSP2
- Today (2025)
- 1,675,273 people
- By 2030
- 1,620,300 · -3.3%
- By 2040
- 1,502,341 · -10.3%
- By 2050
- 1,384,039 · -17.4%
- By 2075
- 1,124,592 · -32.9%
- By 2100
- 881,193 · -47.4%
Race, ethnicity, and origin ACS 2023
- Neighborhood character
- Diverse neighborhood (Simpson 0.59)
- Race & ethnicity
- White 52% Black 37% Two or more races 8% Hispanic / Latino 2% Asian 1%
- Common ancestry
- Romanian 6% Lithuanian 3% Italian 2%
- Foreign-born
- 4% · Canada, Vietnam
- Languages at home
- 94% English-only · Spanish 2% Other Indo-European 1% Other Asian/Pacific 1%
Political lean MEDSL · Wayne
- 2024 margin
- Strong D (+29.0) · D 62.7% · R 33.7% · Other 3.6%
- 2008→2024 swing
- -20.5pp toward R · 2008: 49.5pp · 2024: 29.0pp
- All cycles
- 2024: D+29.0 2020: D+38.1 2016: D+37.3 2012: D+46.9 2008: D+49.5
Not yet ingested
- Civics
- —
Market trends
- HPI YoY
- ▼ -171.93%
- Current HPI
- 207.8345
- Rent YoY
- —
- Metro
- Detroit-Warren-Dearborn, MI
- State GDP YoY
- ▲ 1.37%
- F500 in state
- 28
Industry mix (Fortune 500 HQ in MI)
| Industry | F500 HQs | Revenue |
|---|---|---|
| Automotive Parts | 3 | $48B |
|
||
| Automotive | 2 | $372B |
|
||
| Chemicals | 1 | $45B |
|
||
| Automotive Retail | 1 | $29B |
|
||
| Healthcare / Medical Devices | 1 | $23B |
|
||
| Automotive Technology | 1 | $20B |
|
||
Price history
+191.7% since first listed54 events — show timeline
- 2026-05-23 Listed $140,000 REALCOMP
- 2026-05-23 Listed $140,000 MiRealSource-MiMLS
- 2026-02-10 Listing Removed — REALCOMP
- 2026-02-10 Listing Removed — MiRealSource-MiMLS
- 2026-02-03 Price Changed $149,990 MiRealSource-MiMLS
- 2026-02-03 Price Changed $149,990 REALCOMP
- 2026-01-15 Price Changed $154,990 MiRealSource-MiMLS
- 2026-01-14 Price Changed $154,990 REALCOMP
- 2025-12-30 Price Changed $164,990 MiRealSource-MiMLS
- 2025-12-29 Price Changed $164,990 REALCOMP
- 2025-12-19 Price Changed $174,990 MiRealSource-MiMLS
- 2025-12-19 Price Changed $174,990 REALCOMP
- 2025-12-13 Price Changed $179,990 MiRealSource-MiMLS
- 2025-12-12 Price Changed $179,990 REALCOMP
- 2025-12-07 Listed $184,990 REALCOMP
- 2025-12-07 Listed $184,990 MiRealSource-MiMLS
- 2015-02-03 Sold (MLS) $975 MiRealSource-MiMLS
- 2015-01-08 Sold (Public Records) $45,000 Public Records
- 2014-12-22 Listed $950 MiRealSource-MiMLS
- 2014-12-05 Sold (MLS) $45,000 MiRealSource-MiMLS
- 2014-12-05 Sold (MLS) $45,000 REALCOMP
- 2014-10-23 Listing Removed — MiRealSource-MiMLS
- 2014-10-16 Listed $45,000 MiRealSource-MiMLS
- 2014-10-16 Listed $45,000 REALCOMP
- 2009-03-03 Listing Removed — REALCOMP
- 2008-09-03 Listed $70,000 REALCOMP
- 2008-04-27 Listing Removed — MiRealSource-MiMLS
- 2008-04-27 Listing Removed — MiRealSource-MiMLS
- 2008-02-20 Listing Removed — REALCOMP
- 2007-11-07 Listed $109,900 REALCOMP
- 2007-11-07 Listed $109,900 MiRealSource-MiMLS
- 2007-10-27 Listing Removed — MiRealSource-MiMLS
- 2007-10-27 Listing Removed — REALCOMP
- 2007-04-27 Listed $99,900 REALCOMP
- 2007-04-27 Listed $114,900 MiRealSource-MiMLS
- 2007-04-27 Listed $109,900 REALCOMP
- 2007-04-27 Listed $99,900 MiRealSource-MiMLS
- 2005-08-17 Sold (MLS) $105,000 REALCOMP
- 2005-08-17 Sold (MLS) $105,000 MiRealSource-MiMLS
- 2005-08-17 Sold (MLS) $105,000 MiRealSource-MiMLS
- 2005-07-25 Listing Removed — MiRealSource-MiMLS
- 2005-07-22 Listing Removed — MiRealSource-MiMLS
- 2005-03-28 Listing Removed — MiRealSource-MiMLS
- 2005-03-08 Listed $111,900 REALCOMP
- 2005-03-08 Listed $111,900 MiRealSource-MiMLS
- 2005-03-08 Listed $111,900 MiRealSource-MiMLS
- 2004-12-29 Listed $87,900 REALCOMP
- 2004-12-29 Listed $87,900 MiRealSource-MiMLS
- 2002-09-29 Listing Removed — REALCOMP
- 2002-03-29 Listed $100,000 REALCOMP
- 1997-04-22 Sold (Public Records) $64,000 Public Records
- 1997-01-31 Sold (MLS) $64,000 REALCOMP
- 1996-10-24 Listed $64,900 REALCOMP
- 1991-11-22 Sold (Public Records) $48,000 Public Records
Property tax history
+4.2%/yrLatest (2025): $1,961 · -42.0% YoY. Source: county tax records.
Cash-flow waterfall
monthlySold comps — $/sqft
last 12 mo · ≤1 miLoading sold comps…