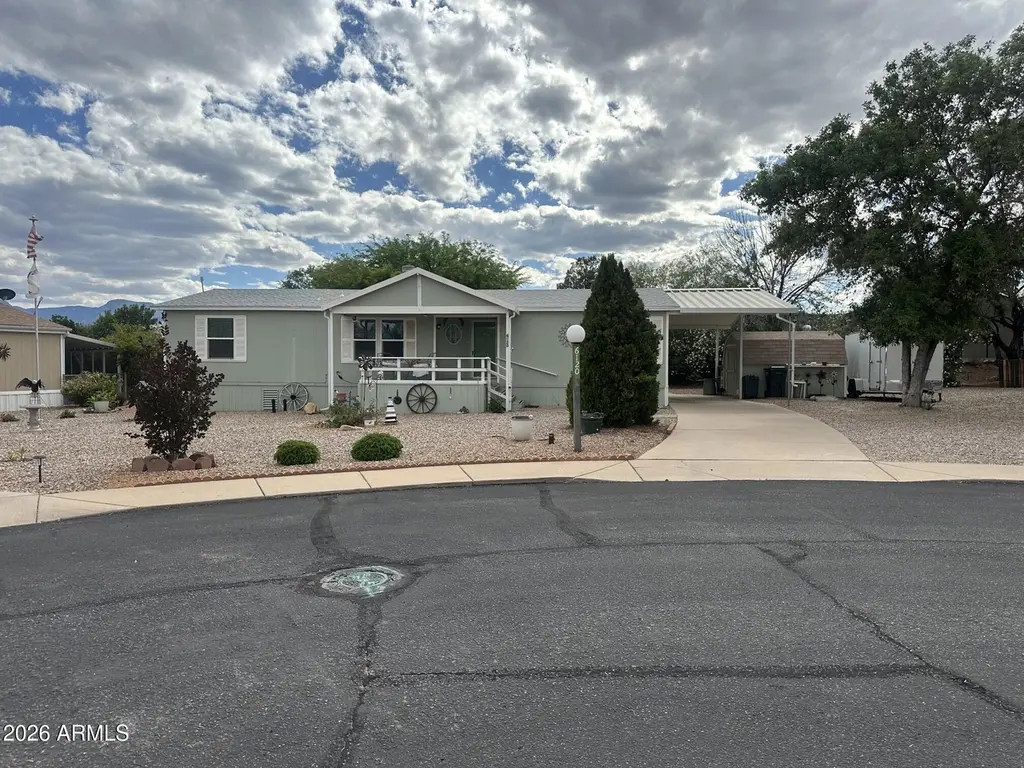
6120 E Desert Grass Cir · Sierra Vista, AZ
Flood risk 5/10 · Moderate
- FEMA flood zone
- X (unshaded)
- Chance of flooding over 30 yrs
- 0.48%
- Est. flood insurance / yr
- $507 – $1,088
Fire risk 7/10 · Major
- Est. fire insurance / yr
- $610 – $1,132
Heat risk 6/10 · Moderate
- Hot days now (above 98°F)
- 7 days/yr
- Hot days in 30 yrs
- 19 days/yr
Wind risk 1/10 · Minimal
- Chance of severe wind over 30 yrs
- —
Air-quality risk 1/10 · Minimal
- Unhealthy air days now
- 0 days/yr
- Unhealthy air days in 30 yrs
- 0 days/yr
Risk factors via First Street. Map © Google.
Why this score? — see what drove the C+ grade
The composite is a weighted blend of 9 inputs, each scored 0–100. Each bar is that input's sub-score; the figure is the points it added to the 100-point composite (weight × sub-score).
- Cash flow +30.0/30.0
- 1% rule +10.0/10.0
- DSCR +10.0/10.0
- Livability +4.0/5.0
- Condition / age +3.8/5.0
- Schools +2.9/10.0
- Rent growth +2.5/5.0
- ARV discount +0.0/15.0
- Appreciation +0.0/10.0
$125,000
🖨 Deal sheet 📄 Offer letter ✓ Due diligence
Listing remarks
This charming 3 bedroom, 2 bath home in a gated community is a must see! Featuring a desirable split floor plan, this home offers both comfort and privacy. The spacious kitchen opens to a large living room complete with a cozy fireplace- perfect for relaxing or entertaining. The beautifully remodeled main bathroom includes double sinks and a modern walk-in shower for a spa like feel. Step outside and enjoy the peaceful surroundings from both the front and back porches, creating the perfect space for morning coffee or evening sunsets. Don't miss the opportunity to make this inviting home yours!
Key facts
- Gated community
- Split floor plan
- Spacious kitchen
Tags
Property features AI
Finance
- HOA & community: Land lease community (monthly land lease $541); Community pool; Association covers electricity, sewer, trash and water
Exterior
- Parking: 4 open parking spaces; 1 covered space; 1 carport space
- Utilities: Private water company; Public sewer; Other utilities
- Home design: Manufactured/mobile home; Fee simple ownership
- Construction: Vertical siding; Wood frame construction; Composition roof
- Exterior features: Desert front and back landscaping; Chain link fencing; Heated spa
Interior
- Kitchen: Refrigerator; Dishwasher
- Bedrooms: 3 bedrooms (possible)
- Bathrooms: 2 full bathrooms
- Heating & cooling: Heat pump heating; Central air conditioning
- Interior features: Double vanity; Fireplace
- Laundry & utility: Inside laundry
Neighborhood map
What this means for you Summary
Snapshot
- This is a 3-bed/2.0-bath manufactured listed at $125k. Condition is rated good.
Deal economics
- At list price, monthly cash flow is $836 ($10k/yr) — positive.
- The deal already cash-flows at list — no discount required.
- Meets the 1% rule at list price ($2k rent vs $125k).
- Recommended offer: $121k (3.0% below list) — sets the bar for market timing.
- Cap rate 14.3% vs local median 4.3% in Sierra Vista — top-decile yield for the area; either an underpriced asset or a hidden risk that comps aren't pricing in. Stress-test before assuming the spread holds.
Location & tenants
- Location reads 80/100 on livability (#5 in AZ, #1,805 nationally) — a professional / high-income tenant draw. Strengths: commute A+, housing A+, health & safety A+; Watch: amenities F.
- Sierra Vista Unified District (4175) (urban): math 27% / reading 39% proficiency, ranked #93 of 249 in AZ (top 37%) — families likely to look elsewhere, expect single-tenant / working-renter base with shorter leases.
- Zoned schools: Pueblo Del Sol Elementary School (math 32% / reading 48%, grade F, #394 of 1,109 statewide, top 36%, 383 students, 42% FRL); Joyce Clark Middle School (math 26% / reading 39%, grade F, #70 of 218 statewide, top 32%, 670 students, 46% FRL); Buena High School (math 19% / reading 29%, grade F, #202 of 381 statewide, top 54%, 1,836 students, 32% FRL) — zoned schools at 40% FRL track the district average.
- Market conditions: Rents flat; 176 active listings in the ZIP; 5 comparable units currently listed for rent nearby; rentals lingering (median 44d on market — plan ~5-8 weeks vacancy on turnover, expect pricing pressure); 100% of comp listings sitting > 30 days — soft ceiling on asking rent; 437 units permitted in Cochise County in 2024 (6 in 5+ unit buildings).
- This rent runs 42% of the median local income ($62k/yr) — at the standard rent-burdened threshold; future hikes will face affordability resistance.
Forward outlook
- Local home prices are declining (-3.0%/yr); year-one equity from $864 of loan paydown is wiped out by about $4k of value loss. Plan a longer hold.
- Cochise County population projected at -30% by 2050 — secular population decline; favor cash flow + early exit over multi-decade hold.
- At projected returns (-3.0% appreciation + 0.0% rent growth), your $35k cash investment doubles in ~5 years — after that, you're playing with house money.
Negotiation context
- It's been on market 35 days — a 3% lower offer ($121k) is reasonable based on typical stale-listing flexibility.
Risks & watch-outs
- Climate carrying-cost: moderate flood risk; major wildfire risk; extreme-heat days projected 7→19/yr by 2055 (HVAC capex compounding) — expect insurance premiums to compound above CPI over the hold.
Questions for the listing agent
- It's been on market 35 days. Have you received any prior offers? Is the seller open to a 3% concession, seller financing, or rate buy-down credit?
- Is there a deadline driving the sale (1031 exchange, divorce, estate, relocation)? That informs how much negotiation room exists.
- What's the average days-on-market for RENTAL listings here right now (not sales)? A rising rental-DOM trend means longer vacancies and softer asking-rent achievability than the comps imply.
- What's the recent tenant-quality profile in this submarket — average credit score on applications, eviction rate, late-payment / NSF rate, and stable-employment percentage? A property-management company in the area should have these aggregated.
- How much new for-sale + rental construction is in the pipeline within 1–3 miles? Heavy new supply typically softens prices + rents 12–24 months out; constrained supply supports both.
Investment metrics
- 1% rule
- 1.72% ✓
- Cap rate
- 14.32%
- Cash-on-cash
- 28.66%
- DSCR
- 2.28
- GRM
- 4.8
CMA / ARV
- ARV (median comp)
- $85,000
- List price
- $125,000
- Delta
- 47.06%
- Verdict
- OVERPRICED
- Comps
- 18 within 1.0 mi
Show comp detail 12 sales within ~0.75 mi
| Address | Dist | Beds/Ba | Sqft | Sold | Price | $/sf | Match |
|---|---|---|---|---|---|---|---|
| 708 S Shallow Brook Loop | 0.17mi | 3/2.0 | 1,568 (0%) | 12mo | $125,000 | $80 | 82 |
| 642 S Little Bear Trl | 0.22mi | 3/2.0 | 1,568 (0%) | 10mo | $125,000 | $80 | 81 |
| 225 S Knee Deep Loop #233 | 0.07mi | 3/2.0 | 1,456 (-7%) | 4mo | $162,000 | $111 | 81 |
| 615 S Shallow Brook Loop #219 | 0.21mi | 3/2.0 | 1,512 (-4%) | 6mo | $126,000 | $83 | 79 |
| 668 S Lazy Beaver Way | 0.26mi | 3/2.0 | 1,568 (0%) | 10mo | $122,000 | $78 | 79 |
| 484 S Little Bear Trl | 0.06mi | 2/2.0 (-1) | 1,674 (+7%) | 10mo | $62,500 | $37 | 72 |
| 698 S Deer Creek Ln | 0.29mi | 3/2.0 | 1,440 (-8%) | 5mo | $82,000 | $57 | 69 |
| 547 S Little Bear Trl | 0.14mi | 3/2.0 | 1,792 (+14%) | 2mo | $88,000 | $49 | 68 |
| 716 S Shallow Brook Loop | 0.33mi | 3/2.0 | 1,680 (+7%) | 12mo | $169,000 | $101 | 62 |
| 306 N Central Ave | 0.38mi | 4/2.0 (+1) | 1,440 (-8%) | 5mo | $124,000 | $86 | 60 |
| 275 S Chase St St | 0.26mi | 2/2.0 (-1) | 1,701 (+8%) | 12mo | $110,000 | $65 | 58 |
| 525 N Central Ave | 0.56mi | 4/2.0 (+1) | 1,536 (-2%) | 10mo | $174,900 | $114 | 58 |
Match score weights: distance 35% · size 25% · config 20% · recency 20%. Top-matched comps best support the ARV.
Projected returns pro-forma
-3.0% appreciation · 0.0% rent growth · sell at horizon
- IRR
- 19.5%
- Equity multiple
- 1.76×
- Total profit
- $26,705
- Equity at exit
- $18,638
- IRR
- 25.7%
- Equity multiple
- 2.93×
- Total profit
- $67,565
- Equity at exit
- $10,808
Cash invested: $35,000 (down + closing). Projections, not guarantees.
Landlord ↔ Tenant lean methodology
- Overall (STATE)
- 87 Strongly Landlord-Friendly
- State Arizona
- 87 Strongly Landlord-Friendly · R+3
- County
- — inherits STATE
- City
- — inherits STATE
ZIP-level market 85635
- Home prices YoY
- -32.3%
- Rents YoY
- 0.0%
- Active inventory
- 176
- Price-to-rent
- 4.8×
Monthly cashflow live
- Estimated rent
- $2,151 high interval (Pro) →
- Mortgage (P&I)
- −$656
- Tax est. 1.5%
- −$156 /mo · $1,875/yr
- Insurance
- −$52
- HOA
- −$0
- Vacancy / Maint / Mgmt
- −$452
- Net cashflow
- $836
Break-even live
UW: 25.0% down · 7.5% · 30yr · 1.5% tax · 5.0% vac · 8.0% maint · 8.0% mgmt
Financing live
Cash to close
- Down payment
- $31,250
- Closing costs
- $3,750
- Reserves months
- —
- Total cash needed
- —
Loan-product check · same deal, 3 products live
Conventional
25% down · 7.5% · 30yr
- Down + closing
- —
- Monthly P&I
- —
- Monthly cashflow
- —
- DSCR
- —
- Eligible?
- —
Personal DTI + credit; lowest rate.
DSCR
20% down · 8.5% · 30yr
- Down + closing
- —
- Monthly P&I
- —
- Monthly cashflow
- —
- DSCR
- —
- Eligible?
- —
No personal income docs; deal must DSCR.
Hard money
10% down · 12.0% · 12mo
- Down + closing
- —
- Monthly P&I
- —
- Monthly cashflow
- —
- DSCR
- —
- Eligible?
- —
Short-term bridge; refi at stabilization.
Rent comps 5 comps
| Address | Beds | Baths | Sqft | Rent | $/sqft | DOM | Units | Dist |
|---|---|---|---|---|---|---|---|---|
| 526 S Clubhouse Ln Sierra Vista, AZ | 2.0–3.0 | 2.0 | 1574 | $2,750 | $1.75 | 43d | 3 | 0.15mi |
| 5396 Desert Shadows Dr Sierra Vista, AZ | 4.0 | 2.0 | 1365 | $1,550 | $1.14 | 43d | 1 | 0.93mi |
| 5478 Waco Dr Sierra Vista, AZ | 3.0 | 2.0 | 1500 | $1,600 | $1.07 | 43d | 1 | 1.01mi |
| 5330 Sonora St Sierra Vista, AZ | 3.0 | 2.0 | 1330 | $1,425 | $1.07 | 43d | 1 | 1.12mi |
| 1415 Plaza Seca Sierra Vista, AZ | 3.0 | 2.0 | 1656 | $1,700 | $1.03 | 43d | 1 | 1.43mi |
Listing history 18 events
-
2026-06-19days on market $125,000 Active 35 DOM
-
2026-06-18days on market $125,000 Active 34 DOM
-
2026-06-17price $125,000 Active 33 DOM
-
2026-06-17days on market $150,000 Active 33 DOM
-
2026-06-16days on market $150,000 Active 32 DOM
-
2026-06-15days on market $150,000 Active 31 DOM
-
2026-06-14days on market $150,000 Active 29 DOM
-
2026-06-12days on market $150,000 Active 28 DOM
-
2026-06-09days on market $150,000 Active 25 DOM
-
2026-06-08days on market $150,000 Active 24 DOM
-
2026-06-07days on market $150,000 Active 23 DOM
-
2026-06-05days on market $150,000 Active 20 DOM
-
2026-06-03days on market $150,000 Active 19 DOM
-
2026-06-02days on market $150,000 Active 18 DOM
-
2026-06-01days on market $150,000 Active 17 DOM
-
2026-05-31days on market $150,000 Active 16 DOM
-
2026-05-30days on market $150,000 Active 15 DOM
-
2026-05-15$150,000 Active 603-char remark
ⓘ Source: listings_history table (triggers on properties + properties_extension) + one-shot
backfill from property_details.listing_events for pre-trigger history.
Climate risk First Street
- Flood 5/10 Major FEMA zone X (unshaded) · 48% chance over 30 yrs
- Wildfire 7/10 Severe
- Heat 6/10 Major 7 d/yr ≥98°F today · 19 d/yr by 30 yrs out
- Wind 1/10 Low
- Air quality 1/10 Low 0 unhealthy d/yr today · 0 by 30 yrs out
Nearby sold comps map
Loading sold comps map…
Walkable amenities ~0.75 mi
Loading nearby amenities…
Taxation est. · year 1
- Rental income
- $25,818
- − Mortgage interest
- −$7,002
- − Property taxes
- −$1,875
- − Insurance
- −$625
- − Repairs & maintenance
- −$2,065
- − Management
- −$2,065
- − Depreciation
- −$3,636
- Taxable income
- $8,548
- Est. tax owed @ 24.0%
- −$2,052
- After-tax cash flow
- $7,978/yr
For passive investors: Depreciation is non-cash, so a rental often shows a tax loss while cash-flowing — sheltering income. Rental losses are passive: they offset passive income freely, and up to $25,000/yr can offset ordinary (W-2) income if you actively participate and your MAGI is under $100k (phasing out to $0 by $150k); unused losses carry forward. On sale, claimed depreciation is recaptured at up to 25%, and gains may owe capital-gains tax (a 1031 exchange can defer both). Figures are a year-1 estimate at your 24.0% rate — not tax advice; consult a CPA.
Condition & rehab AI · 17 photos
This charming 3-bedroom home in a gated community is in good condition with minor cosmetic updates needed. It offers a split floor plan, a cozy fireplace, and a peaceful outdoor space, making it a great investment opportunity.
Repairs flagged
- Minor kitchen cabinets — Worn appearance
- Minor kitchen countertops — Need cleaning
Value-add opportunities
- Both Paint interior walls — Fresh paint enhances curb appeal and interior aesthetics
- Both Replace kitchen cabinets — Fresh cabinets improve functionality and aesthetics
- Both Replace kitchen countertops — New countertops enhance functionality and aesthetics
Renovation cost estimate screening
| Repair item | Severity | Est. cost |
|---|---|---|
| kitchen cabinets · Worn appearance | Minor | $500–3,000 |
| kitchen countertops · Need cleaning | Minor | $500–3,000 |
| Total estimated repair cost · 2 items | $1,000–6,000 |
Value-add ROI direction
- Both Paint interior walls — Fresh paint enhances curb appeal and interior aesthetics ↑
- Both Replace kitchen cabinets — Fresh cabinets improve functionality and aesthetics ↑
- Both Replace kitchen countertops — New countertops enhance functionality and aesthetics ↑
ⓘ Cost ranges are severity-bucket heuristics (US national rule-of-thumb). Get contractor quotes + a written scope before underwriting a rehab budget.
Schools (NCES district)
- District
- Sierra Vista Unified District (4175)
- NCES district ID
- 0401460
- Math proficiency
- 27% ▼ -19.00%
- Reading proficiency
- 39% ▼ -10.00%
- Median HH income
- $55,463
- Composite
- 29.17/100
- National rank
- #6573
- State rank
- #93 of 249 in AZ
Livability — Sierra Vista
- Score
- 80/100
- State rank
- #5
- US rank
- #1805
Category grades
Schools grade is shown separately in the Schools card above.
Census & demographics
- Census place
- Sierra Vista, AZ
- County
- Cochise County · 49,069 people
- City population
- 49,069
- Metro
- Sierra Vista-Douglas, AZ
- Population (ZIP)
- 34,193
- Household income
- $61,580
- Rent vs Own
- Severe rent burden
- 1129.0
Population outlook (Cochise County) Hauer SSP2
- Today (2025)
- 113,402 people
- By 2030
- 106,197 · -6.4%
- By 2040
- 92,166 · -18.7%
- By 2050
- 79,805 · -29.6%
- By 2075
- 56,831 · -49.9%
- By 2100
- 35,103 · -69.0%
Race, ethnicity, and origin ACS 2023
- Neighborhood character
- Diverse neighborhood (Simpson 0.60)
- Race & ethnicity
- White 58% Hispanic / Latino 25% Two or more races 17% Black 6% Asian 4%
- Hispanic origin (detail)
- Mexican 19% Puerto Rican 1%
- Common ancestry
- Romanian 3% Lithuanian 3% Italian 2%
- Foreign-born
- 11% · Canada, South Korea
- Languages at home
- 80% English-only · Spanish 14% Korean 2% German/W. Germanic 1%
Political lean MEDSL · Cochise
- 2024 margin
- Strong R (+23.1) · D 37.8% · R 61.0% · Other 1.2%
- 2008→2024 swing
- -2.5pp toward R · 2008: -20.7pp · 2024: -23.1pp
- All cycles
- 2024: R+23.1 2020: R+19.6 2016: R+22.6 2012: R+24.0 2008: R+20.7
Not yet ingested
- Civics
- —
Market trends
- HPI YoY
- ▼ -83.93%
- Current HPI
- 175.5821
- Rent YoY
- ▬ 0.00%
- Metro
- Sierra Vista-Douglas, AZ
- State GDP YoY
- ▲ 4.54%
- F500 in state
- 20
Industry mix (Fortune 500 HQ in AZ)
| Industry | F500 HQs | Revenue |
|---|---|---|
| Technology | 2 | $13B |
|
||
| Mining / Metals | 1 | $23B |
|
||
| Environmental Services | 1 | $16B |
|
||
| Metals / Steel | 1 | $14B |
|
||
| Technology Distribution | 1 | $9B |
|
||
| Homebuilding | 1 | $8B |
|
||
Price history
-16.7% since first listed2 events — show timeline
- 2026-06-17 Price Changed $125,000 ARMLS
- 2026-05-15 Listed $150,000 ARMLS
Cash-flow waterfall
monthlySold comps — $/sqft
last 12 mo · ≤1 miLoading sold comps…