 Multi-family
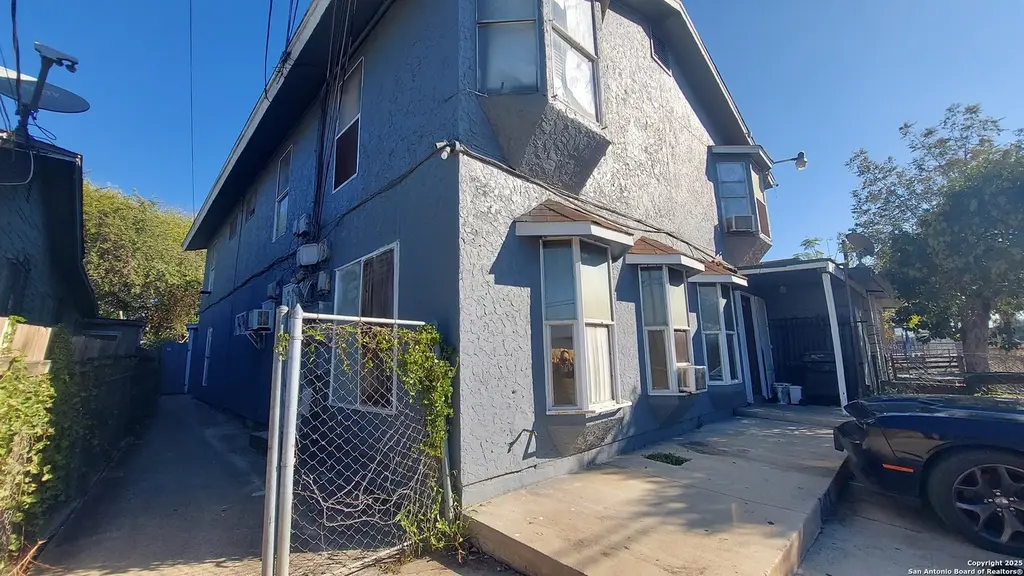
119 Bank · San Antonio, TX
Flood risk 1/10 · Minimal
- FEMA flood zone
- X (unshaded)
- Chance of flooding over 30 yrs
- 0.0%
- Est. flood insurance / yr
- $507 – $1,088
Fire risk 1/10 · Minimal
- Est. fire insurance / yr
- $1,222 – $2,270
Heat risk 8/10 · Major
- Hot days now (above 108°F)
- 7 days/yr
- Hot days in 30 yrs
- 22 days/yr
Wind risk 8/10 · Major
- Chance of severe wind over 30 yrs
- 80.0%
Air-quality risk 2/10 · Minimal
- Unhealthy air days now
- 1 days/yr
- Unhealthy air days in 30 yrs
- 2 days/yr
Risk factors via First Street. Map © Google.
Why this score? — see what drove the B grade
The composite is a weighted blend of 9 inputs, each scored 0–100. Each bar is that input's sub-score; the figure is the points it added to the 100-point composite (weight × sub-score).
- Cash flow +30.0/30.0
- 1% rule +10.0/10.0
- DSCR +10.0/10.0
- Appreciation +10.0/10.0
- Livability +4.0/5.0
- Condition / age +2.5/5.0
- ARV discount +2.4/15.0
- Rent growth +2.1/5.0
- Schools +1.4/10.0
$795,000
🖨 Deal sheet 📄 Offer letter ✓ Due diligence
Multi-family units
County records classify this as Multi-Family (5+ Unit). Listing-text estimate: 1 unit. estimate disagrees with records
5+ unit building — per-unit beds/baths from public records are typically unavailable; the breakdown below (if shown) is an estimate from the listing text.
Listing remarks MLS
119 Bank St, San Antonio, TX 78204. A rare opportunity in the booming Lone Star/Southtown corridor. 11 Units | $795,000 | 8.8 Cap Rate | All Bills Paid | NOI: $70,179.15 This multi-building compound features 11 rentable units, a central courtyard, and a flexible mix of unit types ideal for strong cash flow. Rear Building - 6 Units: Three 1-bedroom apartments and three efficiencies. Middle Courtyard Row - 3 Units: Two efficiencies and one 1-bedroom unit. One efficiency is currently vacant (market $695/mo). Front Buildings - 2 Units: * 3-bedroom/1-bath single-family home. * Two-story co-living house with 7 rentable bedrooms (4 currently rented) Financials: * Monthly income: $9,475 * Annual income: $113,700 * Operating expenses: $43,520.85 * Net Operating Income: $70,170.15 * 8.8 Cap Rate at List Price * All utilities included (owner pays water, electric, taxes, insurance) Investors you need to come see this one.
Key facts
- Central courtyard
- 9,626 sq ft lot
- 7 parking spots
Tags
Neighborhood map
What this means for you Summary
Snapshot
- This is a 8-bed/8.0-bath multifamily listed at $795k.
Deal economics
- At list price, monthly cash flow is $5k ($58k/yr) — positive.
- The deal already cash-flows at list — no discount required.
- Meets the 1% rule at list price ($13k rent vs $795k).
- Recommended offer: $700k (12.0% below list) — sets the bar for market timing.
- Cap rate 13.6% vs local median 3.8% in San Antonio — top-decile yield for the area; either an underpriced asset or a hidden risk that comps aren't pricing in. Stress-test before assuming the spread holds.
Location & tenants
- Location reads 80/100 on livability (#31 in TX, #1,616 nationally) — a professional / high-income tenant draw. Strengths: amenities A+, commute A+, cost of living A+; Watch: schools C-, crime F.
- San Antonio ISD (urban): math 12% / reading 22% proficiency, ranked #805 of 826 in TX (top 98%) — low school quality limits family demand, transient renter base, plan for 1-2y turnover; 80% free/reduced lunch — lower-income household profile, screen leases tightly.
- Market conditions: Rents soft (-1.4%/yr); 94 active listings in the ZIP; 8,308 units permitted in Bexar County in 2024 (2,506 in 5+ unit buildings).
- At $13,109/mo this rent would consume 261% of the median local household income ($60k/yr) (locally 545% of renters already pay >50% of income on rent) — very limited rent-growth headroom before tenants either downsize or default.
Forward outlook
- In year one you build about $85k of equity ($5k loan paydown + $80k appreciation (10.0% local appreciation)).
- Bexar County population projected at +50% by 2050 — long-run rental-demand tailwind backs the buy-and-hold thesis.
- At projected returns (10.0% appreciation + 0.0% rent growth), your $223k cash investment doubles in ~2 years — after that, you're playing with house money.
- By year 2, paydown + projected appreciation supports a ~$137k cash-out refi (75% LTV) — recoverable capital for the next deal without selling this one.
Negotiation context
- It's been on market 196 days — a 12% lower offer ($700k) is reasonable based on typical stale-listing flexibility.
- 4 sale attempts since 21y ago with the ask held roughly flat each time — persistent listings suggest the price (not the market) is what's stuck; bring a comps-based counter.
Risks & watch-outs
- Watch-outs: built in 1949 — expect roof / HVAC / electrical / plumbing capex.
- Climate carrying-cost: severe wind risk, 80% chance of damaging wind over 30y; extreme-heat days projected 7→22/yr by 2055 (HVAC capex compounding) — expect insurance premiums to compound above CPI over the hold.
Questions for the listing agent
- It's been on market 196 days. Have you received any prior offers? Is the seller open to a 12% concession, seller financing, or rate buy-down credit?
- Built in 1949 — when were the roof, HVAC, electrical panel, plumbing, and water heater last replaced?
- Why hasn't it sold? Are there any deal-killer items the seller is aware of (foundation, flood, title, zoning, code violations)?
- Is there a deadline driving the sale (1031 exchange, divorce, estate, relocation)? That informs how much negotiation room exists.
- Crime grade is F in this area — have there been break-ins, vandalism, or insurance claims at this property in the last 3 years? What carrier currently insures it and at what premium?
- What's the average days-on-market for RENTAL listings here right now (not sales)? A rising rental-DOM trend means longer vacancies and softer asking-rent achievability than the comps imply.
- What's the recent tenant-quality profile in this submarket — average credit score on applications, eviction rate, late-payment / NSF rate, and stable-employment percentage? A property-management company in the area should have these aggregated.
- How much new apartment / multifamily construction is in the pipeline within 1–3 miles? Heavy new supply (>2% of stock underway) typically softens rents 12–24 months out; light construction supports rent growth.
Investment metrics
- 1% rule
- 1.65% ✓
- Cap rate
- 13.63%
- Cash-on-cash
- 26.21%
- DSCR
- 2.17
- GRM
- 5.1
CMA / ARV
- ARV (median comp)
- $714,219
- List price
- $795,000
- Delta
- 11.31%
- Verdict
- OVERPRICED
- Comps
- 6 within 2.0 mi
Projected returns pro-forma
10.0% appreciation · 0.0% rent growth · sell at horizon
- IRR
- 42.3%
- Equity multiple
- 4.16×
- Total profit
- $704,425
- Equity at exit
- $716,199
- IRR
- 35.4%
- Equity multiple
- 8.92×
- Total profit
- $1,762,500
- Equity at exit
- $1,544,510
Cash invested: $222,600 (down + closing). Projections, not guarantees.
Landlord ↔ Tenant lean methodology
- Overall (STATE)
- 87 Strongly Landlord-Friendly
- State Texas
- 87 Strongly Landlord-Friendly · R+5
- County
- — inherits STATE
- City
- — inherits STATE
ZIP-level market 78204
- Home prices YoY
- 6.4%
- Rents YoY
- -1.4%
- Active inventory
- 94
- Price-to-rent
- 62.5×
Monthly cashflow live
- Estimated rent
- $13,109 high interval (Pro) →
- Mortgage (P&I)
- −$4,169
- Tax est. 1.5%
- −$994 /mo · $11,925/yr
- Insurance
- −$331
- HOA
- −$0
- Vacancy / Maint / Mgmt
- −$2,753
- Net cashflow
- $4,862
Break-even live
11-unit breakdown (identical units grouped — click to expand)
| Units | Beds | Baths | Est. rent |
|---|---|---|---|
| 8× units | 1 | 1 | $8,480 |
| #1 | 1 | 1 | $1,060 |
| #2 | 1 | 1 | $1,060 |
| #3 | 1 | 1 | $1,060 |
| #4 | 1 | 1 | $1,060 |
| #5 | 1 | 1 | $1,060 |
| #6 | 1 | 1 | $1,060 |
| #7 | 1 | 1 | $1,060 |
| #8 | 1 | 1 | $1,060 |
| 1× unit | 3 | 1 | $1,310 |
| 2× units | 7 | 1 | $3,316 |
| #10 | 7 | 1 | $1,658 |
| #11 | 7 | 1 | $1,658 |
| Total (11 units) | $13,109 | ||
UW: 25.0% down · 7.5% · 30yr · 1.5% tax · 5.0% vac · 8.0% maint · 8.0% mgmt
Financing live
Cash to close
- Down payment
- $198,750
- Closing costs
- $23,850
- Reserves months
- —
- Total cash needed
- —
Loan-product check · same deal, 3 products live
Conventional
25% down · 7.5% · 30yr
- Down + closing
- —
- Monthly P&I
- —
- Monthly cashflow
- —
- DSCR
- —
- Eligible?
- —
Personal DTI + credit; lowest rate.
DSCR
20% down · 8.5% · 30yr
- Down + closing
- —
- Monthly P&I
- —
- Monthly cashflow
- —
- DSCR
- —
- Eligible?
- —
No personal income docs; deal must DSCR.
Hard money
10% down · 12.0% · 12mo
- Down + closing
- —
- Monthly P&I
- —
- Monthly cashflow
- —
- DSCR
- —
- Eligible?
- —
Short-term bridge; refi at stabilization.
Listing history 20 events
-
2026-06-18days on market $795,000 Active 196 DOM
-
2026-06-17days on market $795,000 Active 195 DOM
-
2026-06-16days on market $795,000 Active 194 DOM
-
2026-06-15days on market $795,000 Active 193 DOM
-
2026-06-13days on market $795,000 Active 191 DOM
-
2026-06-09days on market $795,000 Active 187 DOM
-
2026-06-08days on market $795,000 Active 186 DOM
-
2026-06-07days on market $795,000 Active 185 DOM
-
2026-06-04days on market $795,000 Active 182 DOM
-
2026-06-03days on market $795,000 Active 181 DOM
-
2026-06-02days on market $795,000 Active 180 DOM
-
2026-06-01days on market $795,000 Active 179 DOM
-
2026-05-31days on market $795,000 Active 178 DOM
-
2025-12-05$795,000 New 950-char remark
Show marketing remark (950 chars)
119 Bank St, San Antonio, TX 78204. A rare opportunity in the booming Lone Star/Southtown corridor. 11 Units | $795,000 | 8.8 Cap Rate | All Bills Paid | NOI: $70,179.15 This multi-building compound features 11 rentable units, a central courtyard, and a flexible mix of unit types ideal for strong cash flow. Rear Building - 6 Units: Three 1-bedroom apartments and three efficiencies. Middle Courtyard Row - 3 Units: Two efficiencies and one 1-bedroom unit. One efficiency is currently vacant (market $695/mo). Front Buildings - 2 Units: * 3-bedroom/1-bath single-family home. * Two-story co-living house with 7 rentable bedrooms (4 currently rented) Financials: * Monthly income: $9,475 * Annual income: $113,700 * Operating expenses: $43,520.85 * Net Operating Income: $70,170.15 * 8.8 Cap Rate at List Price * All utilities included (owner pays water, electric, taxes, insurance) Investors you need to come see this one.
-
2012-12-31historical
-
2011-09-01$239,900
-
2011-08-27historical
-
2009-02-27$249,900
-
2005-08-03soldstatus
-
2005-02-25$250,000
ⓘ Source: listings_history table (triggers on properties + properties_extension) + one-shot
backfill from property_details.listing_events for pre-trigger history.
Climate risk First Street
- Flood 1/10 Low FEMA zone X (unshaded) · 0% chance over 30 yrs
- Wildfire 1/10 Low
- Heat 8/10 Severe 7 d/yr ≥108°F today · 22 d/yr by 30 yrs out
- Wind 8/10 Severe 80% chance of damaging wind over 30 yrs
- Air quality 2/10 Low 1 unhealthy d/yr today · 2 by 30 yrs out
Nearby sold comps map
Loading sold comps map…
Walkable amenities ~0.75 mi
Loading nearby amenities…
Taxation est. · year 1
- Rental income
- $157,308
- − Mortgage interest
- −$44,532
- − Property taxes
- −$11,925
- − Insurance
- −$3,975
- − Repairs & maintenance
- −$12,585
- − Management
- −$12,585
- − Depreciation
- −$23,127
- Taxable income
- $48,579
- Est. tax owed @ 24.0%
- −$11,659
- After-tax cash flow
- $46,686/yr
For passive investors: Depreciation is non-cash, so a rental often shows a tax loss while cash-flowing — sheltering income. Rental losses are passive: they offset passive income freely, and up to $25,000/yr can offset ordinary (W-2) income if you actively participate and your MAGI is under $100k (phasing out to $0 by $150k); unused losses carry forward. On sale, claimed depreciation is recaptured at up to 25%, and gains may owe capital-gains tax (a 1031 exchange can defer both). Figures are a year-1 estimate at your 24.0% rate — not tax advice; consult a CPA.
Schools (NCES district)
- District
- San Antonio ISD
- NCES district ID
- 4838730
- Math proficiency
- 12% ▼ -21.00%
- Reading proficiency
- 22% ▼ -7.00%
- Median HH income
- $30,952
- Composite
- 13.57/100
- National rank
- #9512
- State rank
- #805 of 826 in TX
Livability — San Antonio
- Score
- 80/100
- State rank
- #31
- US rank
- #1616
Category grades
Schools grade is shown separately in the Schools card above.
Census & demographics
- Census place
- San Antonio, TX
- County
- Bexar County · 1,990,555 people
- City population
- 1,806,925
- Metro
- San Antonio-New Braunfels, TX
- Population (ZIP)
- 11,983
- Household income
- $60,255
- Rent vs Own
- Severe rent burden
- 545.0
Population outlook (Bexar County) Hauer SSP2
- Today (2025)
- 2,336,851 people
- By 2030
- 2,560,728 · +9.6%
- By 2040
- 3,020,569 · +29.3%
- By 2050
- 3,493,522 · +49.5%
- By 2075
- 4,668,459 · +99.8%
- By 2100
- 5,533,242 · +136.8%
Race, ethnicity, and origin ACS 2023
- Neighborhood character
- Predominantly Hispanic (82%)
- Race & ethnicity
- Hispanic / Latino 82% Two or more races 37% White 15% Black 2% Native American 2%
- Hispanic origin (detail)
- Mexican 74%
- Common ancestry
- Romanian 3% Italian 2% Lithuanian 1%
- Foreign-born
- 15% · Canada
- Languages at home
- 50% English-only · Spanish 49%
Political lean MEDSL · Bexar
- 2024 margin
- Lean D (+9.8) · D 54.3% · R 44.6% · Other 1.1%
- 2008→2024 swing
- +4.2pp toward D · 2008: 5.6pp · 2024: 9.8pp
- All cycles
- 2024: D+9.8 2020: D+18.2 2016: D+13.5 2012: D+4.6 2008: D+5.6
Not yet ingested
- Civics
- —
Market trends
- HPI YoY
- ▲ 14.91%
- Current HPI
- 249.0597
- Rent YoY
- ▼ -1.44%
- Metro
- San Antonio-New Braunfels, TX
- State GDP YoY
- ▲ 3.95%
- F500 in state
- 110
Industry mix (Fortune 500 HQ in TX)
| Industry | F500 HQs | Revenue |
|---|---|---|
| Energy | 16 | $1,198B |
|
||
| Technology | 5 | $198B |
|
||
| Engineering / Construction | 4 | $72B |
|
||
| Energy Services | 3 | $60B |
|
||
| Utilities | 3 | $41B |
|
||
| Healthcare | 2 | $330B |
|
||
Price history
+218.0% since first listed7 events — show timeline
- 2025-12-05 Listed $795,000 LERA
- 2012-12-31 Listing Removed — LERA
- 2011-09-01 Listed $239,900 LERA
- 2011-08-27 Listing Removed — LERA
- 2009-02-27 Listed $249,900 LERA
- 2005-08-03 Sold (MLS) — LERA
- 2005-02-25 Listed $250,000 LERA
Cash-flow waterfall
monthlySold comps — $/sqft
last 12 mo · ≤1 miLoading sold comps…