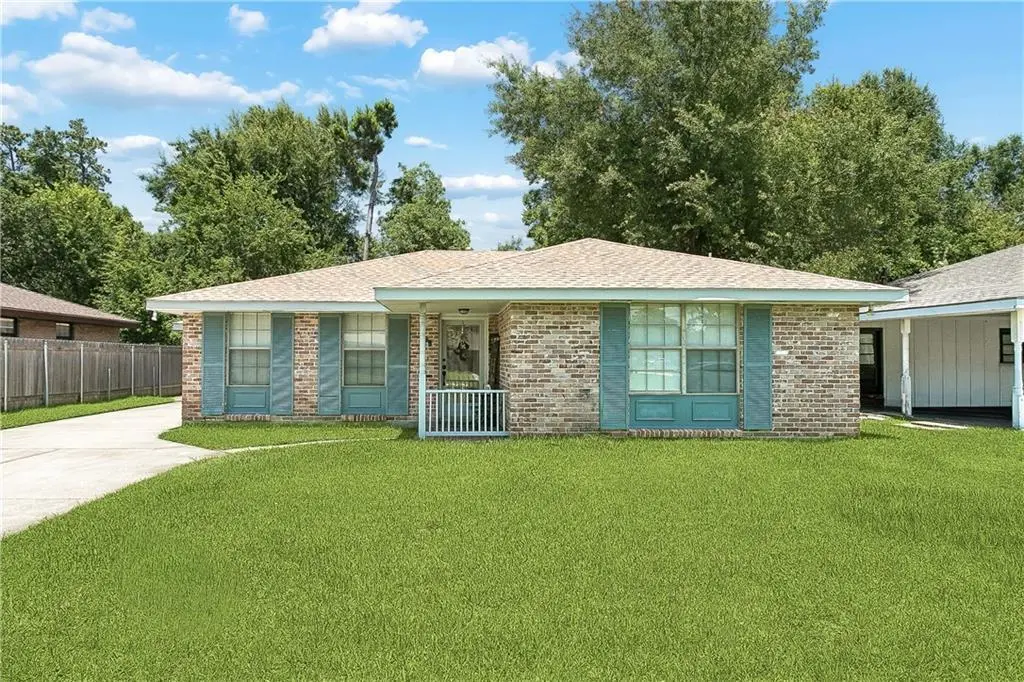
412 Markham Dr · Slidell, LA
Flood risk No data
- FEMA flood zone
- —
- Chance of flooding over 30 yrs
- —
- Est. flood insurance / yr
- —
Fire risk No data
- Est. fire insurance / yr
- —
Heat risk No data
- Hot days now (above threshold)
- —
- Hot days in 30 yrs
- —
Wind risk No data
- Chance of severe wind over 30 yrs
- —
Air-quality risk No data
- Unhealthy air days now
- —
- Unhealthy air days in 30 yrs
- —
Risk factors via First Street. Map © Google.
Why this score? — see what drove the D grade
The composite is a weighted blend of 9 inputs, each scored 0–100. Each bar is that input's sub-score; the figure is the points it added to the 100-point composite (weight × sub-score).
- Cash flow +19.6/30.0
- DSCR +6.2/10.0
- 1% rule +4.4/10.0
- Schools +4.3/10.0
- Livability +3.5/5.0
- Rent growth +2.9/5.0
- Condition / age +2.5/5.0
- ARV discount +0.0/15.0
- Appreciation +0.0/10.0
$184,000
🖨 Deal sheet 📄 Offer letter ✓ Due diligence
Listing remarks MLS
Affordable space in Slidell! Welcome to 412 Markham Dr, a 3-bedroom, 2-bath single-family home located in Westchester Estates. Offering approximately 1,505 sqft of living space on a 7,090 sqft lot, this one-story home is a great fit for first-time homebuyers, growing families, downsizers, or investors looking for value in the 70458 market. Inside, you'll find a comfortable floor plan with room to gather, relax, and create a home that fits your lifestyle. The 3-bedroom layout gives you flexibility for family, guests, a home office, or extra storage, while the 2 full bathrooms add everyday convenience. Outside, the spacious yard offers room for entertaining, play, gardening, pets, or simply enjoying your own outdoor space. Priced under $200,000, this Slidell home offers an excellent opportunity to own a property in Slidell. Conveniently located by local schools, shopping, dining, and everyday essentials, this home combines affordability, space, and location. Whether you're tired of renting, searching for more room, or looking for a smart investment opportunity, 412 Markham Dr is ready for its next chapter. Schedule your private showing today.
Key facts
- Spacious yard
- Local schools
- Shopping
Tags
Property features AI
Exterior
- Parking: Driveway; Off-street parking; Three or more parking spaces
- Security: Smoke detector(s)
- Utilities: Public water; Public sewer
- Home design: Single-story; Very good condition
- Construction: Brick construction; Shingle roof; Slab foundation; Built with a water-heater-related energy-efficient feature
- Exterior features: Porch; Concrete and paver patio/porch
Interior
- Kitchen: Microwave; Oven; Range
- Bedrooms: Total rooms: 5
- Bathrooms: 2 full bathrooms
- Heating & cooling: Central heating; Central air conditioning
- Interior features: Attic; Ceiling fan(s); Granite counters; Pantry; Pull-down attic stairs
- Laundry & utility: Washer hookup; Dryer hookup
Neighborhood map
What this means for you Summary
Snapshot
- This is a 3-bed/2.0-bath single-family listed at $184k.
Deal economics
- At list price, monthly cash flow is $211 ($3k/yr) — positive.
- The deal already cash-flows at list — no discount required.
- To meet the 1% rule (rent ≥ 1% of price), the offer needs to be $172k (6.4% below list).
- Recommended offer: $172k (6.4% below list) — sets the bar for 1% rule.
- Cap rate 7.7% vs local median 5.9% in Slidell — meaningfully above typical; check what's discounted (condition, days-on-market, listing class) to confirm the premium yield is real.
Location & tenants
- Location reads 70/100 on livability (#57 in LA) — a middle-class / working-renter tenant base. Strengths: cost of living A+, housing A+, health & safety A+; Watch: amenities F, commute F.
- St. Tammany Parish (suburban): math 43% / reading 55% proficiency, ranked #11 of 98 in LA (top 11%) — families likely to look elsewhere, expect single-tenant / working-renter base with shorter leases.
- Market conditions: Rents rising (+1.5%/yr); 489 active listings in the ZIP; 11 comparable units currently listed for rent nearby; rentals at typical pace (median 22d on market — plan ~3-4 weeks tenant-placement turnaround); 1,064 units permitted in St. Tammany Parish in 2024 (0 in 5+ unit buildings).
Forward outlook
- Local home prices are declining (-3.0%/yr); year-one equity from $1k of loan paydown is wiped out by about $6k of value loss. Plan a longer hold.
- St. Tammany County population projected at +27% by 2050 — long-run rental-demand tailwind backs the buy-and-hold thesis.
Negotiation context
- Only 8 days on market — expect competitive offers; lowballing is unlikely to land.
- 17 sale attempts since 26y ago with the ask held roughly flat each time — persistent listings suggest the price (not the market) is what's stuck; bring a comps-based counter.
Questions for the listing agent
- Built in 1971 — when were the roof, HVAC, electrical panel, plumbing, and water heater last replaced?
- Is there a deadline driving the sale (1031 exchange, divorce, estate, relocation)? That informs how much negotiation room exists.
- Schools are B-rated — typically a magnet for longer-tenancy family renters. What's the average tenant stay here, and is there a school-zone premium baked into asking?
- The area grade is low — what's the realistic commute time and amenity access for the typical tenant pool here? Any planned neighborhood developments (good or bad) we should know about?
- What's the average days-on-market for RENTAL listings here right now (not sales)? A rising rental-DOM trend means longer vacancies and softer asking-rent achievability than the comps imply.
- What's the recent tenant-quality profile in this submarket — average credit score on applications, eviction rate, late-payment / NSF rate, and stable-employment percentage? A property-management company in the area should have these aggregated.
- How much new for-sale + rental construction is in the pipeline within 1–3 miles? Heavy new supply typically softens prices + rents 12–24 months out; constrained supply supports both.
Investment metrics
- 1% rule
- 0.94% ✗
- Cap rate
- 7.67%
- Cash-on-cash
- 4.93%
- DSCR
- 1.22
- GRM
- 8.9
CMA / ARV
- ARV (on-the-fly)
- $152,005
- Comps found
- 12
Show comp detail 12 sales within ~0.75 mi
| Address | Dist | Beds/Ba | Sqft | Sold | Price | $/sf | Match |
|---|---|---|---|---|---|---|---|
| 3858 Eton St | 0.16mi | 3/2.0 | 1,367 (-9%) | 1mo | $188,000 | $138 | 77 |
| 365 Hickory Dr | 0.18mi | 4/2.0 (+1) | 1,595 (+6%) | 2mo | $68,500 | $43 | 75 |
| 3844 Riviera Dr | 0.45mi | 3/1.5 | 1,466 (-3%) | 6mo | $150,000 | $102 | 68 |
| 931 Hailey Ave | 0.58mi | 3/2.0 | 1,445 (-4%) | 2mo | $141,000 | $98 | 64 |
| 328 Hickory Dr | 0.25mi | 3/1.0 | 1,350 (-10%) | 4mo | $137,000 | $101 | 64 |
| 140 Greencrest Dr | 0.74mi | 3/2.0 | 1,480 (-2%) | 1mo | $176,000 | $119 | 62 |
| 127 Whitehall Dr | 0.59mi | 4/2.0 (+1) | 1,475 (-2%) | 5mo | $145,000 | $98 | 60 |
| 37598 Lopez St | 0.73mi | 3/2.0 | 1,580 (+5%) | 0mo | $110,000 | $70 | 57 |
| 156 Greencrest Dr | 0.71mi | 3/2.0 | 1,350 (-10%) | 0mo | $130,000 | $96 | 49 |
| 2872 Slidell Ave | 0.67mi | 3/1.0 | 1,338 (-11%) | 1mo | $139,000 | $104 | 46 |
| 136 Palm Springs Dr | 0.71mi | 3/1.5 | 1,348 (-10%) | 5mo | $170,000 | $126 | 44 |
| 837 Pine Tree St | 0.74mi | 4/2.0 (+1) | 1,676 (+11%) | 1mo | $159,900 | $95 | 41 |
Match score weights: distance 35% · size 25% · config 20% · recency 20%. Top-matched comps best support the ARV.
Projected returns pro-forma
-3.0% appreciation · 1.47% rent growth · sell at horizon
- IRR
- -10.3%
- Equity multiple
- 0.63×
- Total profit
- $-19,008
- Equity at exit
- $27,435
- IRR
- -3.0%
- Equity multiple
- 0.81×
- Total profit
- $-9,800
- Equity at exit
- $15,909
Cash invested: $51,520 (down + closing). Projections, not guarantees.
Landlord ↔ Tenant lean methodology
- Overall (STATE)
- 90 Strongly Landlord-Friendly
- State Louisiana
- 90 Strongly Landlord-Friendly · R+12
- County
- — inherits STATE
- City
- — inherits STATE
ZIP-level market 70458
- Rents YoY
- 1.5%
- Active inventory
- 489
- Price-to-rent
- 8.9×
Monthly cashflow live
- Estimated rent
- $1,722 high interval (Pro) →
- Mortgage (P&I)
- −$965
- Tax from tax record
- −$107 /mo · $1,288/yr
- Insurance
- −$77
- HOA
- −$0
- Vacancy / Maint / Mgmt
- −$362
- Net cashflow
- $211
Break-even live
UW: 25.0% down · 7.5% · 30yr · 1.5% tax · 5.0% vac · 8.0% maint · 8.0% mgmt
Financing live
Cash to close
- Down payment
- $46,000
- Closing costs
- $5,520
- Reserves months
- —
- Total cash needed
- —
Loan-product check · same deal, 3 products live
Conventional
25% down · 7.5% · 30yr
- Down + closing
- —
- Monthly P&I
- —
- Monthly cashflow
- —
- DSCR
- —
- Eligible?
- —
Personal DTI + credit; lowest rate.
DSCR
20% down · 8.5% · 30yr
- Down + closing
- —
- Monthly P&I
- —
- Monthly cashflow
- —
- DSCR
- —
- Eligible?
- —
No personal income docs; deal must DSCR.
Hard money
10% down · 12.0% · 12mo
- Down + closing
- —
- Monthly P&I
- —
- Monthly cashflow
- —
- DSCR
- —
- Eligible?
- —
Short-term bridge; refi at stabilization.
Rent comps 11 comps
| Address | Beds | Baths | Sqft | Rent | $/sqft | DOM | Units | Dist |
|---|---|---|---|---|---|---|---|---|
| 3839 Oxford St Slidell, LA | 3.0 | 2.0 | 1660 | $1,700 | $1.02 | 44d | 1 | 0.08mi |
| 3304 Bridge Dr Slidell, LA | 3.0 | 2.0 | 1250 | $1,700 | $1.36 | 44d | 1 | 0.40mi |
| 102 Spartan Trace Blvd Slidell, LA | 3.0 | 2.0 | 1516 | $2,000 | $1.32 | 24d | 1 | 0.50mi |
| 519 Spartan Dr #9101 Slidell, LA | 2.0 | 2.0 | 1304 | $1,400 | $1.07 | 24d | 1 | 0.57mi |
| 172 South St Slidell, LA | 4.0 | 2.0 | 1486 | $1,800 | $1.21 | 21d | 1 | 0.61mi |
| 3046 Slidell Ave Slidell, LA | 4.0 | 1.0 | 1253 | $1,850 | $1.48 | 3d | 1 | 0.62mi |
| 301 Spartan Dr Slidell, LA | 1.0–2.0 | 1.0–2.0 | 880 | $1,502 | $1.71 | 3d | 8 | 0.65mi |
| 901 Old Spanish Trl Slidell, LA | 2.0 | 1.5 | 1070 | $1,120 | $1.05 | 12d | 1 | 0.72mi |
| 3152 College St Slidell, LA | 3.0 | 1.0 | 1373 | $1,750 | $1.27 | 44d | 1 | 0.76mi |
| 1640 Town Center Pkwy Slidell, LA | 3.0 | 1.0–2.0 | 959 | $1,895 | $1.98 | 2d | 46 | 1.43mi |
| 1303 Town Center Pkwy Slidell, LA | 3.0 | 1.0–2.0 | 990 | $1,825 | $1.84 | 2d | 31 | 1.49mi |
Listing history 6 events
-
2026-06-18days on market $184,000 Active 8 DOM
-
2026-06-17days on market $184,000 Active 7 DOM
-
2026-06-16days on market $184,000 Active 6 DOM
-
2026-06-15days on market $184,000 Active 5 DOM
-
2026-06-13remarks 693-char remark
-
2026-06-13$184,000 Active 3 DOM
ⓘ Source: listings_history table (triggers on properties + properties_extension) + one-shot
backfill from property_details.listing_events for pre-trigger history.
Tax reassessment forecast LA · Resets to sale price
- Current annual tax
- $1,288 · $107/mo
- Projected year-2 tax
- $1,288 · $107/mo
- Expected delta
- $0/yr ($0/mo · 0.0%)
ⓘ Screening estimate from a state-policy table — verify with the county assessor before closing.
Nearby sold comps map
Loading sold comps map…
Walkable amenities ~0.75 mi
Loading nearby amenities…
Taxation est. · year 1
- Rental income
- $20,663
- − Mortgage interest
- −$10,307
- − Property taxes
- −$1,288
- − Insurance
- −$920
- − Repairs & maintenance
- −$1,653
- − Management
- −$1,653
- − Depreciation
- −$5,353
- Taxable loss
- −$510
- Est. tax savings @ 24.0%
- +$122
- After-tax cash flow
- $2,660/yr
For passive investors: Depreciation is non-cash, so a rental often shows a tax loss while cash-flowing — sheltering income. Rental losses are passive: they offset passive income freely, and up to $25,000/yr can offset ordinary (W-2) income if you actively participate and your MAGI is under $100k (phasing out to $0 by $150k); unused losses carry forward. On sale, claimed depreciation is recaptured at up to 25%, and gains may owe capital-gains tax (a 1031 exchange can defer both). Figures are a year-1 estimate at your 24.0% rate — not tax advice; consult a CPA.
Schools (NCES district)
- District
- St. Tammany Parish
- NCES district ID
- 2201650
- Math proficiency
- 43% ▼ -32.00%
- Reading proficiency
- 55% ▼ -26.00%
- Median HH income
- $61,752
- Composite
- 43.04/100
- National rank
- #3098
- State rank
- #11 of 98 in LA
Livability — Slidell
- Score
- 70/100
- State rank
- #57
- US rank
- #7673
Category grades
Schools grade is shown separately in the Schools card above.
Census & demographics
- Census place
- Slidell, LA
- County
- Saint Tammany Parish · 228,296 people
- City population
- 95,511
- Metro
- New Orleans-Metairie, LA
- Population (ZIP)
- 39,034
- Household income
- $72,843
- Rent vs Own
- Severe rent burden
- 1331.0
Population outlook (St. Tammany County) Hauer SSP2
- Today (2025)
- 286,725 people
- By 2030
- 304,175 · +6.1%
- By 2040
- 336,203 · +17.3%
- By 2050
- 364,590 · +27.2%
- By 2075
- 433,362 · +51.1%
- By 2100
- 470,333 · +64.0%
Race, ethnicity, and origin ACS 2023
- Neighborhood character
- Predominantly White (66%)
- Race & ethnicity
- White 66% Black 17% Two or more races 10% Hispanic / Latino 9% Native American 2% Asian 1%
- Hispanic origin (detail)
- Mexican 3% Puerto Rican 1%
- Common ancestry
- Lithuanian 15% Slovak 2% Romanian 1%
- Foreign-born
- 3% · Canada, Vietnam
- Languages at home
- 93% English-only · Spanish 5% Vietnamese 1%
Political lean MEDSL · St. Tammany
- 2024 margin
- Solid R (+43.8) · D 27.3% · R 71.1% · Other 1.6%
- 2008→2024 swing
- +9.6pp toward D · 2008: -53.4pp · 2024: -43.8pp
- All cycles
- 2024: R+43.8 2020: R+44.2 2016: R+50.8 2012: R+52.2 2008: R+53.4
Not yet ingested
- Civics
- —
Market trends
- HPI YoY
- ▼ -173.60%
- Current HPI
- 147.4749
- Rent YoY
- ▲ 1.47%
- Metro
- New Orleans-Metairie, LA
- State GDP YoY
- ▲ 3.29%
- F500 in state
- 10
Industry mix (Fortune 500 HQ in LA)
| Industry | F500 HQs | Revenue |
|---|---|---|
| Telecommunications | 2 | $23B |
|
||
| Utilities | 1 | $12B |
|
||
| Wholesale / Distribution | 1 | $5B |
|
||
| Advertising | 1 | $2B |
|
||
Price history
+112.7% since first listed25 events — show timeline
- 2026-06-10 Listed $184,000 GSREIN
- 2026-06-10 Listed $184,000 AcadianaMLS
- 2023-09-20 Sold (MLS) $163,000 GSREIN
- 2023-08-03 Contingent — GSREIN
- 2023-07-27 Listed $179,999 GSREIN
- 2023-07-27 Listed $179,999 AcadianaMLS
- 2018-09-20 Sold (Public Records) $137,000 Public Records
- 2018-09-19 Sold (MLS) $137,000 GSREIN
- 2018-08-22 Contingent — GSREIN
- 2018-06-14 Listed $140,000 AcadianaMLS
- 2018-06-14 Listed $140,000 GSREIN
- 2015-06-15 Listing Removed — GSREIN
- 2015-05-26 Relisted — GSREIN
- 2015-05-26 Listing Removed — GSREIN
- 2015-05-13 Listed $120,000 GSREIN
- 2014-11-25 Listed $120,000 AcadianaMLS
- 2010-07-14 Listed $142,000 GSREIN
- 2010-07-14 Listed $142,000 AcadianaMLS
- 2009-03-17 Listed $150,000 GSREIN
- 2009-03-17 Listed $145,000 GSREIN
- 2009-03-17 Listed $145,000 AcadianaMLS
- 2009-03-17 Listed $150,000 AcadianaMLS
- 2000-10-06 Sold (MLS) $80,000 GSREIN
- 2000-08-07 Listed $86,500 GSREIN
- 2000-08-07 Listed $86,500 AcadianaMLS
Property tax history
-2.9%/yrLatest (2025): $1,288 · +8.6% YoY. Source: county tax records.
Cash-flow waterfall
monthlySold comps — $/sqft
last 12 mo · ≤1 miLoading sold comps…