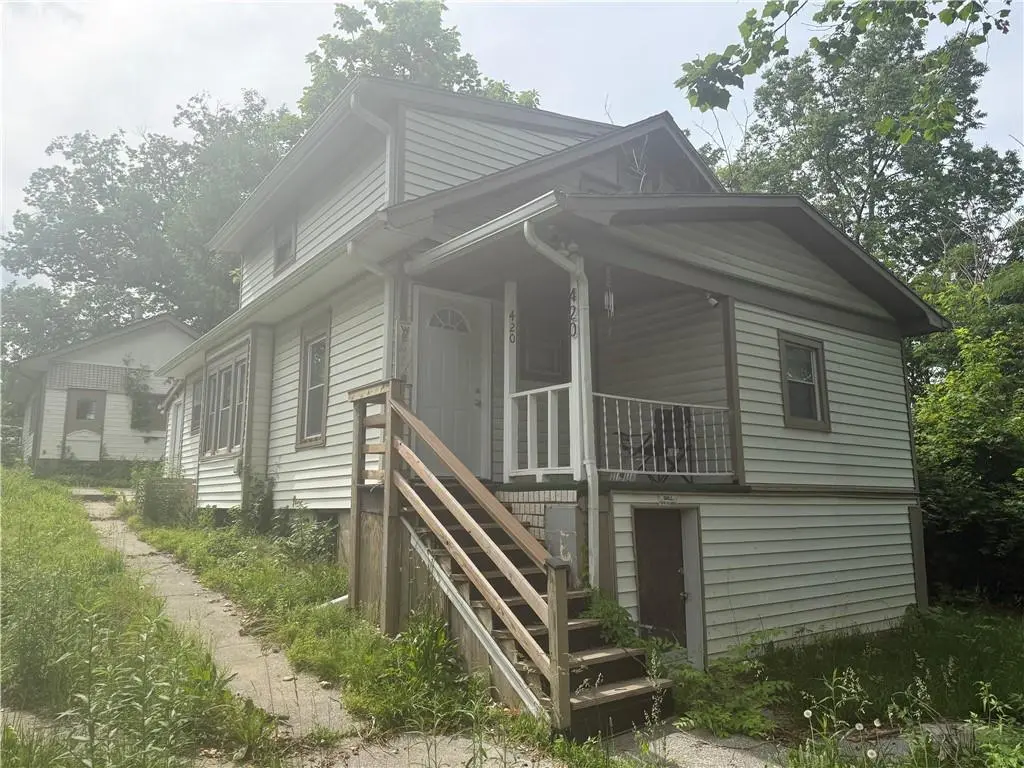
420 Farley Ter · Independence, MO
Flood risk 1/10 · Minimal
- FEMA flood zone
- X (unshaded)
- Chance of flooding over 30 yrs
- 0.0%
- Est. flood insurance / yr
- $473 – $860
Fire risk 2/10 · Minimal
- Est. fire insurance / yr
- $1,054 – $1,958
Heat risk 4/10 · Minor
- Hot days now (above 106°F)
- 7 days/yr
- Hot days in 30 yrs
- 17 days/yr
Wind risk 2/10 · Minimal
- Chance of severe wind over 30 yrs
- —
Air-quality risk 3/10 · Minor
- Unhealthy air days now
- 2 days/yr
- Unhealthy air days in 30 yrs
- 3 days/yr
Risk factors via First Street. Map © Google.
Why this score? — see what drove the F grade
The composite is a weighted blend of 9 inputs, each scored 0–100. Each bar is that input's sub-score; the figure is the points it added to the 100-point composite (weight × sub-score).
- Appreciation +10.0/10.0
- Cash flow +7.8/30.0
- Livability +4.1/5.0
- Schools +2.7/10.0
- Rent growth +2.5/5.0
- Condition / age +2.5/5.0
- DSCR +1.9/10.0
- 1% rule +1.4/10.0
- ARV discount +0.0/15.0
$175,000
🖨 Deal sheet 📄 Offer letter ✓ Due diligence
Listing remarks MLS
Enjoy Peace and Serenity in this Spacious 1.5 Story Home! Featuring 4 Bedrooms | 2 Baths with Charming Woodwork and Hardwoods throughout. The sellers have spared no expense getting this home refinished for the new owner! New fixtures and finishes throughout, new thermal windows, brand new bathroom with new tub and vanities, new kitchen and appliances, you don't want to miss this one! Outside features a fully fenced yard, with nothing but trees on two sides of your lot, a HUGE Garage with a large door for Big Trucks or RV Parking. Truly a gem of a home!
Key facts
- Additional parking
- Half acre of land
- Expanded yard space
Tags
Property features AI
Finance
- Other: Above-grade finished area reported by owner
- HOA & community: No association fees
Exterior
- Parking: Detached 2-car garage; Has garage
- Utilities: City/public water (verify); Public sewer
- Home design: Single-family residence; 1.5-story floor plan; Residential property
- Construction: Vinyl siding; Composition roof
- Exterior features: Porch; Metal fencing
Interior
- Kitchen: Kitchen on the first level
- Bedrooms: 4 bedrooms (two located on the first level; two located on the second level)
- Flooring: Wood floors
- Bathrooms: 2 full bathrooms (one on the first level; one on the second level)
- Heating & cooling: Forced air heating; Window unit(s) for cooling
- Interior features: Thermal windows; Mud room; Formal dining area; Crawl space basement with walk-out access
- Laundry & utility: Main-level laundry located off the kitchen
Neighborhood map
What this means for you Summary
Snapshot
- This is a 2-bed/1.0-bath single-family listed at $175k.
Deal economics
- At list price, monthly cash flow is $-193 ($-2k/yr) — negative.
- To cash-flow at today's rent, offer at most $141k (19.5% below list).
- To meet the 1% rule (rent ≥ 1% of price), the offer needs to be $111k (36.5% below list).
- Recommended offer: $111k (36.5% below list) — sets the bar for 1% rule.
Location & tenants
- Location reads 82/100 on livability (#10 in MO, #1,296 nationally) — a professional / high-income tenant draw. Strengths: amenities A+, commute A+, cost of living A+; Watch: schools C-, employment D+, crime F.
- Independence 30 (suburban): math 26% / reading 38% proficiency, ranked #252 of 324 in MO (top 78%) — families likely to look elsewhere, expect single-tenant / working-renter base with shorter leases.
- Market conditions: 46 active listings in the ZIP; 10 comparable units currently listed for rent nearby; rentals lingering (median 44d on market — plan ~5-8 weeks vacancy on turnover, expect pricing pressure); 50% of comp listings sitting > 30 days — soft ceiling on asking rent; 4,002 units permitted in Jackson County in 2024 (2,271 in 5+ unit buildings).
Forward outlook
- In year one you build about $19k of equity ($1k loan paydown + $18k appreciation (10.0% local appreciation)).
- Jackson County population projected at +4% by 2050 — modest demand growth; plan on rents tracking national, not racing it.
- By year 2, paydown + projected appreciation supports a ~$30k cash-out refi (75% LTV) — recoverable capital for the next deal without selling this one.
Negotiation context
- It's been on market 20 days — a 2% lower offer ($172k) is reasonable based on typical stale-listing flexibility.
- 4 sale attempts since 16y ago; this cycle's ask has dropped $15k (8%) from the opening price — seller is motivated, your offer sets the floor, not the list.
Risks & watch-outs
- Watch-outs: built in 1915 — expect roof / HVAC / electrical / plumbing capex.
Questions for the listing agent
- What do current leases actually rent for vs. the listed asking? Can we see a recent rent roll and the last 12 months of T-12 income?
- Built in 1915 — when were the roof, HVAC, electrical panel, plumbing, and water heater last replaced?
- Is there a deadline driving the sale (1031 exchange, divorce, estate, relocation)? That informs how much negotiation room exists.
- Crime grade is F in this area — have there been break-ins, vandalism, or insurance claims at this property in the last 3 years? What carrier currently insures it and at what premium?
- The area grade is low — what's the realistic commute time and amenity access for the typical tenant pool here? Any planned neighborhood developments (good or bad) we should know about?
- What's the average days-on-market for RENTAL listings here right now (not sales)? A rising rental-DOM trend means longer vacancies and softer asking-rent achievability than the comps imply.
- What's the recent tenant-quality profile in this submarket — average credit score on applications, eviction rate, late-payment / NSF rate, and stable-employment percentage? A property-management company in the area should have these aggregated.
- How much new for-sale + rental construction is in the pipeline within 1–3 miles? Heavy new supply typically softens prices + rents 12–24 months out; constrained supply supports both.
Investment metrics
- 1% rule
- 0.64% ✗
- Cap rate
- 4.97%
- Cash-on-cash
- -4.74%
- DSCR
- 0.79
- GRM
- 13.1
CMA / ARV
- ARV (on-the-fly)
- $122,148
- Comps found
- 12
Show comp detail 12 sales within ~0.75 mi
| Address | Dist | Beds/Ba | Sqft | Sold | Price | $/sf | Match |
|---|---|---|---|---|---|---|---|
| 8715 E Roberts St | 0.23mi | 3/1.5 (+1) | 1,056 (-7%) | 12mo | $20,000 | $19 | 62 |
| 716 Lewis Ave | 0.40mi | 3/1.0 (+1) | 1,062 (-6%) | 8mo | $49,000 | $46 | 60 |
| 531 S Brookside Ave | 0.50mi | 3/2.0 (+1) | 1,133 (+0%) | 12mo | $165,000 | $146 | 58 |
| 537 S Brookside Ave | 0.50mi | 3/1.0 (+1) | 1,185 (+5%) | 8mo | $162,500 | $137 | 56 |
| 136 N Brookside Ave | 0.53mi | 2/1.0 | 1,181 (+4%) | 16mo | $98,000 | $83 | 55 |
| 573 S Crescent Ave | 0.69mi | 3/1.5 (+1) | 1,154 (+2%) | 4mo | $120,000 | $104 | 54 |
| 560 S Crescent Ave | 0.65mi | 2/1.0 | 1,128 (-0%) | 20mo | $122,000 | $108 | 52 |
| 8919 E Independence Ave | 0.29mi | 2/1.0 | 988 (-13%) | 20mo | $140,000 | $142 | 49 |
| 578 S Oxford Ave | 0.56mi | 3/1.0 (+1) | 990 (-12%) | 2mo | $89,000 | $90 | 46 |
| 585 S Glenwood Ave | 0.64mi | 3/1.0 (+1) | 1,075 (-5%) | 14mo | $175,000 | $163 | 45 |
| 8610 Smart Ave | 0.28mi | 3/2.0 (+1) | 1,280 (+13%) | 16mo | $175,000 | $137 | 42 |
| 807 Ditman Ave | 0.56mi | 3/1.5 (+1) | 1,300 (+15%) | 17mo | $129,900 | $100 | 28 |
Match score weights: distance 35% · size 25% · config 20% · recency 20%. Top-matched comps best support the ARV.
Projected returns pro-forma
10.0% appreciation · 3.0% rent growth · sell at horizon
- IRR
- 20.9%
- Equity multiple
- 2.69×
- Total profit
- $82,924
- Equity at exit
- $157,654
- IRR
- 19.0%
- Equity multiple
- 6.18×
- Total profit
- $253,749
- Equity at exit
- $339,987
Cash invested: $49,000 (down + closing). Projections, not guarantees.
Landlord ↔ Tenant lean methodology
- Overall (STATE)
- 81 Strongly Landlord-Friendly
- State Missouri
- 81 Strongly Landlord-Friendly · R+10
- County
- — inherits STATE
- City
- — inherits STATE
ZIP-level market 64053
- Home prices YoY
- 17.9%
- Active inventory
- 46
- Price-to-rent
- 13.1×
Monthly cashflow live
- Estimated rent
- $1,112 high interval (Pro) →
- Mortgage (P&I)
- −$918
- Tax from tax record
- −$81 /mo · $974/yr
- Insurance
- −$73
- HOA
- −$0
- Vacancy / Maint / Mgmt
- −$233
- Net cashflow
- $-193
Break-even live
UW: 25.0% down · 7.5% · 30yr · 1.5% tax · 5.0% vac · 8.0% maint · 8.0% mgmt
Financing live
Cash to close
- Down payment
- $43,750
- Closing costs
- $5,250
- Reserves months
- —
- Total cash needed
- —
Loan-product check · same deal, 3 products live
Conventional
25% down · 7.5% · 30yr
- Down + closing
- —
- Monthly P&I
- —
- Monthly cashflow
- —
- DSCR
- —
- Eligible?
- —
Personal DTI + credit; lowest rate.
DSCR
20% down · 8.5% · 30yr
- Down + closing
- —
- Monthly P&I
- —
- Monthly cashflow
- —
- DSCR
- —
- Eligible?
- —
No personal income docs; deal must DSCR.
Hard money
10% down · 12.0% · 12mo
- Down + closing
- —
- Monthly P&I
- —
- Monthly cashflow
- —
- DSCR
- —
- Eligible?
- —
Short-term bridge; refi at stabilization.
Rent comps 10 comps
| Address | Beds | Baths | Sqft | Rent | $/sqft | DOM | Units | Dist |
|---|---|---|---|---|---|---|---|---|
| 8705 E Smart Ave Independence, MO | 2.0 | 1.0 | 750 | $1,000 | $1.33 | 43d | 1 | 0.17mi |
| 100 S Oxford Ave Independence, MO | 3.0 | 2.0 | 1141 | $1,425 | $1.25 | 44d | 1 | 0.55mi |
| 576 S Oxford Ave Independence, MO | 3.0 | 2.0 | 1098 | $1,400 | $1.28 | 43d | 1 | 0.58mi |
| 600 S Glenwood Ave Unit F Independence, MO | 2.0 | 1.0 | 750 | $995 | $1.33 | 19d | 1 | 0.65mi |
| 600 S Glenwood Ave Unit I Independence, MO | 1.0 | 1.0 | 700 | $695 | $0.99 | 43d | 1 | 0.66mi |
| 9528 E Winner Rd Independence, MO | 1.0–3.0 | 1.0 | 730 | $999 | $1.37 | 43d | 1 | 0.97mi |
| 1138 S Glenwood Ave Independence, MO | 2.0 | 1.0 | 1180 | $1,095 | $0.93 | 19d | 1 | 0.97mi |
| 10104 E Golf Ave Independence, MO | 3.0 | 2.0 | 1205 | $1,395 | $1.16 | 14d | 1 | 1.15mi |
| 611 Ewing Ave Unit B Kansas City, MO | 1.0 | 1.0 | 700 | $800 | $1.14 | 23d | 1 | 1.40mi |
| 10522 E 10th St S Independence, MO | 2.0 | 1.0 | 1020 | $1,099 | $1.08 | 23d | 1 | 1.49mi |
Listing history 29 events
-
2026-06-18days on market $175,000 Active 20 DOM
-
2026-06-17days on market $175,000 Active 19 DOM
-
2026-06-16days on market $175,000 Active 18 DOM
-
2026-06-15days on market $175,000 Active 17 DOM
-
2026-06-13pricedays on market $175,000 Active 15 DOM
-
2026-06-10price $185,000 Active 11 DOM
-
2026-06-09days on market $190,000 Active 11 DOM
-
2026-06-08days on market $190,000 Active 10 DOM
-
2026-06-07days on market $190,000 Active 9 DOM
-
2026-06-05days on market $190,000 Active 6 DOM
-
2026-06-03days on market $190,000 Active 5 DOM
-
2026-06-02days on market $190,000 Active 4 DOM
-
2026-06-01days on market $190,000 Active 3 DOM
-
2026-05-31days on market $190,000 Active 2 DOM
-
2026-05-29$190,000 Active
-
2025-05-16soldstatus
-
2025-05-13soldstatus Closed 558-char remark
Show marketing remark (558 chars)
Enjoy Peace and Serenity in this Spacious 1.5 Story Home! Featuring 4 Bedrooms | 2 Baths with Charming Woodwork and Hardwoods throughout. The sellers have spared no expense getting this home refinished for the new owner! New fixtures and finishes throughout, new thermal windows, brand new bathroom with new tub and vanities, new kitchen and appliances, you don't want to miss this one! Outside features a fully fenced yard, with nothing but trees on two sides of your lot, a HUGE Garage with a large door for Big Trucks or RV Parking. Truly a gem of a home!
-
2025-04-02historical Active Under Contract 558-char remark
Show marketing remark (558 chars)
Enjoy Peace and Serenity in this Spacious 1.5 Story Home! Featuring 4 Bedrooms | 2 Baths with Charming Woodwork and Hardwoods throughout. The sellers have spared no expense getting this home refinished for the new owner! New fixtures and finishes throughout, new thermal windows, brand new bathroom with new tub and vanities, new kitchen and appliances, you don't want to miss this one! Outside features a fully fenced yard, with nothing but trees on two sides of your lot, a HUGE Garage with a large door for Big Trucks or RV Parking. Truly a gem of a home!
-
2025-03-07$149,000 Active 558-char remark
Show marketing remark (558 chars)
Enjoy Peace and Serenity in this Spacious 1.5 Story Home! Featuring 4 Bedrooms | 2 Baths with Charming Woodwork and Hardwoods throughout. The sellers have spared no expense getting this home refinished for the new owner! New fixtures and finishes throughout, new thermal windows, brand new bathroom with new tub and vanities, new kitchen and appliances, you don't want to miss this one! Outside features a fully fenced yard, with nothing but trees on two sides of your lot, a HUGE Garage with a large door for Big Trucks or RV Parking. Truly a gem of a home!
-
2025-03-04historical
-
2025-02-21price $150,000
-
2024-12-03price $155,000
-
2024-09-04$160,000 Active
-
2010-12-03soldstatus
-
2010-11-10soldstatus
-
2010-09-27$15,000
-
2006-08-07soldstatus
-
2000-01-07soldstatus
-
1993-02-19soldstatus
ⓘ Source: listings_history table (triggers on properties + properties_extension) + one-shot
backfill from property_details.listing_events for pre-trigger history.
Tax reassessment forecast MO · Resets to sale price
- Current annual tax
- $974 · $81/mo
- Projected year-2 tax
- $1,698 · $141/mo
- Expected delta
- +$724/yr (+$60/mo · 74.3%)
ⓘ Screening estimate from a state-policy table — verify with the county assessor before closing.
Climate risk First Street
- Flood 1/10 Low FEMA zone X (unshaded) · 0% chance over 30 yrs
- Wildfire 2/10 Low
- Heat 4/10 Moderate 7 d/yr ≥106°F today · 17 d/yr by 30 yrs out
- Wind 2/10 Low
- Air quality 3/10 Moderate 2 unhealthy d/yr today · 3 by 30 yrs out
Nearby sold comps map
Loading sold comps map…
Walkable amenities ~0.75 mi
Loading nearby amenities…
Taxation est. · year 1
- Rental income
- $13,343
- − Mortgage interest
- −$9,803
- − Property taxes
- −$974
- − Insurance
- −$875
- − Repairs & maintenance
- −$1,067
- − Management
- −$1,067
- − Depreciation
- −$5,091
- Taxable loss
- −$5,535
- Est. tax savings @ 24.0%
- +$1,328
- After-tax cash flow
- $-993/yr
For passive investors: Depreciation is non-cash, so a rental often shows a tax loss while cash-flowing — sheltering income. Rental losses are passive: they offset passive income freely, and up to $25,000/yr can offset ordinary (W-2) income if you actively participate and your MAGI is under $100k (phasing out to $0 by $150k); unused losses carry forward. On sale, claimed depreciation is recaptured at up to 25%, and gains may owe capital-gains tax (a 1031 exchange can defer both). Figures are a year-1 estimate at your 24.0% rate — not tax advice; consult a CPA.
Schools (NCES district)
- District
- Independence 30
- NCES district ID
- 2915480
- Math proficiency
- 26% ▼ -8.00%
- Reading proficiency
- 38% ▼ -5.00%
- Median HH income
- $41,843
- Composite
- 27.04/100
- National rank
- #7054
- State rank
- #252 of 324 in MO
Livability — Independence
- Score
- 82/100
- State rank
- #10
- US rank
- #1296
Category grades
Schools grade is shown separately in the Schools card above.
Census & demographics
- Census place
- Independence, MO
- County
- Jackson County · 687,798 people
- City population
- 117,675
- Metro
- Kansas City, MO-KS
- Population (ZIP)
- 6,775
- Household income
- $47,285
- Rent vs Own
- Severe rent burden
- 330.0
Population outlook (Jackson County) Hauer SSP2
- Today (2025)
- 719,589 people
- By 2030
- 731,456 · +1.6%
- By 2040
- 746,689 · +3.8%
- By 2050
- 749,289 · +4.1%
- By 2075
- 736,227 · +2.3%
- By 2100
- 668,210 · -7.1%
Race, ethnicity, and origin ACS 2023
- Neighborhood character
- Diverse neighborhood (Simpson 0.57)
- Race & ethnicity
- White 59% Hispanic / Latino 28% Two or more races 14% Black 9% Native American 3%
- Hispanic origin (detail)
- Mexican 25%
- Common ancestry
- Italian 12% Lithuanian 3% Slovak 1%
- Foreign-born
- 12% · Canada, China
- Languages at home
- 78% English-only · Spanish 21%
Political lean MEDSL · Jackson
- 2024 margin
- D (+19.3) · D 58.9% · R 39.5% · Other 1.6%
- 2008→2024 swing
- -6.1pp toward R · 2008: 25.4pp · 2024: 19.3pp
- All cycles
- 2024: D+19.3 2020: D+22.0 2016: D+16.6 2012: D+19.0 2008: D+25.4
Not yet ingested
- Civics
- —
Market trends
- HPI YoY
- ▲ 52.69%
- Current HPI
- 347.9512
- Rent YoY
- —
- Metro
- Kansas City, MO-KS
- State GDP YoY
- ▲ 1.84%
- F500 in state
- 20
Industry mix (Fortune 500 HQ in MO)
| Industry | F500 HQs | Revenue |
|---|---|---|
| Healthcare | 1 | $163B |
|
||
| Insurance | 1 | $21B |
|
||
| Industrial Technology | 1 | $17B |
|
||
| Retail | 1 | $16B |
|
||
| Industrial Distribution | 1 | $10B |
|
||
| Utilities | 1 | $9B |
|
||
Price history
+1166.7% since first listed15 events — show timeline
- 2026-05-29 Listed $190,000 Heartland MLS as Distributed by MLS Grid
- 2025-05-16 Sold (Public Records) — Public Records
- 2025-05-13 Sold (MLS) — Heartland MLS as Distributed by MLS Grid
- 2025-04-02 Contingent — Heartland MLS as Distributed by MLS Grid
- 2025-03-07 Listed $149,000 Heartland MLS as Distributed by MLS Grid
- 2025-03-04 Listing Removed — Heartland MLS as Distributed by MLS Grid
- 2025-02-21 Price Changed $150,000 Heartland MLS as Distributed by MLS Grid
- 2024-12-03 Price Changed $155,000 Heartland MLS as Distributed by MLS Grid
- 2024-09-04 Listed $160,000 Heartland MLS as Distributed by MLS Grid
- 2010-12-03 Sold (Public Records) — Public Records
- 2010-11-10 Sold (MLS) — Heartland MLS as Distributed by MLS Grid
- 2010-09-27 Listed $15,000 Heartland MLS as Distributed by MLS Grid
- 2006-08-07 Sold (Public Records) — Public Records
- 2000-01-07 Sold (Public Records) — Public Records
- 1993-02-19 Sold (Public Records) — Public Records
Property tax history
+2.8%/yrLatest (2025): $974 · -30.7% YoY. Source: county tax records.
Cash-flow waterfall
monthlySold comps — $/sqft
last 12 mo · ≤1 miLoading sold comps…