2307 SW 15th St SW #1 · Deerfield Beach, FL
Flood risk 4/10 · Minor
- FEMA flood zone
- AH
- Chance of flooding over 30 yrs
- 0.2%
- Est. flood insurance / yr
- $1,142 – $2,507
Fire risk 1/10 · Minimal
- Est. fire insurance / yr
- $947 – $1,759
Heat risk 10/10 · Severe
- Hot days now (above 107°F)
- 7 days/yr
- Hot days in 30 yrs
- 28 days/yr
Wind risk 10/10 · Severe
- Chance of severe wind over 30 yrs
- 99.0%
Air-quality risk 2/10 · Minimal
- Unhealthy air days now
- 1 days/yr
- Unhealthy air days in 30 yrs
- 3 days/yr
Risk factors via First Street. Map © Google.
Why this score? — see what drove the D+ grade
The composite is a weighted blend of 9 inputs, each scored 0–100. Each bar is that input's sub-score; the figure is the points it added to the 100-point composite (weight × sub-score).
- Cash flow +15.1/30.0
- ARV discount +7.5/15.0
- 1% rule +5.2/10.0
- DSCR +4.6/10.0
- Schools +4.1/10.0
- Livability +3.8/5.0
- Rent growth +2.5/5.0
- Condition / age +2.5/5.0
- Appreciation +0.0/10.0
$265,000
🖨 Deal sheet 📄 Offer letter ✓ Due diligence
Listing remarks
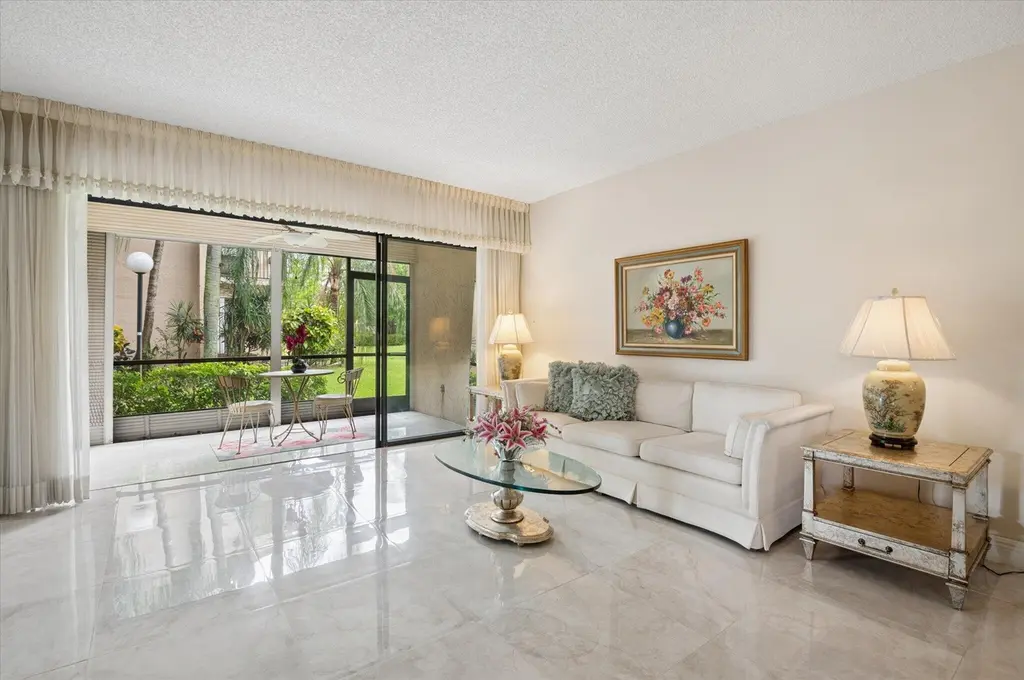
Welcome to Paradise! Spacious and beautifully updated three bedrooms and two bathrooms first-floor corner residence (third bedroom is open and currently used as an office) offers peaceful garden views in the highly desirable Meadowridge community, conveniently located near the clubhouse and pool. Freshly painted in modern neutral tones, this bright and inviting home features a crisp white kitchen, updated bathrooms, and tile flooring throughout for effortless Florida living. Relax and unwind on the screened-in patio, perfectly positioned to enjoy serene garden views. Ideally situated near pristine beaches, premier shopping, fine dining, and major highways, this exceptional residence offers
Key facts
- $446 HOA
- 2 parking spots
- Community pool
Property features AI
Finance
- Other: Directions: I-96 to left at Military Trail to left at SW 15th Street. Building is the first one on the left.
- Financial info: No land lease; Pets allowed (size limits apply); Community of 256 units
- HOA & community: Meadowridge Condo Association, Inc.; Quarterly HOA fee; HOA amenities include clubhouse, fitness center, pool (heated), billiard room, manager on site, parking, kitchen facilities, street lights, security, and more; HOA fee covers cable TV, insurance, grounds maintenance, security, sewer, trash, common areas, legal/accounting, reserve funds, and roof repairs
Exterior
- Parking: Assigned and guest parking; Open parking (paver block); Total of 2 parking spaces (including 1 open space)
- Security: Closed-circuit cameras; Key card entry; Security gate; Security patrol
- Utilities: Public water; Public sewer; Cable available; Water and sewer available
- Home design: Condominium; One level; Two-story building; Entry on level 1; Faces northeast; Resale condition
- Construction: Stucco and CBS construction; Aluminum roof; Block foundation; Built with 1,350 sq ft living area (public records)
- Exterior features: Cabana; Fenced; Paved road frontage; Publicly maintained road; Not waterfront
Interior
- Kitchen: Dishwasher; Disposal; Electric range / Electric cooktop; Microwave; Refrigerator; Freezer; Trash compactor
- Bedrooms: One bedroom on the main level
- Flooring: Marble; Tile
- Bathrooms: Two full bathrooms (one on the main level)
- Heating & cooling: Electric heating; Ceiling and paddle fans; Exhaust fan
- Interior features: Walk-in closets; Blinds and drapes
- Laundry & utility: In-unit laundry room with electric dryer hookup (inside)
Neighborhood map
What this means for you Summary
Snapshot
- This is a 3-bed/2.0-bath condo listed at $265k.
Deal economics
- At list price, monthly cash flow is $-65 ($-777/yr) — negative.
- To cash-flow at today's rent, offer at most $254k (4.3% below list).
- Meets the 1% rule at list price ($3k rent vs $265k).
- Recommended offer: $254k (4.3% below list) — sets the bar for cash-flow.
- Cap rate 6.7% vs local median 4.2% in Deerfield Beach — top-decile yield for the area; either an underpriced asset or a hidden risk that comps aren't pricing in. Stress-test before assuming the spread holds.
Location & tenants
- Location reads 75/100 on livability (#250 in FL, #3,970 nationally) — a middle-class / working-renter tenant base. Strengths: housing A+, health & safety A+, cost of living A; Watch: amenities D-, employment D-.
- Broward (suburban): math 42% / reading 53% proficiency, ranked #46 of 73 in FL (top 63%) — families likely to look elsewhere, expect single-tenant / working-renter base with shorter leases.
- Zoned schools: Park Ridge Elementary School (math 26% / reading 24%, grade F, #2,030 of 2,144 statewide, top 95%, 577 students, 79% FRL); Lyons Creek Middle School (math 49% / reading 53%, grade C, #237 of 571 statewide, top 43%, 1,757 students, 60% FRL); Deerfield Beach High School (math 12% / reading 37%, grade F, #505 of 667 statewide, top 79%, 2,251 students, 69% FRL) — zoned schools average 69% FRL vs 51% district-wide (18 pts higher); higher-poverty schools than district average — tighter screening recommended.
- Zoned-school proficiency averages 34% at this address vs 48% district-wide (-14 pts) — the specific schools serving this property underperform the Broward average; the district grade overstates school quality for this exact location.
- Market conditions: Rents flat; 586 active listings in the ZIP; 40 comparable units currently listed for rent nearby; rentals at typical pace (median 24d on market — plan ~3-4 weeks tenant-placement turnaround); 2,111 units permitted in Broward County in 2024 (1,265 in 5+ unit buildings).
- At $2,693/mo this rent would consume 61% of the median local household income ($53k/yr) (locally 2169% of renters already pay >50% of income on rent) — very limited rent-growth headroom before tenants either downsize or default.
Forward outlook
- Local home prices are declining (-3.0%/yr); year-one equity from $2k of loan paydown is wiped out by about $8k of value loss. Plan a longer hold.
- Broward County population projected at +34% by 2050 — long-run rental-demand tailwind backs the buy-and-hold thesis.
Negotiation context
- It's been on market 37 days — a 3% lower offer ($257k) is reasonable based on typical stale-listing flexibility.
Risks & watch-outs
- Watch-outs: flood insurance adds $152/mo.
- Climate carrying-cost: in FEMA flood zone AH (mandatory federal flood insurance); severe wind risk, 99% chance of damaging wind over 30y; extreme-heat days projected 7→28/yr by 2055 (HVAC capex compounding) — expect insurance premiums to compound above CPI over the hold.
Questions for the listing agent
- What do current leases actually rent for vs. the listed asking? Can we see a recent rent roll and the last 12 months of T-12 income?
- It's been on market 37 days. Have you received any prior offers? Is the seller open to a 4% concession, seller financing, or rate buy-down credit?
- What's the actual annual flood-insurance premium (NFIP or private), and is the property in a SFHA with mandatory coverage?
- What does the HOA fee cover, when was the last increase, and are there any pending special assessments or reserve-fund shortfalls?
- Any open or pending special assessments — roof, HVAC, plumbing, elevator, façade? What's the per-unit balance and payoff schedule, and is the seller paying it off at close or rolling it to the buyer?
- Is there a deadline driving the sale (1031 exchange, divorce, estate, relocation)? That informs how much negotiation room exists.
- Schools are D-rated, which usually means shorter tenancies and higher turnover. Who's the typical renter profile here, and what's been the actual vacancy rate?
- The area grade is low — what's the realistic commute time and amenity access for the typical tenant pool here? Any planned neighborhood developments (good or bad) we should know about?
- What's the average days-on-market for RENTAL listings here right now (not sales)? A rising rental-DOM trend means longer vacancies and softer asking-rent achievability than the comps imply.
- What's the recent tenant-quality profile in this submarket — average credit score on applications, eviction rate, late-payment / NSF rate, and stable-employment percentage? A property-management company in the area should have these aggregated.
- How much new apartment / multifamily construction is in the pipeline within 1–3 miles? Heavy new supply (>2% of stock underway) typically softens rents 12–24 months out; light construction supports rent growth.
Investment metrics
- 1% rule
- 1.02% ✓
- Cap rate
- 6.69%
- Cash-on-cash
- 1.41%
- DSCR
- 1.06
- GRM
- 8.2
CMA / ARV
No comps found within radius.
Projected returns pro-forma
-3.0% appreciation · 0.1% rent growth · sell at horizon
- IRR
- -21.9%
- Equity multiple
- 0.27×
- Total profit
- $-54,439
- Equity at exit
- $39,512
- IRR
- -27.6%
- Equity multiple
- -0.09×
- Total profit
- $-81,222
- Equity at exit
- $22,912
Cash invested: $74,200 (down + closing). Projections, not guarantees.
Landlord ↔ Tenant lean methodology
- Overall (STATE)
- 87 Strongly Landlord-Friendly
- State Florida
- 87 Strongly Landlord-Friendly · R+3
- County
- — inherits STATE
- City
- — inherits STATE
ZIP-level market 33442
- Rents YoY
- 0.1%
- Active inventory
- 586
- Price-to-rent
- 8.2×
Monthly cashflow live
- Estimated rent
- $2,693 high interval (Pro) →
- Mortgage (P&I)
- −$1,390
- Tax from tax record
- −$94 /mo · $1,133/yr
- Insurance
- −$110
- Flood insurance flood zone
- −$152 /mo · $1,824/yr
- HOA
- −$446
- Vacancy / Maint / Mgmt
- −$566
- Net cashflow
- $-65
Break-even live
UW: 25.0% down · 7.5% · 30yr · 1.5% tax · 5.0% vac · 8.0% maint · 8.0% mgmt
Financing live
Cash to close
- Down payment
- $66,250
- Closing costs
- $7,950
- Reserves months
- —
- Total cash needed
- —
Loan-product check · same deal, 3 products live
Conventional
25% down · 7.5% · 30yr
- Down + closing
- —
- Monthly P&I
- —
- Monthly cashflow
- —
- DSCR
- —
- Eligible?
- —
Personal DTI + credit; lowest rate.
DSCR
20% down · 8.5% · 30yr
- Down + closing
- —
- Monthly P&I
- —
- Monthly cashflow
- —
- DSCR
- —
- Eligible?
- —
No personal income docs; deal must DSCR.
Hard money
10% down · 12.0% · 12mo
- Down + closing
- —
- Monthly P&I
- —
- Monthly cashflow
- —
- DSCR
- —
- Eligible?
- —
Short-term bridge; refi at stabilization.
Rent comps 40 comps
| Address | Beds | Baths | Sqft | Rent | $/sqft | DOM | Units | Dist |
|---|---|---|---|---|---|---|---|---|
| 2355 SW 15th St Deerfield Beach, FL | 2.0 | 2.0 | 1100 | $2,098 | $1.91 | 24d | 2 | 0.10mi |
| 2265 SW 15th St #165 Deerfield Beach, FL | 3.0 | 2.0 | 1350 | $2,400 | $1.78 | 24d | 1 | 0.12mi |
| 1398 SW 24th Ter Deerfield Beach, FL | 3.0 | 2.0 | 1865 | $5,000 | $2.68 | 24d | 1 | 0.16mi |
| 2067 SW 15th St Deerfield Beach, FL | 2.0 | 2.0 | 1150 | $2,300 | $2.00 | 20d | 2 | 0.16mi |
| 1272 S Military Trl #313 Deerfield Beach, FL | 2.0 | 2.0 | 900 | $2,390 | $2.66 | 21d | 1 | 0.19mi |
| 2297 SW 15th St #122 Deerfield Beach, FL | 2.0 | 2.0 | 1200 | $2,200 | $1.83 | 12d | 1 | 0.19mi |
| 1266 S Military Trl Deerfield Beach, FL | 1.0–2.0 | 1.0–2.0 | 1050 | $2,550 | $2.43 | 21d | 2 | 0.23mi |
| 2217 Discovery Cir W Deerfield Beach, FL | 2.0 | 2.5 | 1429 | $2,400 | $1.68 | 14d | 1 | 0.27mi |
| 2246 Discovery Cir W Deerfield Beach, FL | 2.0 | 2.5 | 1300 | $2,650 | $2.04 | 24d | 1 | 0.29mi |
| 1929 SW 15th St #41 Deerfield Beach, FL | 2.0 | 2.0 | 1150 | $2,400 | $2.09 | 24d | 1 | 0.31mi |
| 5161 NW 11th Ln Deerfield Beach, FL | 3.0 | 2.0 | 1486 | $2,925 | $1.97 | 24d | 1 | 0.31mi |
| 5140 NW 11th Dr Deerfield Beach, FL | 3.0 | 2.0 | 1324 | $3,000 | $2.27 | 13d | 1 | 0.33mi |
| 2149 Discovery Cir W Unit 1 Deerfield Beach, FL | 2.0 | 2.5 | 1300 | $2,850 | $2.19 | 21d | 1 | 0.34mi |
| 1234 S Military Trl #1811 Deerfield Beach, FL | 2.0 | 2.0 | 1099 | $2,500 | $2.27 | 24d | 1 | 0.34mi |
| 1250 S Military Trl #1612 Deerfield Beach, FL | 2.0 | 1.5 | 1035 | $2,500 | $2.42 | 5d | 1 | 0.34mi |
| 1244 S Military Trl #724 Deerfield Beach, FL | 2.0 | 1.5 | 916 | $1,950 | $2.13 | 13d | 1 | 0.34mi |
| 2173 Discovery Cir W Deerfield Beach, FL | 2.0 | 2.0 | 1126 | $2,950 | $2.62 | 2d | 1 | 0.36mi |
| 2776 SW 15th St Deerfield Beach, FL | 2.0 | 2.5 | 1236 | $2,900 | $2.35 | 24d | 1 | 0.36mi |
| 1230 S Military Trl #2014 Deerfield Beach, FL | 2.0 | 2.0 | 937 | $2,400 | $2.56 | 24d | 1 | 0.40mi |
| 1230 S Military Trl #2014 Deerfield Beach, FL | 2.0 | 2.0 | 937 | $2,400 | $2.56 | 16d | 1 | 0.40mi |
| 1947 Discovery Cir E Deerfield Beach, FL | 2.0 | 2.0 | 1126 | $2,450 | $2.18 | 24d | 1 | 0.45mi |
| 2826 SW 12th St Deerfield Beach, FL | 2.0 | 2.5 | 1236 | $2,600 | $2.10 | 3d | 1 | 0.49mi |
| 671 Cypress Lake Blvd Unit D21 Deerfield Beach, FL | 3.0 | 2.0 | 974 | $2,250 | $2.31 | 11d | 1 | 0.50mi |
| 640 Cypress Club Way Unit G Pompano Beach, FL | 2.0 | 2.0 | 891 | $1,950 | $2.19 | 24d | 1 | 0.52mi |
| 661 Cypress Lake Blvd Unit I20 Deerfield Beach, FL | 3.0 | 2.0 | 974 | $2,250 | $2.31 | 1d | 1 | 0.54mi |
| 661 Cypress Lake Blvd Unit I20 Deerfield Beach, FL | 3.0 | 2.0 | 974 | $2,300 | $2.36 | 24d | 1 | 0.54mi |
| 1100 S Military Trl Deerfield Beach, FL | 2.0–3.0 | 1.0–2.0 | 1119 | $2,828 | $2.53 | 24d | 2 | 0.59mi |
| 1280 NW 49th St Deerfield Beach, FL | 3.0 | 2.0 | 1575 | $2,700 | $1.71 | 24d | 1 | 0.62mi |
| 2903 Waterford Dr N Deerfield Beach, FL | 2.0 | 2.5 | 1236 | $2,600 | $2.10 | 18d | 1 | 0.65mi |
| 551 NW 46th St Deerfield Beach, FL | 2.0 | 2.0 | 952 | $2,485 | $2.61 | 24d | 1 | 0.72mi |
| 4503 NW 6th Ave Deerfield Beach, FL | 3.0 | 2.0 | 1148 | $2,850 | $2.48 | 24d | 1 | 0.73mi |
| 4450 Military Trl Unit 22 Pompano Beach, FL | 2.0 | 1.0 | 940 | $1,950 | $2.07 | 24d | 1 | 0.83mi |
| 4325 NW 5th Ave Deerfield Beach, FL | 2.0 | 2.0 | 953 | $2,249 | $2.36 | 10d | 1 | 0.89mi |
| 4313 NW 6th Ave Deerfield Beach, FL | 3.0 | 2.0 | 1348 | $2,850 | $2.11 | 21d | 1 | 0.89mi |
| 1221 NW 44th St Deerfield Beach, FL | 3.0 | 2.0 | 1624 | $3,100 | $1.91 | 7d | 1 | 0.90mi |
| 4362 Veleiros Ave Pompano Beach, FL | 3.0 | 2.5 | 1628 | $3,700 | $2.27 | 24d | 1 | 0.90mi |
| 4321 NW 9th Ave #204 Deerfield Beach, FL | 2.0 | 2.0 | 1360 | $2,350 | $1.73 | 7d | 1 | 0.91mi |
| 4394 NW 9th Ave Unit 20-1A Deerfield Beach, FL | 2.0 | 2.0 | 950 | $1,700 | $1.79 | 24d | 1 | 0.92mi |
| 4354 NW 9th Ave Unit 12-3D Pompano Beach, FL | 2.0 | 2.0 | 1040 | $2,000 | $1.92 | 24d | 1 | 0.92mi |
| 4314 NW 9th Ave Deerfield Beach, FL | 1.0–2.0 | 1.5–2.0 | 992 | $1,940 | $1.95 | 14d | 2 | 0.92mi |
HOA detail condo
- Monthly dues
- $446 · $5,352/yr
- Likely covers
- pool
- Assessments
- None detected in remarks — confirm with the listing agent.
Listing history 14 events
-
2026-06-18days on market $265,000 Active 37 DOM
-
2026-06-17days on market $265,000 Active 36 DOM
-
2026-06-16days on market $265,000 Active 35 DOM
-
2026-06-15days on market $265,000 Active 34 DOM
-
2026-06-13days on market $265,000 Active 32 DOM
-
2026-06-09days on market $265,000 Active 28 DOM
-
2026-06-08pricedays on market $265,000 Active 27 DOM
-
2026-06-07days on market $275,000 Active 26 DOM
-
2026-06-04days on market $275,000 Active 23 DOM
-
2026-06-03days on market $275,000 Active 22 DOM
-
2026-06-02days on market $275,000 Active 21 DOM
-
2026-06-01days on market $275,000 Active 20 DOM
-
2026-05-31days on market $275,000 Active 19 DOM
-
2026-05-12$275,000 Active
ⓘ Source: listings_history table (triggers on properties + properties_extension) + one-shot
backfill from property_details.listing_events for pre-trigger history.
Tax reassessment forecast FL · Resets to sale price
- Current annual tax
- $1,133 · $94/mo
- Projected year-2 tax
- $2,200 · $183/mo
- Expected delta
- +$1,066/yr (+$89/mo · 94.1%)
ⓘ Screening estimate from a state-policy table — verify with the county assessor before closing.
Climate risk First Street
- Flood 4/10 Moderate FEMA zone AH · 20% chance over 30 yrs
- Wildfire 1/10 Low
- Heat 10/10 Extreme 7 d/yr ≥107°F today · 28 d/yr by 30 yrs out
- Wind 10/10 Extreme 99% chance of damaging wind over 30 yrs
- Air quality 2/10 Low 1 unhealthy d/yr today · 3 by 30 yrs out
Nearby sold comps map
Loading sold comps map…
Walkable amenities ~0.75 mi
Loading nearby amenities…
Taxation est. · year 1
- Rental income
- $32,322
- − Mortgage interest
- −$14,844
- − Property taxes
- −$1,133
- − Insurance
- −$3,150
- − Repairs & maintenance
- −$2,586
- − Management
- −$2,586
- − HOA
- −$5,352
- − Depreciation
- −$7,709
- Taxable loss
- −$5,038
- Est. tax savings @ 24.0%
- +$1,209
- After-tax cash flow
- $432/yr
For passive investors: Depreciation is non-cash, so a rental often shows a tax loss while cash-flowing — sheltering income. Rental losses are passive: they offset passive income freely, and up to $25,000/yr can offset ordinary (W-2) income if you actively participate and your MAGI is under $100k (phasing out to $0 by $150k); unused losses carry forward. On sale, claimed depreciation is recaptured at up to 25%, and gains may owe capital-gains tax (a 1031 exchange can defer both). Figures are a year-1 estimate at your 24.0% rate — not tax advice; consult a CPA.
Schools (NCES district)
- District
- Broward
- NCES district ID
- 1200180
- Math proficiency
- 42% ▼ -18.00%
- Reading proficiency
- 53% ▼ -5.00%
- Median HH income
- $52,139
- Composite
- 40.88/100
- National rank
- #3621
- State rank
- #46 of 73 in FL
Livability — Deerfield Beach
- Score
- 75/100
- State rank
- #250
- US rank
- #3970
Category grades
Schools grade is shown separately in the Schools card above.
Census & demographics
- Census place
- Deerfield Beach, FL
- County
- Broward County · 1,963,430 people
- City population
- 61,449
- Metro
- Miami-Fort Lauderdale-Pompano Beach, FL
- Population (ZIP)
- 31,296
- Household income
- $53,254
- Rent vs Own
- Severe rent burden
- 2169.0
Population outlook (Broward County) Hauer SSP2
- Today (2025)
- 2,207,033 people
- By 2030
- 2,360,704 · +7.0%
- By 2040
- 2,661,208 · +20.6%
- By 2050
- 2,946,698 · +33.5%
- By 2075
- 3,602,273 · +63.2%
- By 2100
- 3,970,984 · +79.9%
Race, ethnicity, and origin ACS 2023
- Neighborhood character
- Diverse neighborhood (Simpson 0.61)
- Race & ethnicity
- White 57% Hispanic / Latino 23% Two or more races 19% Black 10% Asian 2%
- Hispanic origin (detail)
- Mexican 1% Puerto Rican 4% Cuban 3%
- Common ancestry
- Estonian 7% Romanian 4% Hispanic 3%
- Foreign-born
- 34% · Canada, Jamaica, Dominican Republic
- Languages at home
- 59% English-only · Spanish 20% Other Indo-European 13% French/Haitian/Cajun 4%
Political lean MEDSL · Broward
- 2024 margin
- D (+17.0) · D 58.0% · R 41.0%
- 2008→2024 swing
- -17.8pp toward R · 2008: 34.7pp · 2024: 17.0pp
- All cycles
- 2024: D+17.0 2020: D+29.8 2016: D+35.0 2012: D+34.9 2008: D+34.7
Not yet ingested
- Civics
- —
Market trends
- HPI YoY
- ▼ -280.44%
- Current HPI
- 323.0166
- Rent YoY
- ▲ 0.10%
- Metro
- Miami-Fort Lauderdale-Pompano Beach, FL
- State GDP YoY
- ▲ 3.28%
- F500 in state
- 36
Industry mix (Fortune 500 HQ in FL)
| Industry | F500 HQs | Revenue |
|---|---|---|
| Industrial Technology | 2 | $29B |
|
||
| Insurance | 2 | $17B |
|
||
| Retail | 1 | $60B |
|
||
| Technology Distribution | 1 | $58B |
|
||
| Homebuilding | 1 | $35B |
|
||
| Technology Manufacturing | 1 | $35B |
|
||
Price history
1 event — show timeline
- 2026-05-12 Listed $275,000 Beaches MLS
Property tax history
+2.9%/yrLatest (2025): $1,133 · +7.2% YoY. Source: county tax records.
Cash-flow waterfall
monthlySold comps — $/sqft
last 12 mo · ≤1 miLoading sold comps…