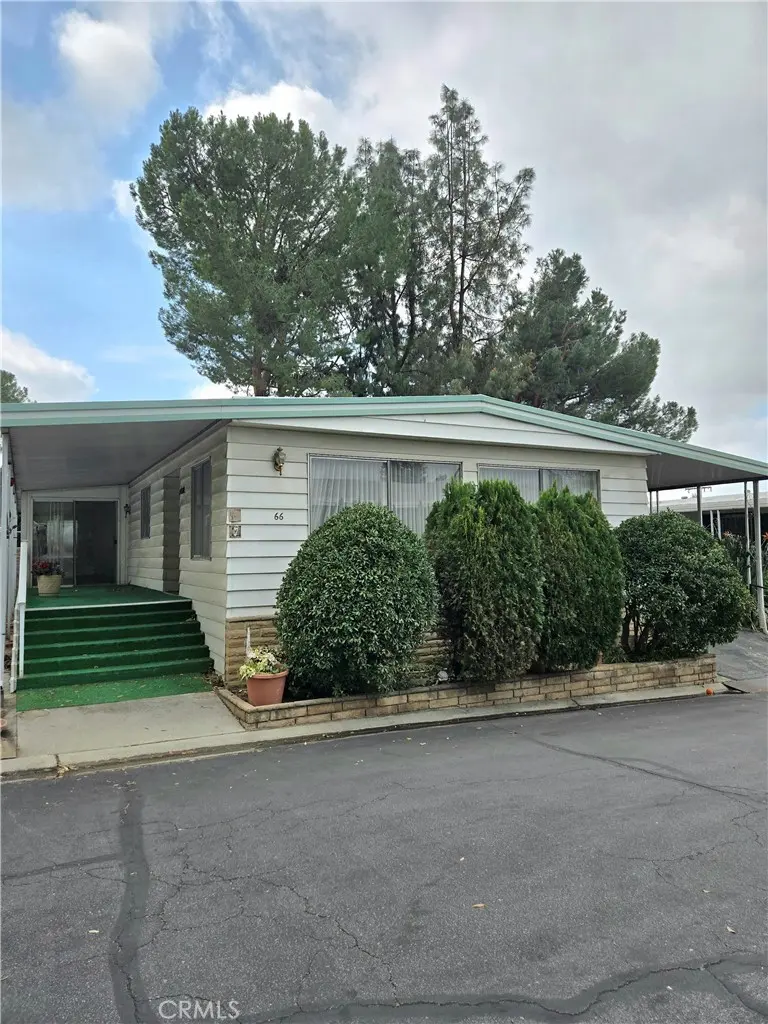
3850 Atlantic #66 · San Bernardino, CA
Flood risk 1/10 · Minimal
- FEMA flood zone
- X (unshaded)
- Chance of flooding over 30 yrs
- 0.0%
- Est. flood insurance / yr
- $507 – $1,088
Fire risk 9/10 · Severe
- Est. fire insurance / yr
- $659 – $1,223
Heat risk 8/10 · Major
- Hot days now (above 101°F)
- 5 days/yr
- Hot days in 30 yrs
- 13 days/yr
Wind risk 1/10 · Minimal
- Chance of severe wind over 30 yrs
- —
Air-quality risk 10/10 · Severe
- Unhealthy air days now
- 29 days/yr
- Unhealthy air days in 30 yrs
- 35 days/yr
Risk factors via First Street. Map © Google.
Why this score? — see what drove the B+ grade
The composite is a weighted blend of 9 inputs, each scored 0–100. Each bar is that input's sub-score; the figure is the points it added to the 100-point composite (weight × sub-score).
- Cash flow +30.0/30.0
- ARV discount +15.0/15.0
- 1% rule +10.0/10.0
- DSCR +10.0/10.0
- Rent growth +3.2/5.0
- Schools +3.1/10.0
- Livability +3.0/5.0
- Condition / age +2.2/5.0
- Appreciation +0.0/10.0
$69,000
🖨 Deal sheet 📄 Offer letter ✓ Due diligence
Listing remarks MLS
Spacious 2-Bedroom Mobile Home in Desirable 55+ Community – Great Fixer Opportunity! Bring your vision and make this large 2-bedroom, 2-bath mobile home your own! This home offers a fantastic opportunity for someone looking to add their personal touch and build equity. Inside you’ll find a generous floor plan with spacious living areas, a large primary bedroom, and a bonus room. With a little TLC and updating, this home has the potential to truly shine. Situated in the beautiful, well-maintained Highland park, Valencia Lea, residents enjoy access to a variety of amenities including a clubhouse, pool, social activities, and beautifully landscaped common areas. The community is known for its friendly atmosphere and convenient location close to shopping, dining, and local services. If you’re looking for an affordable home in a great community and aren’t afraid to put in a little work, this could be the perfect opportunity! Don’t miss the chance to turn this diamond in the rough into something special!
Key facts
- Clubhouse
- Bonus room
- Pool
Tags
Neighborhood map
What this means for you Summary
Snapshot
- This is a 2-bed/2.0-bath manufactured listed at $69k. Condition is rated fair.
Deal economics
- At list price, monthly cash flow is $1k ($18k/yr) — positive.
- The deal already cash-flows at list — no discount required.
- Meets the 1% rule at list price ($2k rent vs $69k).
- Recommended offer: $65k (6.0% below list) — sets the bar for market timing.
- Cap rate 32.2% vs local median 3.5% in San Bernardino — top-decile yield for the area; either an underpriced asset or a hidden risk that comps aren't pricing in. Stress-test before assuming the spread holds.
Location & tenants
- Location reads 59/100 on livability (#661 in CA) — a working-class tenant base; expect higher turnover. Strengths: commute A+, housing A; Watch: schools D, employment D, crime F.
- San Bernardino City Unified (urban): math 27% / reading 40% proficiency, ranked #959 of 1,400 in CA (top 68%) — families likely to look elsewhere, expect single-tenant / working-renter base with shorter leases; 81% free/reduced lunch — lower-income household profile, screen leases tightly.
- Market conditions: Rents rising (+2.9%/yr); 147 active listings in the ZIP; 12 comparable units currently listed for rent nearby; rentals lingering (median 44d on market — plan ~5-8 weeks vacancy on turnover, expect pricing pressure); 50% of comp listings sitting > 30 days — soft ceiling on asking rent; solid renter incomes; 5,458 units permitted in San Bernardino County in 2024 (1,500 in 5+ unit buildings).
- This rent runs 35% of the median local income ($85k/yr) — at the standard rent-burdened threshold; future hikes will face affordability resistance.
Forward outlook
- Local home prices are declining (-3.0%/yr); year-one equity from $477 of loan paydown is wiped out by about $2k of value loss. Plan a longer hold.
- San Bernardino County population projected at +15% by 2050 — modest demand growth; plan on rents tracking national, not racing it.
- At projected returns (-3.0% appreciation + 2.9% rent growth), your $19k cash investment doubles in ~2 years — after that, you're playing with house money.
Negotiation context
- It's been on market 77 days — a 6% lower offer ($65k) is reasonable based on typical stale-listing flexibility.
Risks & watch-outs
- Climate carrying-cost: severe wildfire risk; extreme-heat days projected 5→13/yr by 2055 (HVAC capex compounding) — expect insurance premiums to compound above CPI over the hold.
Questions for the listing agent
- It's been on market 77 days. Have you received any prior offers? Is the seller open to a 6% concession, seller financing, or rate buy-down credit?
- Have any recent inspections been done? Can we get a copy of the seller's disclosures and any deferred-maintenance estimates?
- Built in 1972 — when were the roof, HVAC, electrical panel, plumbing, and water heater last replaced?
- Why hasn't it sold? Are there any deal-killer items the seller is aware of (foundation, flood, title, zoning, code violations)?
- Is there a deadline driving the sale (1031 exchange, divorce, estate, relocation)? That informs how much negotiation room exists.
- Schools are D-rated, which usually means shorter tenancies and higher turnover. Who's the typical renter profile here, and what's been the actual vacancy rate?
- Crime grade is F in this area — have there been break-ins, vandalism, or insurance claims at this property in the last 3 years? What carrier currently insures it and at what premium?
- What's the average days-on-market for RENTAL listings here right now (not sales)? A rising rental-DOM trend means longer vacancies and softer asking-rent achievability than the comps imply.
- What's the recent tenant-quality profile in this submarket — average credit score on applications, eviction rate, late-payment / NSF rate, and stable-employment percentage? A property-management company in the area should have these aggregated.
- How much new for-sale + rental construction is in the pipeline within 1–3 miles? Heavy new supply typically softens prices + rents 12–24 months out; constrained supply supports both.
Investment metrics
- 1% rule
- 3.61% ✓
- Cap rate
- 32.20%
- Cash-on-cash
- 92.53%
- DSCR
- 5.12
- GRM
- 2.3
CMA / ARV
- ARV (median comp)
- $122,412
- List price
- $69,000
- Delta
- -43.63%
- Verdict
- UNDERPRICED
- Comps
- 20 within 1.0 mi
Show comp detail 12 sales within ~0.75 mi
| Address | Dist | Beds/Ba | Sqft | Sold | Price | $/sf | Match |
|---|---|---|---|---|---|---|---|
| 3850 Atlantic Ave #212 | 0.00mi | 2/2.0 | 1,440 (0%) | 1mo | $145,000 | $101 | 100 |
| 3850 Atlantic #260 | 0.00mi | 2/2.0 | 1,440 (0%) | 2mo | $85,000 | $59 | 98 |
| 3850 Atlantic Ave #276 | 0.09mi | 2/2.0 | 1,440 (0%) | 0mo | $102,500 | $71 | 96 |
| 3850 Atlantic Ave #207 | 0.09mi | 2/2.0 | 1,428 (-1%) | 1mo | $208,000 | $146 | 94 |
| 3850 Atlantic Ave #287 | 0.09mi | 2/2.0 | 1,440 (0%) | 2mo | $200,000 | $139 | 94 |
| 3850 E Atlantic Ave #284 | 0.09mi | 2/2.0 | 1,440 (0%) | 3mo | $159,900 | $111 | 94 |
| 3850 Atlantic Ave #274 | 0.00mi | 2/2.0 | 1,344 (-7%) | 5mo | $133,000 | $99 | 85 |
| 3850 Atlantic Ave #189 | 0.09mi | 2/2.0 | 1,344 (-7%) | 2mo | $90,000 | $67 | 83 |
| 3850 Atlantic Ave #151 | 0.01mi | 2/2.0 | 1,600 (+11%) | 1mo | $90,000 | $56 | 80 |
| 4040 Piedmont Dr #283 | 0.69mi | 2/2.0 | 1,560 (+8%) | 1mo | $144,500 | $93 | 53 |
| 4040 E Piedmont Dr #300 | 0.69mi | 3/2.0 (+1) | 1,536 (+7%) | 0mo | $120,000 | $78 | 51 |
| 4040 Piedmont Dr #324 | 0.69mi | 3/2.0 (+1) | 1,646 (+14%) | 2mo | $225,400 | $137 | 37 |
Match score weights: distance 35% · size 25% · config 20% · recency 20%. Top-matched comps best support the ARV.
Projected returns pro-forma
-3.0% appreciation · 2.91% rent growth · sell at horizon
- IRR
- 93.2%
- Equity multiple
- 5.32×
- Total profit
- $83,516
- Equity at exit
- $10,288
- IRR
- 96.0%
- Equity multiple
- 11.05×
- Total profit
- $194,134
- Equity at exit
- $5,966
Cash invested: $19,320 (down + closing). Projections, not guarantees.
Landlord ↔ Tenant lean methodology
- Overall (STATE)
- 18 Strongly Tenant-Friendly
- State California
- 18 Strongly Tenant-Friendly · D+13
- County
- — inherits STATE
- City
- — inherits STATE
ZIP-level market 92346
- Rents YoY
- 2.9%
- Active inventory
- 147
- Price-to-rent
- 2.3×
Monthly cashflow live
- Estimated rent
- $2,489 high interval (Pro) →
- Mortgage (P&I)
- −$362
- Tax est. 1.5%
- −$86 /mo · $1,035/yr
- Insurance
- −$29
- HOA
- −$0
- Vacancy / Maint / Mgmt
- −$523
- Net cashflow
- $1,490
Break-even live
UW: 25.0% down · 7.5% · 30yr · 1.5% tax · 5.0% vac · 8.0% maint · 8.0% mgmt
Financing live
Cash to close
- Down payment
- $17,250
- Closing costs
- $2,070
- Reserves months
- —
- Total cash needed
- —
Loan-product check · same deal, 3 products live
Conventional
25% down · 7.5% · 30yr
- Down + closing
- —
- Monthly P&I
- —
- Monthly cashflow
- —
- DSCR
- —
- Eligible?
- —
Personal DTI + credit; lowest rate.
DSCR
20% down · 8.5% · 30yr
- Down + closing
- —
- Monthly P&I
- —
- Monthly cashflow
- —
- DSCR
- —
- Eligible?
- —
No personal income docs; deal must DSCR.
Hard money
10% down · 12.0% · 12mo
- Down + closing
- —
- Monthly P&I
- —
- Monthly cashflow
- —
- DSCR
- —
- Eligible?
- —
Short-term bridge; refi at stabilization.
Rent comps 12 comps
| Address | Beds | Baths | Sqft | Rent | $/sqft | DOM | Units | Dist |
|---|---|---|---|---|---|---|---|---|
| 3532 Rainbow Ln Highland, CA | 2.0 | 1.0 | 882 | $2,100 | $2.38 | 1d | 1 | 0.39mi |
| 3495 21st St Unit B Highland, CA | 2.0 | 2.0 | 1000 | $2,000 | $2.00 | 43d | 1 | 0.41mi |
| 2223 N Oakridge Ct Highland, CA | 3.0 | 2.5 | 1600 | $4,300 | $2.69 | 43d | 1 | 0.43mi |
| 6787 Cole Ave Highland, CA | 2.0–3.0 | 2.0 | 1005 | $2,125 | $2.11 | 1d | 1 | 0.44mi |
| 3479 20th St Highland, CA | 2.0 | 1.0 | 882 | $1,995 | $2.26 | 43d | 1 | 0.44mi |
| 3317 Highland Ave Highland, CA | 3.0 | 2.0 | 1250 | $2,000 | $1.60 | 24d | 1 | 0.62mi |
| 1991 Central Ave Highland, CA | 2.0 | 3.0 | 1312 | $2,500 | $1.91 | 43d | 1 | 0.78mi |
| 26814 Mansfield St Highland, CA | 3.0 | 1.0 | 1275 | $2,850 | $2.24 | 43d | 1 | 1.01mi |
| 7257 Wakefield Ct Highland, CA | 3.0 | 2.0 | 1183 | $2,395 | $2.02 | 24d | 1 | 1.22mi |
| 27531 Temple St Highland, CA | 3.0 | 2.0 | 1144 | $2,650 | $2.32 | 10d | 1 | 1.31mi |
| 7219 Seville Ave Highland, CA | 3.0 | 2.0 | 1843 | $3,000 | $1.63 | 43d | 1 | 1.33mi |
| 7219 Seville Ave Highland, CA | 3.0 | 2.0 | 1843 | $3,000 | $1.63 | 24d | 1 | 1.33mi |
Listing history 2 events
-
2026-05-04price $69,000 1051-char remark
Show marketing remark (1051 chars)
Spacious 2-Bedroom Mobile Home in Desirable 55+ Community – Great Fixer Opportunity! Bring your vision and make this large 2-bedroom, 2-bath mobile home your own! This home offers a fantastic opportunity for someone looking to add their personal touch and build equity. Inside you’ll find a generous floor plan with spacious living areas, a large primary bedroom, and a bonus room. With a little TLC and updating, this home has the potential to truly shine. Situated in the beautiful, well-maintained Highland park, Valencia Lea, residents enjoy access to a variety of amenities including a clubhouse, pool, social activities, and beautifully landscaped common areas. The community is known for its friendly atmosphere and convenient location close to shopping, dining, and local services. If you’re looking for an affordable home in a great community and aren’t afraid to put in a little work, this could be the perfect opportunity! Don’t miss the chance to turn this diamond in the rough into something special!
-
2026-03-10$77,000 Active 1051-char remark
Show marketing remark (1051 chars)
Spacious 2-Bedroom Mobile Home in Desirable 55+ Community – Great Fixer Opportunity! Bring your vision and make this large 2-bedroom, 2-bath mobile home your own! This home offers a fantastic opportunity for someone looking to add their personal touch and build equity. Inside you’ll find a generous floor plan with spacious living areas, a large primary bedroom, and a bonus room. With a little TLC and updating, this home has the potential to truly shine. Situated in the beautiful, well-maintained Highland park, Valencia Lea, residents enjoy access to a variety of amenities including a clubhouse, pool, social activities, and beautifully landscaped common areas. The community is known for its friendly atmosphere and convenient location close to shopping, dining, and local services. If you’re looking for an affordable home in a great community and aren’t afraid to put in a little work, this could be the perfect opportunity! Don’t miss the chance to turn this diamond in the rough into something special!
ⓘ Source: listings_history table (triggers on properties + properties_extension) + one-shot
backfill from property_details.listing_events for pre-trigger history.
Climate risk First Street
- Flood 1/10 Low FEMA zone X (unshaded) · 0% chance over 30 yrs
- Wildfire 9/10 Extreme
- Heat 8/10 Severe 5 d/yr ≥101°F today · 13 d/yr by 30 yrs out
- Wind 1/10 Low
- Air quality 10/10 Extreme 29 unhealthy d/yr today · 35 by 30 yrs out
Nearby sold comps map
Loading sold comps map…
Walkable amenities ~0.75 mi
Loading nearby amenities…
Taxation est. · year 1
- Rental income
- $29,873
- − Mortgage interest
- −$3,865
- − Property taxes
- −$1,035
- − Insurance
- −$345
- − Repairs & maintenance
- −$2,390
- − Management
- −$2,390
- − Depreciation
- −$2,007
- Taxable income
- $17,841
- Est. tax owed @ 24.0%
- −$4,282
- After-tax cash flow
- $13,596/yr
For passive investors: Depreciation is non-cash, so a rental often shows a tax loss while cash-flowing — sheltering income. Rental losses are passive: they offset passive income freely, and up to $25,000/yr can offset ordinary (W-2) income if you actively participate and your MAGI is under $100k (phasing out to $0 by $150k); unused losses carry forward. On sale, claimed depreciation is recaptured at up to 25%, and gains may owe capital-gains tax (a 1031 exchange can defer both). Figures are a year-1 estimate at your 24.0% rate — not tax advice; consult a CPA.
Condition & rehab AI · 12 photos
This mobile home requires moderate repairs and updates to improve its condition and value. Exterior and interior paint, HVAC replacement, and kitchen/bathroom updates are recommended.
Repairs flagged
- Major exterior siding — Significant wear and tear
- Major interior paint — Peeling and worn
- Major HVAC units — Visible rust and wear
Value-add opportunities
- Both exterior paint and siding — Enhances curb appeal and value
- Both HVAC replacement — Improves comfort and energy efficiency
- Both kitchen and bathroom updates — Modernizes spaces and adds value
Renovation cost estimate screening
| Repair item | Severity | Est. cost |
|---|---|---|
| exterior siding · Significant wear and tear | Major | $15,000–50,000 |
| interior paint · Peeling and worn | Major | $15,000–50,000 |
| HVAC units · Visible rust and wear | Major | $15,000–50,000 |
| Total estimated repair cost · 3 items | $45,000–150,000 |
Value-add ROI direction
- Both exterior paint and siding — Enhances curb appeal and value ↑
- Both HVAC replacement — Improves comfort and energy efficiency ↑
- Both kitchen and bathroom updates — Modernizes spaces and adds value ↑
ⓘ Cost ranges are severity-bucket heuristics (US national rule-of-thumb). Get contractor quotes + a written scope before underwriting a rehab budget.
Schools (NCES district)
- District
- San Bernardino City Unified
- NCES district ID
- 0634170
- Math proficiency
- 27% ▲ 1.00%
- Reading proficiency
- 40% ▬ 0.00%
- Median HH income
- $39,758
- Composite
- 30.8/100
- National rank
- #11385
- State rank
- #959 of 1400 in CA
Livability — San Bernardino
- Score
- 59/100
- State rank
- #661
- US rank
- #20479
Category grades
Schools grade is shown separately in the Schools card above.
Census & demographics
- Census place
- San Bernardino, CA
- County
- San Bernardino County · 2,030,291 people
- City population
- 255,614
- Metro
- Riverside-San Bernardino-Ontario, CA
- Population (ZIP)
- 56,179
- Household income
- $85,163
- Rent vs Own
- Severe rent burden
- 1816.0
Population outlook (San Bernardino County) Hauer SSP2
- Today (2025)
- 2,300,329 people
- By 2030
- 2,378,907 · +3.4%
- By 2040
- 2,523,137 · +9.7%
- By 2050
- 2,642,388 · +14.9%
- By 2075
- 2,880,769 · +25.2%
- By 2100
- 2,909,436 · +26.5%
Race, ethnicity, and origin ACS 2023
- Neighborhood character
- Diverse neighborhood (Simpson 0.63)
- Race & ethnicity
- Hispanic / Latino 53% White 26% Two or more races 14% Black 8% Asian 8% Native American 1%
- Hispanic origin (detail)
- Mexican 46%
- Common ancestry
- Italian 1% Iranian 1% Lithuanian 1%
- Foreign-born
- 19% · Canada, Vietnam, South Korea
- Languages at home
- 60% English-only · Spanish 32% Vietnamese 2% Tagalog/Filipino 2%
Political lean MEDSL · San Bernardino
- 2024 margin
- Toss-up / Even · D 47.5% · R 49.7% · Other 2.8%
- 2008→2024 swing
- -8.5pp toward R · 2008: 6.3pp · 2024: -2.1pp
- All cycles
- 2024: R+2.1 2020: D+10.7 2016: D+9.8 2012: D+5.4 2008: D+6.3
Not yet ingested
- Civics
- —
Market trends
- HPI YoY
- ▼ -328.00%
- Current HPI
- 367.2829
- Rent YoY
- ▲ 2.91%
- Metro
- Riverside-San Bernardino-Ontario, CA
- State GDP YoY
- ▲ 3.21%
- F500 in state
- 116
Industry mix (Fortune 500 HQ in CA)
| Industry | F500 HQs | Revenue |
|---|---|---|
| Technology | 27 | $1,492B |
|
||
| Financial Services | 3 | $174B |
|
||
| Retail | 3 | $44B |
|
||
| Insurance | 3 | $26B |
|
||
| Media / Entertainment | 2 | $115B |
|
||
| Pharmaceuticals / Biotech | 2 | $62B |
|
||
Price history
-10.4% since first listed2 events — show timeline
- 2026-05-04 Price Changed $69,000 CRMLS
- 2026-03-10 Listed $77,000 CRMLS
Cash-flow waterfall
monthlySold comps — $/sqft
last 12 mo · ≤1 miLoading sold comps…