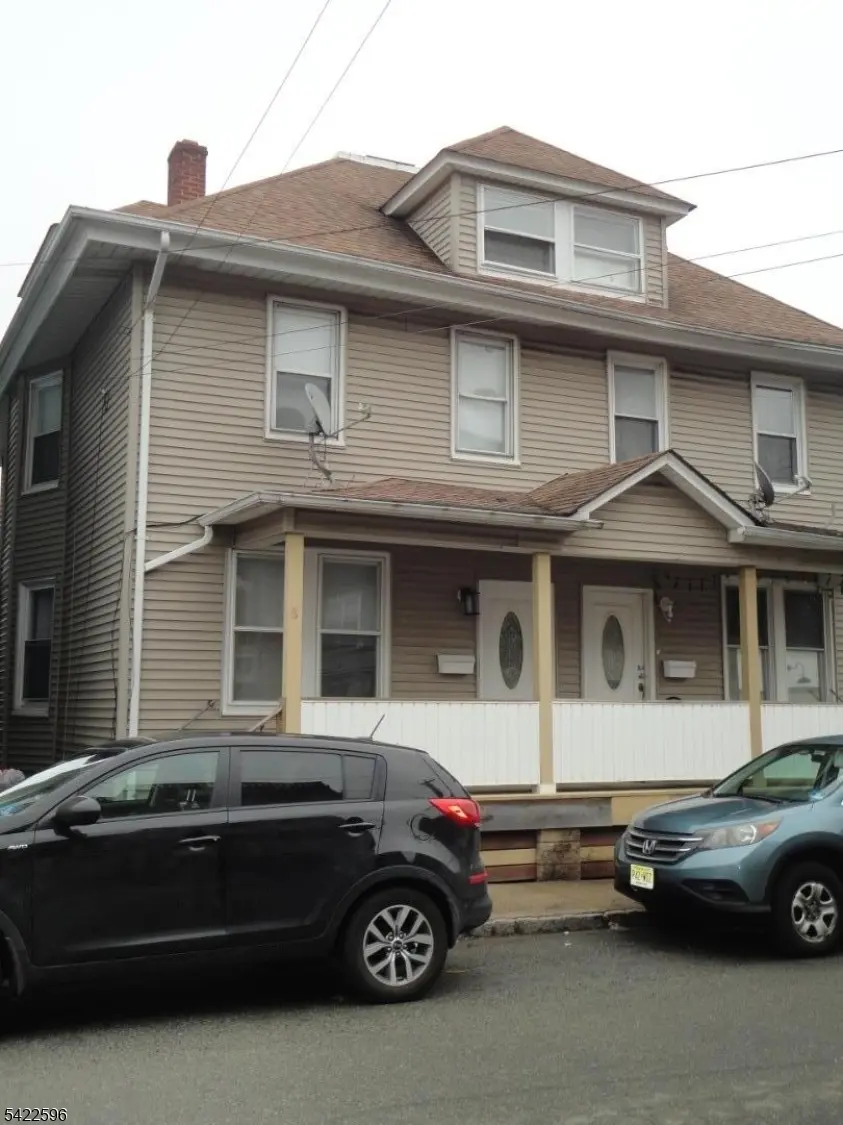
8 N Salem St · Dover, NJ
Flood risk 7/10 · Major
- FEMA flood zone
- —
- Chance of flooding over 30 yrs
- 0.97%
- Est. flood insurance / yr
- —
Fire risk 1/10 · Minimal
- Est. fire insurance / yr
- $526 – $976
Heat risk 5/10 · Moderate
- Hot days now (above 96°F)
- 7 days/yr
- Hot days in 30 yrs
- 16 days/yr
Wind risk 4/10 · Minor
- Chance of severe wind over 30 yrs
- 20.0%
Air-quality risk 3/10 · Minor
- Unhealthy air days now
- 2 days/yr
- Unhealthy air days in 30 yrs
- 3 days/yr
Risk factors via First Street. Map © Google.
Why this score? — see what drove the D grade
The composite is a weighted blend of 9 inputs, each scored 0–100. Each bar is that input's sub-score; the figure is the points it added to the 100-point composite (weight × sub-score).
- Cash flow +11.5/30.0
- ARV discount +7.5/15.0
- Appreciation +5.0/10.0
- Livability +3.9/5.0
- DSCR +3.4/10.0
- 1% rule +3.3/10.0
- Condition / age +2.8/5.0
- Rent growth +2.5/5.0
- Schools +2.3/10.0
$349,900
🖨 Deal sheet 📄 Offer letter ✓ Due diligence
Listing remarks
HURRY! This 2-story attached home has been well-maintained and is ready for a new owner. There are 3 good-sized bedrooms, 1 full bathroom, and a possible 4th bedroom could be added. Also, features a full basement, with a newer furnace and hot water heater. This property is great for a first-time buyer or someone looking to downsized and it's conveniently located near all shopping stores. The seller is motivated, and we will entertain all reasonable offers. Call NOW to schedule your private tour.
Key facts
- Newer furnace
- Hot water heater
- Full basement
Tags
Property features AI
Finance
- Other: Pets allowed: cats and dogs
Exterior
- Parking: On-street parking (no garage)
- Utilities: Public water; Public sewer; Electric service; Natural gas service; Cable TV available
- Home design: 1/2 duplex, end-unit townhouse
- Construction: Vinyl siding; Asphalt shingle roof; Year built: approximate
- Exterior features: Open porch(es)
Interior
- Kitchen: Refrigerator included
- Bedrooms: Three bedrooms on the second floor
- Flooring: Tile flooring; Wood flooring
- Bathrooms: One full bathroom
- Heating & cooling: Hot water/baseboard heating (cast iron); Natural gas heating; Window A/C units
- Interior features: High ceilings; Has basement (full, unfinished) with Bilco-style door; Eat-in kitchen
- Laundry & utility: Basement laundry room; Utility room in basement; Gas water heater
Neighborhood map
What this means for you Summary
Snapshot
- This is a 3-bed/1.0-bath townhouse listed at $350k. Condition is rated average.
Deal economics
- At list price, monthly cash flow is $-116 ($-1k/yr) — negative.
- To cash-flow at today's rent, offer at most $333k (4.8% below list).
- To meet the 1% rule (rent ≥ 1% of price), the offer needs to be $291k (16.7% below list).
- Recommended offer: $291k (16.7% below list) — sets the bar for 1% rule.
Location & tenants
- Location reads 78/100 on livability (#94 in NJ, #2,430 nationally) — a middle-class / working-renter tenant base. Strengths: commute A+, health & safety A+, crime A-; Watch: schools C-, amenities F, cost of living F.
- Dover Public School District (suburban): math 16% / reading 35% proficiency, ranked #380 of 472 in NJ (top 80%) — low school quality limits family demand, transient renter base, plan for 1-2y turnover; 62% free/reduced lunch — lower-income household profile, screen leases tightly.
- Market conditions: 1 active listings in the ZIP; 5 comparable units currently listed for rent nearby; rentals leasing fast (median 1d on market — plan ~1-2 weeks tenant-placement turnaround); 2,357 units permitted in Morris County in 2024 (1,496 in 5+ unit buildings).
Forward outlook
- In year one you build about $13k of equity ($2k loan paydown + $10k appreciation (3.0% local appreciation)).
- Morris County population projected at +6% by 2050 — modest demand growth; plan on rents tracking national, not racing it.
- By year 3, paydown + projected appreciation supports a ~$32k cash-out refi (75% LTV) — recoverable capital for the next deal without selling this one.
Negotiation context
- It's been on market 72 days — a 6% lower offer ($329k) is reasonable based on typical stale-listing flexibility.
Risks & watch-outs
- Watch-outs: built in 1925 — expect roof / HVAC / electrical / plumbing capex.
- Climate carrying-cost: major flood risk; extreme-heat days projected 7→16/yr by 2055 (HVAC capex compounding) — expect insurance premiums to compound above CPI over the hold.
Questions for the listing agent
- What do current leases actually rent for vs. the listed asking? Can we see a recent rent roll and the last 12 months of T-12 income?
- It's been on market 72 days. Have you received any prior offers? Is the seller open to a 17% concession, seller financing, or rate buy-down credit?
- Built in 1925 — when were the roof, HVAC, electrical panel, plumbing, and water heater last replaced?
- Why hasn't it sold? Are there any deal-killer items the seller is aware of (foundation, flood, title, zoning, code violations)?
- Is there a deadline driving the sale (1031 exchange, divorce, estate, relocation)? That informs how much negotiation room exists.
- The area grade is low — what's the realistic commute time and amenity access for the typical tenant pool here? Any planned neighborhood developments (good or bad) we should know about?
- What's the average days-on-market for RENTAL listings here right now (not sales)? A rising rental-DOM trend means longer vacancies and softer asking-rent achievability than the comps imply.
- What's the recent tenant-quality profile in this submarket — average credit score on applications, eviction rate, late-payment / NSF rate, and stable-employment percentage? A property-management company in the area should have these aggregated.
- How much new for-sale + rental construction is in the pipeline within 1–3 miles? Heavy new supply typically softens prices + rents 12–24 months out; constrained supply supports both.
Investment metrics
- 1% rule
- 0.83% ✗
- Cap rate
- 5.90%
- Cash-on-cash
- -1.42%
- DSCR
- 0.94
- GRM
- 10.0
CMA / ARV
No comps found within radius.
Projected returns pro-forma
3.0% appreciation · 3.0% rent growth · sell at horizon
- IRR
- 6.2%
- Equity multiple
- 1.36×
- Total profit
- $34,821
- Equity at exit
- $157,330
- IRR
- 9.1%
- Equity multiple
- 2.37×
- Total profit
- $134,409
- Equity at exit
- $242,465
Cash invested: $97,972 (down + closing). Projections, not guarantees.
Landlord ↔ Tenant lean methodology
- Overall (STATE)
- 21 Tenant-Leaning
- State New Jersey
- 21 Tenant-Leaning · D+6
- County
- — inherits STATE
- City
- — inherits STATE
ZIP-level market 07801-4132
- Active inventory
- 1
- Price-to-rent
- 10.0×
Monthly cashflow live
- Estimated rent
- $2,914 high interval (Pro) →
- Mortgage (P&I)
- −$1,835
- Tax est. 1.5%
- −$437 /mo · $5,248/yr
- Insurance
- −$146
- HOA
- −$0
- Vacancy / Maint / Mgmt
- −$612
- Net cashflow
- $-116
Break-even live
UW: 25.0% down · 7.5% · 30yr · 1.5% tax · 5.0% vac · 8.0% maint · 8.0% mgmt
Financing live
Cash to close
- Down payment
- $87,475
- Closing costs
- $10,497
- Reserves months
- —
- Total cash needed
- —
Loan-product check · same deal, 3 products live
Conventional
25% down · 7.5% · 30yr
- Down + closing
- —
- Monthly P&I
- —
- Monthly cashflow
- —
- DSCR
- —
- Eligible?
- —
Personal DTI + credit; lowest rate.
DSCR
20% down · 8.5% · 30yr
- Down + closing
- —
- Monthly P&I
- —
- Monthly cashflow
- —
- DSCR
- —
- Eligible?
- —
No personal income docs; deal must DSCR.
Hard money
10% down · 12.0% · 12mo
- Down + closing
- —
- Monthly P&I
- —
- Monthly cashflow
- —
- DSCR
- —
- Eligible?
- —
Short-term bridge; refi at stabilization.
Rent comps 5 comps
| Address | Beds | Baths | Sqft | Rent | $/sqft | DOM | Units | Dist |
|---|---|---|---|---|---|---|---|---|
| 52 E Blackwell St Dover, NJ | 2.0 | 1.5 | 1117 | $2,500 | $2.24 | 24d | 1 | 0.55mi |
| 1 W Dickerson St Dover, NJ | 1.0–2.0 | 1.0–2.0 | 943 | $3,095 | $3.28 | 1d | 19 | 0.75mi |
| 10 Mt Pleasant Ave Dover, NJ | 1.0–3.0 | 1.0–2.0 | 1019 | $3,400 | $3.34 | 1d | 2 | 1.08mi |
| 275 W Clinton St Dover, NJ | 1.0–2.0 | 1.0 | 774 | $2,595 | $3.35 | 12d | 2 | 1.23mi |
| 147 Millbrook Ave Randolph, NJ | 3.0 | 1.5 | 1492 | $3,300 | $2.21 | 1d | 1 | 1.24mi |
Listing history 15 events
-
2026-06-18days on market $349,900 Active 72 DOM
-
2026-06-17days on market $349,900 Active 71 DOM
-
2026-06-16days on market $349,900 Active 70 DOM
-
2026-06-15days on market $349,900 Active 69 DOM
-
2026-06-13days on market $349,900 Active 67 DOM
-
2026-06-13days on market $349,900 Active 66 DOM
-
2026-06-09days on market $349,900 Active 63 DOM
-
2026-06-08days on market $349,900 Active 62 DOM
-
2026-06-07days on market $349,900 Active 61 DOM
-
2026-06-04days on market $349,900 Active 58 DOM
-
2026-06-03days on market $349,900 Active 57 DOM
-
2026-06-02days on market $349,900 Active 56 DOM
-
2026-06-01days on market $349,900 Active 55 DOM
-
2026-05-31days on market $349,900 Active 54 DOM
-
2026-04-06$349,900 Active
ⓘ Source: listings_history table (triggers on properties + properties_extension) + one-shot
backfill from property_details.listing_events for pre-trigger history.
Climate risk First Street
- Flood 7/10 Severe 97% chance over 30 yrs
- Wildfire 1/10 Low
- Heat 5/10 Major 7 d/yr ≥96°F today · 16 d/yr by 30 yrs out
- Wind 4/10 Moderate 20% chance of damaging wind over 30 yrs
- Air quality 3/10 Moderate 2 unhealthy d/yr today · 3 by 30 yrs out
Nearby sold comps map
Loading sold comps map…
Walkable amenities ~0.75 mi
Loading nearby amenities…
Taxation est. · year 1
- Rental income
- $34,972
- − Mortgage interest
- −$19,600
- − Property taxes
- −$5,248
- − Insurance
- −$1,750
- − Repairs & maintenance
- −$2,798
- − Management
- −$2,798
- − Depreciation
- −$10,179
- Taxable loss
- −$7,400
- Est. tax savings @ 24.0%
- +$1,776
- After-tax cash flow
- $387/yr
For passive investors: Depreciation is non-cash, so a rental often shows a tax loss while cash-flowing — sheltering income. Rental losses are passive: they offset passive income freely, and up to $25,000/yr can offset ordinary (W-2) income if you actively participate and your MAGI is under $100k (phasing out to $0 by $150k); unused losses carry forward. On sale, claimed depreciation is recaptured at up to 25%, and gains may owe capital-gains tax (a 1031 exchange can defer both). Figures are a year-1 estimate at your 24.0% rate — not tax advice; consult a CPA.
Condition & rehab AI · 13 photos
This 2-story attached townhouse is in average condition with minor repairs needed. It offers 3 bedrooms and a full bathroom, and is located in a convenient area. Value can be added through cosmetic updates and repairs.
Repairs flagged
- Minor siding — slight wear visible
- Minor roof — no major damage but not new
Value-add opportunities
- Both paint interior walls — fresh paint enhances curb appeal and interior aesthetics
- Both replace flooring — new flooring improves living space and adds value
- Both repair and paint exterior siding — enhances curb appeal and adds value
Renovation cost estimate screening
| Repair item | Severity | Est. cost |
|---|---|---|
| siding · slight wear visible | Minor | $500–3,000 |
| roof · no major damage but not new | Minor | $500–3,000 |
| Total estimated repair cost · 2 items | $1,000–6,000 |
Value-add ROI direction
- Both paint interior walls — fresh paint enhances curb appeal and interior aesthetics ↑
- Both replace flooring — new flooring improves living space and adds value ↑
- Both repair and paint exterior siding — enhances curb appeal and adds value ↑
ⓘ Cost ranges are severity-bucket heuristics (US national rule-of-thumb). Get contractor quotes + a written scope before underwriting a rehab budget.
Schools (NCES district)
- District
- Dover Public School District
- NCES district ID
- 3403930
- Math proficiency
- 16% ▼ -26.00%
- Reading proficiency
- 35% ▼ -26.00%
- Median HH income
- $59,274
- Composite
- 23.29/100
- National rank
- #7924
- State rank
- #380 of 472 in NJ
Livability — Dover
- Score
- 78/100
- State rank
- #94
- US rank
- #2430
Category grades
Schools grade is shown separately in the Schools card above.
Census & demographics
- Census place
- Dover, NJ
Population outlook (Morris County) Hauer SSP2
- Today (2025)
- 516,747 people
- By 2030
- 524,603 · +1.5%
- By 2040
- 539,582 · +4.4%
- By 2050
- 548,986 · +6.2%
- By 2075
- 571,326 · +10.6%
- By 2100
- 561,122 · +8.6%
Not yet ingested
- Political lean
- —
- Race & ethnicity
- —
- Common origin
- —
- Civics
- —
Market trends
- HPI YoY
- —
- Current HPI
- —
- Rent YoY
- —
- Metro
- —
- State GDP YoY
- ▲ 2.05%
- F500 in state
- 34
Industry mix (Fortune 500 HQ in NJ)
| Industry | F500 HQs | Revenue |
|---|---|---|
| Consumer Goods | 3 | $31B |
|
||
| Pharmaceuticals | 2 | $153B |
|
||
| Technology | 2 | $21B |
|
||
| Insurance | 2 | $20B |
|
||
| Healthcare | 2 | $19B |
|
||
| Financial Services | 1 | $70B |
|
||
Price history
1 event — show timeline
- 2026-04-06 Listed $349,900 GSMLS
Cash-flow waterfall
monthlySold comps — $/sqft
last 12 mo · ≤1 miLoading sold comps…