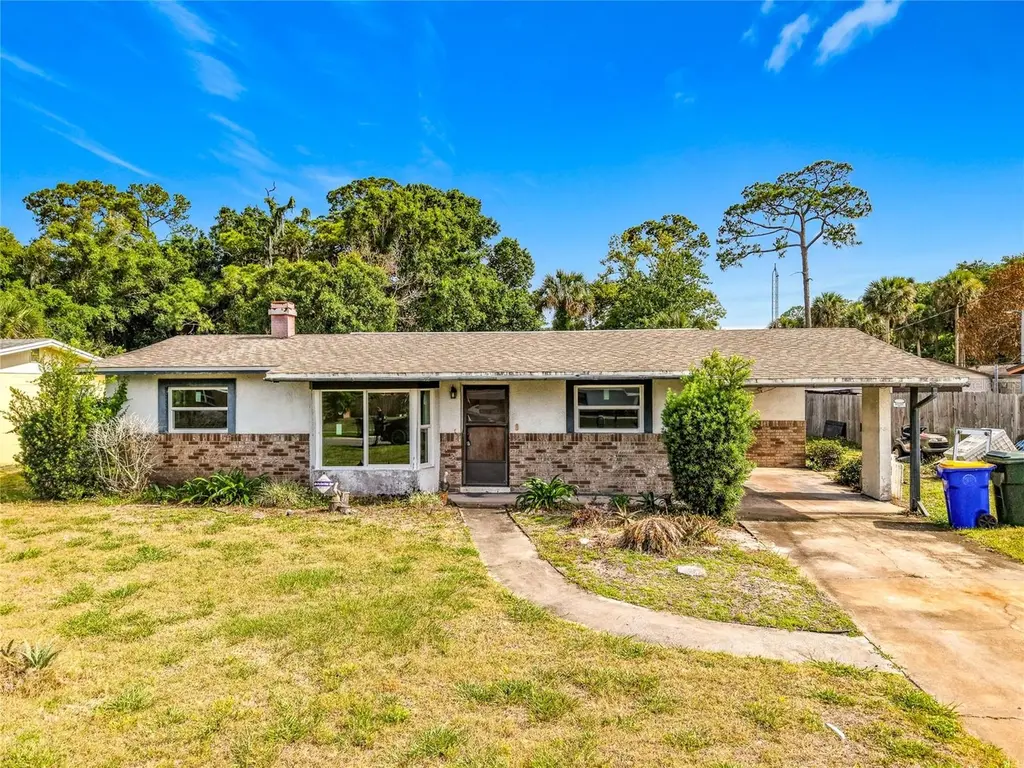
1021 Revilla Ln · Rockledge, FL
Flood risk 1/10 · Minimal
- FEMA flood zone
- X (unshaded)
- Chance of flooding over 30 yrs
- 0.0%
- Est. flood insurance / yr
- $507 – $1,088
Fire risk 4/10 · Minor
- Est. fire insurance / yr
- $947 – $1,759
Heat risk 10/10 · Severe
- Hot days now (above 106°F)
- 7 days/yr
- Hot days in 30 yrs
- 22 days/yr
Wind risk 10/10 · Severe
- Chance of severe wind over 30 yrs
- 99.0%
Air-quality risk 1/10 · Minimal
- Unhealthy air days now
- 0 days/yr
- Unhealthy air days in 30 yrs
- 0 days/yr
Risk factors via First Street. Map © Google.
Why this score? — see what drove the B- grade
The composite is a weighted blend of 9 inputs, each scored 0–100. Each bar is that input's sub-score; the figure is the points it added to the 100-point composite (weight × sub-score).
- Cash flow +29.1/30.0
- DSCR +10.0/10.0
- 1% rule +7.9/10.0
- ARV discount +7.5/15.0
- Schools +4.7/10.0
- Livability +4.0/5.0
- Rent growth +2.5/5.0
- Condition / age +2.5/5.0
- Appreciation +0.0/10.0
$149,000
🖨 Deal sheet 📄 Offer letter ✓ Due diligence
Listing remarks
Multiple Offers. Highest and best due by Friday May 8th 2026. Excellent opportunity to transform this property into something truly special. Located in the heart of Rockledge, this home offers solid potential for an owner occupant, investor, or buyer looking to create their dream home with some vision and updates. Situated on a spacious lot, the property features a functional layout and plenty of room to customize and add value. Conveniently located near major highways including I-95, making commuting throughout the Space Coast and Central Florida easy. Just minutes from shopping, dining, parks, and entertainment including The Avenue Viera, McLarty Park and Community Center, Riverwalk: A Fa
Key facts
- 0.27 acre lot
- Parking
- Built 1962
Property features AI
Finance
- Other: Lot approximately 0.27 acres (1/4 to less than 1/2 acre)
- Financial info: No lease restrictions indicated
- HOA & community: No association indicated
Exterior
- Parking: Has a carport (1 space)
- Utilities: Public water; Public sewer; Electricity connected
- Home design: Single family residence; One level; Faces east; Residential property
- Construction: Shingle roof; Other construction materials; Slab foundation; Built on one level
- Exterior features: Other exterior features; Asphalt and other road surface
Interior
- Kitchen: Other appliances
- Bedrooms: 3 bedrooms
- Flooring: Other flooring
- Bathrooms: 2 full bathrooms
- Heating & cooling: Central heating; Central air conditioning
- Interior features: Other interior features
- Laundry & utility: Indoor laundry
Neighborhood map
What this means for you Summary
Snapshot
- This is a 3-bed/2.0-bath single-family listed at $149k.
Deal economics
- At list price, monthly cash flow is $514 ($6k/yr) — positive.
- The deal already cash-flows at list — no discount required.
- Meets the 1% rule at list price ($2k rent vs $149k).
Location & tenants
- Location reads 81/100 on livability (#81 in FL, #1,315 nationally) — a professional / high-income tenant draw. Strengths: housing A+, health & safety A, commute A-; Watch: amenities F.
- Brevard (suburban): math 53% / reading 57% proficiency, ranked #19 of 73 in FL (top 26%) — acceptable for families but not a draw, mixed tenant base, ~2y average lease.
- Market conditions: Rents flat; 317 active listings in the ZIP; 29 comparable units currently listed for rent nearby; rentals at typical pace (median 23d on market — plan ~3-4 weeks tenant-placement turnaround); solid renter incomes; 4,602 units permitted in Brevard County in 2024 (702 in 5+ unit buildings).
Forward outlook
- Local home prices are declining (-3.0%/yr); year-one equity from $1k of loan paydown is wiped out by about $4k of value loss. Plan a longer hold.
- Brevard County population projected at +15% by 2050 — modest demand growth; plan on rents tracking national, not racing it.
Negotiation context
- Only 5 days on market — expect competitive offers; lowballing is unlikely to land.
Risks & watch-outs
- Climate carrying-cost: severe wind risk, 99% chance of damaging wind over 30y; extreme-heat days projected 7→22/yr by 2055 (HVAC capex compounding) — expect insurance premiums to compound above CPI over the hold.
Questions for the listing agent
- Built in 1962 — when were the roof, HVAC, electrical panel, plumbing, and water heater last replaced?
- Is there a deadline driving the sale (1031 exchange, divorce, estate, relocation)? That informs how much negotiation room exists.
- Schools are B-rated — typically a magnet for longer-tenancy family renters. What's the average tenant stay here, and is there a school-zone premium baked into asking?
- What's the average days-on-market for RENTAL listings here right now (not sales)? A rising rental-DOM trend means longer vacancies and softer asking-rent achievability than the comps imply.
- What's the recent tenant-quality profile in this submarket — average credit score on applications, eviction rate, late-payment / NSF rate, and stable-employment percentage? A property-management company in the area should have these aggregated.
- How much new for-sale + rental construction is in the pipeline within 1–3 miles? Heavy new supply typically softens prices + rents 12–24 months out; constrained supply supports both.
Investment metrics
- 1% rule
- 1.29% ✓
- Cap rate
- 10.44%
- Cash-on-cash
- 14.79%
- DSCR
- 1.66
- GRM
- 6.5
CMA / ARV
No comps found within radius.
Projected returns pro-forma
-3.0% appreciation · 0.12% rent growth · sell at horizon
- IRR
- 2.1%
- Equity multiple
- 1.08×
- Total profit
- $3,222
- Equity at exit
- $22,216
- IRR
- 8.7%
- Equity multiple
- 1.58×
- Total profit
- $24,099
- Equity at exit
- $12,883
Cash invested: $41,720 (down + closing). Projections, not guarantees.
Landlord ↔ Tenant lean methodology
- Overall (STATE)
- 87 Strongly Landlord-Friendly
- State Florida
- 87 Strongly Landlord-Friendly · R+3
- County
- — inherits STATE
- City
- — inherits STATE
ZIP-level market 32955
- Home prices YoY
- -20.7%
- Rents YoY
- 0.1%
- Active inventory
- 317
- Price-to-rent
- 6.5×
Monthly cashflow live
- Estimated rent
- $1,919 high interval (Pro) →
- Mortgage (P&I)
- −$781
- Tax from tax record
- −$158 /mo · $1,898/yr
- Insurance
- −$62
- HOA
- −$0
- Vacancy / Maint / Mgmt
- −$403
- Net cashflow
- $514
Break-even live
UW: 25.0% down · 7.5% · 30yr · 1.5% tax · 5.0% vac · 8.0% maint · 8.0% mgmt
Financing live
Cash to close
- Down payment
- $37,250
- Closing costs
- $4,470
- Reserves months
- —
- Total cash needed
- —
Loan-product check · same deal, 3 products live
Conventional
25% down · 7.5% · 30yr
- Down + closing
- —
- Monthly P&I
- —
- Monthly cashflow
- —
- DSCR
- —
- Eligible?
- —
Personal DTI + credit; lowest rate.
DSCR
20% down · 8.5% · 30yr
- Down + closing
- —
- Monthly P&I
- —
- Monthly cashflow
- —
- DSCR
- —
- Eligible?
- —
No personal income docs; deal must DSCR.
Hard money
10% down · 12.0% · 12mo
- Down + closing
- —
- Monthly P&I
- —
- Monthly cashflow
- —
- DSCR
- —
- Eligible?
- —
Short-term bridge; refi at stabilization.
Rent comps 29 comps
| Address | Beds | Baths | Sqft | Rent | $/sqft | DOM | Units | Dist |
|---|---|---|---|---|---|---|---|---|
| 944 Kentucky Ave Rockledge, FL | 3.0 | 2.0 | 1236 | $1,945 | $1.57 | 18d | 1 | 0.13mi |
| 1105 Santa Rosa Dr Rockledge, FL | 3.0 | 2.0 | 1096 | $2,000 | $1.82 | 23d | 1 | 0.28mi |
| 1525 S Fiske Blvd Rockledge, FL | 1.0–2.0 | 1.0 | 890 | $1,500 | $1.69 | 23d | 1 | 0.45mi |
| 616 S Kentucky Ave Cocoa, FL | 3.0 | 1.0 | 960 | $1,600 | $1.67 | 18d | 1 | 0.51mi |
| 516 Donley St Cocoa, FL | 2.0 | 2.0 | 1485 | $1,800 | $1.21 | 18d | 1 | 0.55mi |
| 1675 S Fiske Blvd #155 Rockledge, FL | 2.0 | 2.0 | 1170 | $1,750 | $1.50 | 13d | 1 | 0.66mi |
| 613 Paw Paw St Apt A Cocoa, FL | 2.0 | 1.0 | 1104 | $1,175 | $1.06 | 23d | 1 | 0.73mi |
| 801 Washington St Unit B Cocoa, FL | 2.0 | 1.0 | 700 | $1,290 | $1.84 | 23d | 1 | 0.74mi |
| 801 Washington St Unit A Cocoa, FL | 3.0 | 1.5 | 1000 | $1,760 | $1.76 | 23d | 1 | 0.74mi |
| 1600 Woodland Dr Unit 1 Rockledge, FL | 3.0 | 2.0 | 1426 | $1,995 | $1.40 | 14d | 1 | 0.92mi |
| 1515 Huntington Ln Rockledge, FL | 2.0 | 1.0–2.0 | 470 | $1,762 | $3.75 | 23d | 3 | 0.95mi |
| 1515 Huntington Ln Rockledge, FL | 2.0 | 1.0–2.0 | 470 | $1,725 | $3.67 | 14d | 4 | 0.95mi |
| 295 Royal Tern CIR Rockledge, FL | 1.0–3.0 | 1.0–2.0 | 1020 | $2,467 | $2.42 | 14d | 33 | 1.01mi |
| 1515 Peachtree St Cocoa, FL | 3.0 | 2.0 | 1056 | $1,475 | $1.40 | 23d | 1 | 1.08mi |
| 823 Angela Ave Unit A Rockledge, FL | 2.0 | 2.0 | 1117 | $1,750 | $1.57 | 14d | 1 | 1.13mi |
| 647 School St Cocoa, FL | 2.0 | 1.0 | 844 | $1,495 | $1.77 | 23d | 1 | 1.14mi |
| 305 Prospect Ave Cocoa, FL | 3.0 | 1.0 | 1180 | $1,595 | $1.35 | 23d | 1 | 1.18mi |
| 305 Edinburgh Dr Cocoa, FL | 3.0 | 1.5 | 1280 | $1,750 | $1.37 | 23d | 1 | 1.20mi |
| 302 Palm Ave Cocoa, FL | 2.0 | 1.0 | 820 | $1,600 | $1.95 | 14d | 1 | 1.21mi |
| 317 Pineda St Unit B Cocoa, FL | 2.0 | 1.0 | 984 | $1,200 | $1.22 | 14d | 1 | 1.22mi |
| 330 Palm Ave Unit PAL332 Cocoa, FL | 2.0 | 1.0 | 700 | $1,200 | $1.71 | 23d | 1 | 1.28mi |
| 256 Barton Blvd Rockledge, FL | 3.0 | 1.0–2.0 | 1012 | $2,115 | $2.09 | 14d | 23 | 1.31mi |
| 301 Forrest Ave Cocoa, FL | 2.0 | 1.0–2.0 | 619 | $1,699 | $2.74 | 23d | 5 | 1.34mi |
| 412 Clarence Rowe Ave Rockledge, FL | 3.0 | 1.0 | 960 | $1,600 | $1.67 | 23d | 1 | 1.34mi |
| 420 N Fiske Blvd Cocoa, FL | 3.0 | 1.5 | 1382 | $1,695 | $1.23 | 23d | 1 | 1.36mi |
| 27 Seminole Dr Rockledge, FL | 3.0 | 1.0 | 714 | $1,750 | $2.45 | 23d | 1 | 1.39mi |
| 1720 Murrell Rd #217 Rockledge, FL | 2.0 | 2.0 | 928 | $1,550 | $1.67 | 23d | 1 | 1.42mi |
| 305 Laredo Dr Cocoa, FL | 1.0–3.0 | 1.0–2.0 | 1481 | $2,319 | $1.57 | 13d | 28 | 1.49mi |
| 118 Olive St Cocoa, FL | 2.0 | 1.0 | 933 | $1,350 | $1.45 | 23d | 1 | 1.50mi |
Listing history 2 events
-
2026-05-12status Pending
-
2026-05-07$149,000 Active
ⓘ Source: listings_history table (triggers on properties + properties_extension) + one-shot
backfill from property_details.listing_events for pre-trigger history.
Tax reassessment forecast FL · Resets to sale price
- Current annual tax
- $1,898 · $158/mo
- Projected year-2 tax
- $1,898 · $158/mo
- Expected delta
- $0/yr ($0/mo · 0.0%)
ⓘ Screening estimate from a state-policy table — verify with the county assessor before closing.
Climate risk First Street
- Flood 1/10 Low FEMA zone X (unshaded) · 0% chance over 30 yrs
- Wildfire 4/10 Moderate
- Heat 10/10 Extreme 7 d/yr ≥106°F today · 22 d/yr by 30 yrs out
- Wind 10/10 Extreme 99% chance of damaging wind over 30 yrs
- Air quality 1/10 Low 0 unhealthy d/yr today · 0 by 30 yrs out
Nearby sold comps map
Loading sold comps map…
Walkable amenities ~0.75 mi
Loading nearby amenities…
Taxation est. · year 1
- Rental income
- $23,027
- − Mortgage interest
- −$8,346
- − Property taxes
- −$1,898
- − Insurance
- −$745
- − Repairs & maintenance
- −$1,842
- − Management
- −$1,842
- − Depreciation
- −$4,335
- Taxable income
- $4,019
- Est. tax owed @ 24.0%
- −$965
- After-tax cash flow
- $5,208/yr
For passive investors: Depreciation is non-cash, so a rental often shows a tax loss while cash-flowing — sheltering income. Rental losses are passive: they offset passive income freely, and up to $25,000/yr can offset ordinary (W-2) income if you actively participate and your MAGI is under $100k (phasing out to $0 by $150k); unused losses carry forward. On sale, claimed depreciation is recaptured at up to 25%, and gains may owe capital-gains tax (a 1031 exchange can defer both). Figures are a year-1 estimate at your 24.0% rate — not tax advice; consult a CPA.
Schools (NCES district)
- District
- Brevard
- NCES district ID
- 1200150
- Math proficiency
- 53% ▼ -9.00%
- Reading proficiency
- 57% ▼ -4.00%
- Median HH income
- $49,426
- Composite
- 46.86/100
- National rank
- #2370
- State rank
- #19 of 73 in FL
Livability — Rockledge
- Score
- 81/100
- State rank
- #81
- US rank
- #1315
Category grades
Schools grade is shown separately in the Schools card above.
Census & demographics
- Census place
- Rockledge, FL
- County
- Brevard County · 602,871 people
- City population
- 41,008
- Metro
- Palm Bay-Melbourne-Titusville, FL
- Population (ZIP)
- 41,008
- Household income
- $86,457
- Rent vs Own
- Severe rent burden
- 1273.0
Population outlook (Brevard County) Hauer SSP2
- Today (2025)
- 623,254 people
- By 2030
- 648,420 · +4.0%
- By 2040
- 690,009 · +10.7%
- By 2050
- 715,669 · +14.8%
- By 2075
- 775,744 · +24.5%
- By 2100
- 776,687 · +24.6%
Race, ethnicity, and origin ACS 2023
- Neighborhood character
- Predominantly White (69%)
- Race & ethnicity
- White 69% Black 14% Hispanic / Latino 9% Two or more races 8% Asian 2%
- Hispanic origin (detail)
- Mexican 1% Puerto Rican 3%
- Common ancestry
- Slovak 3% Romanian 2% Serbian 2%
- Foreign-born
- 7% · Canada, Jamaica, Mexico
- Languages at home
- 91% English-only · Spanish 5% Other Indo-European 2%
Political lean MEDSL · Brevard
- 2024 margin
- Strong R (+20.8) · D 39.1% · R 59.9% · Other 1.0%
- 2008→2024 swing
- -10.4pp toward R · 2008: -10.4pp · 2024: -20.8pp
- All cycles
- 2024: R+20.8 2020: R+16.4 2016: R+19.8 2012: R+12.7 2008: R+10.4
Not yet ingested
- Civics
- —
Market trends
- HPI YoY
- ▼ -81.70%
- Current HPI
- 312.7435
- Rent YoY
- ▲ 0.12%
- Metro
- Palm Bay-Melbourne-Titusville, FL
- State GDP YoY
- ▲ 3.28%
- F500 in state
- 36
Industry mix (Fortune 500 HQ in FL)
| Industry | F500 HQs | Revenue |
|---|---|---|
| Industrial Technology | 2 | $29B |
|
||
| Insurance | 2 | $17B |
|
||
| Retail | 1 | $60B |
|
||
| Technology Distribution | 1 | $58B |
|
||
| Homebuilding | 1 | $35B |
|
||
| Technology Manufacturing | 1 | $35B |
|
||
Price history
2 events — show timeline
- 2026-05-12 Pending — Stellar MLS as Distributed by MLS Grid
- 2026-05-07 Listed $149,000 Stellar MLS as Distributed by MLS Grid
Property tax history
+16.8%/yrLatest (2025): $1,898 · -3.1% YoY. Source: county tax records.
Cash-flow waterfall
monthlySold comps — $/sqft
last 12 mo · ≤1 miLoading sold comps…