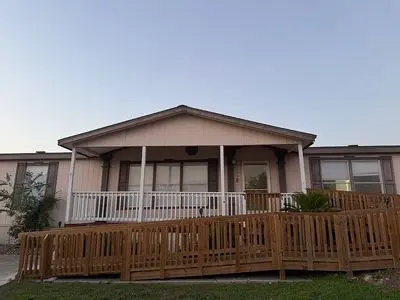
7460 Kitty Hawk Rd · Converse, TX
Flood risk 1/10 · Minimal
- FEMA flood zone
- X (unshaded)
- Chance of flooding over 30 yrs
- 0.0%
- Est. flood insurance / yr
- $507 – $1,088
Fire risk 2/10 · Minimal
- Est. fire insurance / yr
- $1,222 – $2,270
Heat risk 8/10 · Major
- Hot days now (above 108°F)
- 7 days/yr
- Hot days in 30 yrs
- 23 days/yr
Wind risk 8/10 · Major
- Chance of severe wind over 30 yrs
- 80.0%
Air-quality risk 1/10 · Minimal
- Unhealthy air days now
- 0 days/yr
- Unhealthy air days in 30 yrs
- 0 days/yr
Risk factors via First Street. Map © Google.
Why this score? — see what drove the D grade
The composite is a weighted blend of 9 inputs, each scored 0–100. Each bar is that input's sub-score; the figure is the points it added to the 100-point composite (weight × sub-score).
- Cash flow +15.0/30.0
- ARV discount +7.5/15.0
- 1% rule +5.0/10.0
- DSCR +5.0/10.0
- Livability +3.3/5.0
- Schools +2.4/10.0
- Rent growth +2.2/5.0
- Condition / age +2.2/5.0
- Appreciation +0.0/10.0
$35,000
🖨 Deal sheet 📄 Offer letter ✓ Due diligence
Listing remarks
You must apply for the lot at the office, excellent community, Summit Ridge
Key facts
- Built 2003
- Listed 37 days
Property features AI
Exterior
- Home design: Built in 2003
- Construction: Single-family property; Living area approximately 1568
- Exterior features: Located in the Northeast Side subdivision
Neighborhood map
What this means for you Summary
Snapshot
- This is a 3-bed/2.0-bath manufactured listed at $35k. Condition is rated fair.
Deal economics
- At list price, monthly cash flow is $1k ($12k/yr) — positive.
- The deal already cash-flows at list — no discount required.
- Meets the 1% rule at list price ($2k rent vs $35k).
- Recommended offer: $34k (3.0% below list) — sets the bar for market timing.
- Cap rate 40.7% vs local median 4.4% in Converse — top-decile yield for the area; either an underpriced asset or a hidden risk that comps aren't pricing in. Stress-test before assuming the spread holds.
Location & tenants
- Location reads 66/100 on livability (#649 in TX) — a middle-class / working-renter tenant base. Strengths: cost of living A+, housing A+, employment B; Watch: schools C-, crime C-, amenities F.
- Judson ISD (suburban): math 21% / reading 33% proficiency, ranked #660 of 826 in TX (top 80%) — low school quality limits family demand, transient renter base, plan for 1-2y turnover.
- Market conditions: Rents soft (-1.1%/yr); 1152 active listings in the ZIP; 40 comparable units currently listed for rent nearby; rentals at typical pace (median 24d on market — plan ~3-4 weeks tenant-placement turnaround); solid renter incomes; 8,308 units permitted in Bexar County in 2024 (2,506 in 5+ unit buildings).
Forward outlook
- Local home prices are declining (-3.0%/yr); year-one equity from $242 of loan paydown is wiped out by about $1k of value loss. Plan a longer hold.
- Bexar County population projected at +50% by 2050 — long-run rental-demand tailwind backs the buy-and-hold thesis.
- At projected returns (-3.0% appreciation + 0.0% rent growth), your $10k cash investment doubles in ~1 year — after that, you're playing with house money.
Negotiation context
- It's been on market 37 days — a 3% lower offer ($34k) is reasonable based on typical stale-listing flexibility.
- 26 sale attempts since 21y ago; this cycle's ask has dropped $28k (44%) from the opening price — seller is motivated, your offer sets the floor, not the list.
Risks & watch-outs
- Watch-outs: property tax is 4.7% of price.
- Climate carrying-cost: severe wind risk, 80% chance of damaging wind over 30y; extreme-heat days projected 7→23/yr by 2055 (HVAC capex compounding) — expect insurance premiums to compound above CPI over the hold.
Questions for the listing agent
- It's been on market 37 days. Have you received any prior offers? Is the seller open to a 3% concession, seller financing, or rate buy-down credit?
- Have any recent inspections been done? Can we get a copy of the seller's disclosures and any deferred-maintenance estimates?
- Property tax is high relative to price — has the assessment been appealed recently, and will the sale trigger a re-assessment?
- Is there a deadline driving the sale (1031 exchange, divorce, estate, relocation)? That informs how much negotiation room exists.
- The area grade is low — what's the realistic commute time and amenity access for the typical tenant pool here? Any planned neighborhood developments (good or bad) we should know about?
- What's the average days-on-market for RENTAL listings here right now (not sales)? A rising rental-DOM trend means longer vacancies and softer asking-rent achievability than the comps imply.
- What's the recent tenant-quality profile in this submarket — average credit score on applications, eviction rate, late-payment / NSF rate, and stable-employment percentage? A property-management company in the area should have these aggregated.
- How much new for-sale + rental construction is in the pipeline within 1–3 miles? Heavy new supply typically softens prices + rents 12–24 months out; constrained supply supports both.
Investment metrics
- 1% rule
- 4.84% ✓
- Cap rate
- 40.65%
- Cash-on-cash
- 122.71%
- DSCR
- 6.46
- GRM
- 1.7
CMA / ARV
No comps found within radius.
Projected returns pro-forma
-3.0% appreciation · 0.0% rent growth · sell at horizon
- IRR
- —
- Equity multiple
- 6.44×
- Total profit
- $53,274
- Equity at exit
- $5,219
- IRR
- —
- Equity multiple
- 12.20×
- Total profit
- $109,728
- Equity at exit
- $3,026
Cash invested: $9,800 (down + closing). Projections, not guarantees.
Landlord ↔ Tenant lean methodology
- Overall (STATE)
- 87 Strongly Landlord-Friendly
- State Texas
- 87 Strongly Landlord-Friendly · R+5
- County
- — inherits STATE
- City
- — inherits STATE
ZIP-level market 78109
- Home prices YoY
- -17.8%
- Rents YoY
- -1.1%
- Active inventory
- 1152
- Price-to-rent
- 1.7×
Monthly cashflow live
- Estimated rent
- $1,694 high interval (Pro) →
- Mortgage (P&I)
- −$184
- Tax from tax record
- −$138 /mo · $1,659/yr
- Insurance
- −$15
- HOA
- −$0
- Vacancy / Maint / Mgmt
- −$356
- Net cashflow
- $1,002
Break-even live
UW: 25.0% down · 7.5% · 30yr · 1.5% tax · 5.0% vac · 8.0% maint · 8.0% mgmt
Financing live
Cash to close
- Down payment
- $8,750
- Closing costs
- $1,050
- Reserves months
- —
- Total cash needed
- —
Loan-product check · same deal, 3 products live
Conventional
25% down · 7.5% · 30yr
- Down + closing
- —
- Monthly P&I
- —
- Monthly cashflow
- —
- DSCR
- —
- Eligible?
- —
Personal DTI + credit; lowest rate.
DSCR
20% down · 8.5% · 30yr
- Down + closing
- —
- Monthly P&I
- —
- Monthly cashflow
- —
- DSCR
- —
- Eligible?
- —
No personal income docs; deal must DSCR.
Hard money
10% down · 12.0% · 12mo
- Down + closing
- —
- Monthly P&I
- —
- Monthly cashflow
- —
- DSCR
- —
- Eligible?
- —
Short-term bridge; refi at stabilization.
Rent comps 40 comps
| Address | Beds | Baths | Sqft | Rent | $/sqft | DOM | Units | Dist |
|---|---|---|---|---|---|---|---|---|
| 7460 Kitty Hawk Rd Converse, TX | 3.0 | 2.0 | 1456 | $1,399 | $0.96 | 43d | 1 | 0.16mi |
| 7356 Misty Ridge Dr Unit 17 Converse, TX | 3.0 | 2.5 | 1225 | $1,750 | $1.43 | 24d | 1 | 0.21mi |
| 7356 Misty Ridge Dr Unit 3 Converse, TX | 3.0 | 2.5 | 1225 | $1,595 | $1.30 | 16d | 1 | 0.21mi |
| 7356 Misty Ridge Dr Unit 23 Converse, TX | 3.0 | 2.5 | 1225 | $1,495 | $1.22 | 24d | 1 | 0.22mi |
| 7356 Misty Ridge Dr Converse, TX | 3.0 | 2.5 | 1250 | $1,595 | $1.28 | 20d | 1 | 0.22mi |
| 7356 Misty Ridge Dr Unit 1 Converse, TX | 3.0 | 2.5 | 1225 | $1,425 | $1.16 | 43d | 1 | 0.22mi |
| 7356 Misty Ridge Dr Unit 8 Converse, TX | 3.0 | 2.5 | 1225 | $1,750 | $1.43 | 15d | 1 | 0.22mi |
| 7356 Misty Ridge Dr Apt 30 Converse, TX | 3.0 | 2.5 | 1225 | $1,595 | $1.30 | 43d | 1 | 0.23mi |
| 7356 Misty Ridge Dr Unit 22 Converse, TX | 3.0 | 2.5 | 1225 | $1,600 | $1.31 | 24d | 1 | 0.23mi |
| 7461 Kitty Hawk Rd Converse, TX | 1.0–3.0 | 1.0–2.0 | 873 | $1,742 | $1.99 | 2d | 27 | 0.31mi |
| 10003 Vasso Vw Unit 4 Converse, TX | 3.0 | 2.0 | 1270 | $1,300 | $1.02 | 43d | 1 | 0.31mi |
| 7347 Kitty Hawk Rd Converse, TX | 1.0–4.0 | 1.0–2.0 | 990 | $1,604 | $1.62 | 4d | 1 | 0.37mi |
| 8778 Serene Ridge Dr San Antonio, TX | 3.0 | 2.0 | 1664 | $1,650 | $0.99 | 22d | 1 | 0.38mi |
| 8778 Serene Ridge Dr San Antonio, TX | 3.0 | 2.0 | 1664 | $1,650 | $0.99 | 43d | 1 | 0.38mi |
| 8750 Shallow Ridge Dr San Antonio, TX | 3.0 | 2.0 | 1538 | $2,100 | $1.37 | 24d | 1 | 0.39mi |
| 10023 Vasso Vw Unit 1 Converse, TX | 3.0 | 2.5 | 1277 | $1,295 | $1.01 | 43d | 1 | 0.39mi |
| 10027 Vasso Vw Unit 3 Converse, TX | 3.0 | 2.5 | 1249 | $1,450 | $1.16 | 43d | 1 | 0.40mi |
| 9426 Apple Ridge Ln Unit 503 San Antonio, TX | 3.0 | 2.5 | 1225 | $1,600 | $1.31 | 15d | 1 | 0.41mi |
| 9426 Apple Ridge Ln Unit 503 San Antonio, TX | 3.0 | 2.5 | 1225 | $1,395 | $1.14 | 4d | 1 | 0.41mi |
| 8659 Serene Ridge Dr San Antonio, TX | 3.0 | 2.0 | 1676 | $2,100 | $1.25 | 24d | 1 | 0.42mi |
| 7239 Converse Ridge Ln Unit 603 Windcrest, TX | 3.0 | 2.5 | 1225 | $1,450 | $1.18 | 12d | 1 | 0.44mi |
| 7239 Converse Ridge Ln Unit 703 Windcrest, TX | 3.0 | 2.5 | 1225 | $1,500 | $1.22 | 24d | 1 | 0.44mi |
| 9426 Apple Ridge Ln Unit 104 San Antonio, TX | 3.0 | 2.5 | 1225 | $1,495 | $1.22 | 7d | 1 | 0.46mi |
| 7724 Skyline Ridge Dr San Antonio, TX | 3.0 | 2.0 | 1545 | $1,350 | $0.87 | 4d | 1 | 0.48mi |
| 9426 Apple Ridge Ln Unit 303 San Antonio, TX | 3.0 | 2.5 | 1231 | $1,400 | $1.14 | 43d | 1 | 0.48mi |
| 9426 Apple Ridge Ln San Antonio, TX | 3.0 | 2.5 | 1225 | $1,495 | $1.22 | 10d | 1 | 0.48mi |
| 9426 Apple Ridge Ln San Antonio, TX | 3.0 | 2.5 | 1225 | $1,350 | $1.10 | 43d | 1 | 0.48mi |
| 8742 Ridge Moon Dr San Antonio, TX | 3.0 | 2.0 | 1350 | $1,489 | $1.10 | 2d | 1 | 0.51mi |
| 7123 Winter Rdg Converse, TX | 3.0 | 2.0 | 1657 | $1,650 | $1.00 | 11d | 1 | 0.51mi |
| 10232 Flatland Trl Converse, TX | 3.0 | 2.0 | 1244 | $1,536 | $1.23 | 4d | 1 | 0.52mi |
| 9535 Apple Ridge Ln San Antonio, TX | 3.0 | 2.0 | 1602 | $1,638 | $1.02 | 3d | 1 | 0.52mi |
| 7315 Ridge Bch Converse, TX | 3.0 | 2.0 | 1707 | $1,525 | $0.89 | 43d | 1 | 0.54mi |
| 9730 Wagon Train Converse, TX | 3.0 | 2.5 | 1544 | $1,700 | $1.10 | 43d | 1 | 0.57mi |
| 7106 Comanche Rdg Converse, TX | 3.0 | 2.0 | 1592 | $1,750 | $1.10 | 24d | 1 | 0.58mi |
| 9034 Glen Shadow Dr Unit 34 San Antonio, TX | 3.0 | 2.5 | 1225 | $1,645 | $1.34 | 24d | 1 | 0.58mi |
| 9034 Glen Shadow Dr Unit 27 San Antonio, TX | 3.0 | 2.5 | 1225 | $1,550 | $1.27 | 4d | 1 | 0.58mi |
| 9034 Glen Shadow Dr Unit 13 San Antonio, TX | 3.0 | 2.5 | 1225 | $1,645 | $1.34 | 43d | 1 | 0.58mi |
| 7110 Ridge Port Dr Converse, TX | 3.0 | 2.0 | 1589 | $1,600 | $1.01 | 12d | 1 | 0.62mi |
| 8678 Ridge Mile Dr San Antonio, TX | 3.0 | 2.0 | 1269 | $1,800 | $1.42 | 24d | 1 | 0.63mi |
| 8515 Maple Ridge Dr San Antonio, TX | 3.0 | 2.0 | 1458 | $1,750 | $1.20 | 15d | 1 | 0.67mi |
Listing history 50 events
-
2026-06-18days on market $35,000 Active 37 DOM
-
2026-06-17pricedays on market $35,000 Active 36 DOM
-
2026-06-16days on market $62,999 Active 35 DOM
-
2026-06-15days on market $62,999 Active 34 DOM
-
2026-06-13days on market $62,999 Active 32 DOM
-
2026-06-09days on market $62,999 Active 28 DOM
-
2026-06-08days on market $62,999 Active 27 DOM
-
2026-06-07days on market $62,999 Active 26 DOM
-
2026-06-04days on market $62,999 Active 23 DOM
-
2026-06-03days on market $62,999 Active 22 DOM
-
2026-06-02days on market $62,999 Active 21 DOM
-
2026-06-01days on market $62,999 Active 20 DOM
-
2026-05-31days on market $62,999 Active 19 DOM
-
2026-05-12$62,999 Active 75-char remark
-
2025-04-21historical
-
2025-04-18$32,000 New
-
2025-04-16historical
-
2025-04-14$82,000 New
-
2025-04-02price $53,000
-
2025-04-01historical
-
2025-01-23$60,000 New
-
2024-09-07historical
-
2024-08-30$84,990 New
-
2024-02-29historical
-
2024-02-25$58,000 New
-
2021-05-18historical
-
2021-05-17$55,000 New
-
2021-05-10historical
-
2021-05-05historical
-
2021-05-02historical Active Option
-
2021-05-01price $94,500
-
2021-04-25$99,500 New
-
2021-04-10$72,900 New
-
2021-01-07historical
-
2021-01-07$72,900 New
-
2020-03-05historical
-
2020-03-04$45,000 New
-
2019-08-13historical
-
2019-08-12$65,000 New
-
2019-05-28historical
-
2019-05-24historical
-
2019-05-07$39,900 New
-
2019-05-04price $49,900
-
2019-04-26historical
-
2019-04-15$51,500 New
-
2019-03-30$35,000 New
-
2018-09-05historical
-
2018-08-22$105,000 New
-
2016-05-23historical
-
2016-05-17$65,000 New
ⓘ Source: listings_history table (triggers on properties + properties_extension) + one-shot
backfill from property_details.listing_events for pre-trigger history.
Tax reassessment forecast TX · Resets to sale price
- Current annual tax
- $1,659 · $138/mo
- Projected year-2 tax
- $1,659 · $138/mo
- Expected delta
- $0/yr ($0/mo · 0.0%)
ⓘ Screening estimate from a state-policy table — verify with the county assessor before closing.
Climate risk First Street
- Flood 1/10 Low FEMA zone X (unshaded) · 0% chance over 30 yrs
- Wildfire 2/10 Low
- Heat 8/10 Severe 7 d/yr ≥108°F today · 23 d/yr by 30 yrs out
- Wind 8/10 Severe 80% chance of damaging wind over 30 yrs
- Air quality 1/10 Low 0 unhealthy d/yr today · 0 by 30 yrs out
Nearby sold comps map
Loading sold comps map…
Walkable amenities ~0.75 mi
Loading nearby amenities…
Taxation est. · year 1
- Rental income
- $20,332
- − Mortgage interest
- −$1,961
- − Property taxes
- −$1,659
- − Insurance
- −$175
- − Repairs & maintenance
- −$1,627
- − Management
- −$1,627
- − Depreciation
- −$1,018
- Taxable income
- $12,266
- Est. tax owed @ 24.0%
- −$2,944
- After-tax cash flow
- $9,082/yr
For passive investors: Depreciation is non-cash, so a rental often shows a tax loss while cash-flowing — sheltering income. Rental losses are passive: they offset passive income freely, and up to $25,000/yr can offset ordinary (W-2) income if you actively participate and your MAGI is under $100k (phasing out to $0 by $150k); unused losses carry forward. On sale, claimed depreciation is recaptured at up to 25%, and gains may owe capital-gains tax (a 1031 exchange can defer both). Figures are a year-1 estimate at your 24.0% rate — not tax advice; consult a CPA.
Condition & rehab AI · 1 photo
This manufactured home has average exterior and interior conditions, with minor repairs needed. Painting the exterior and interior would significantly enhance its curb appeal and value.
Repairs flagged
- Minor paint — Slight discoloration on exterior
- Minor siding — Weathered appearance
Value-add opportunities
- Both paint exterior — Enhances curb appeal and value
- Both paint interior — Improves home's appearance and value
Renovation cost estimate screening
| Repair item | Severity | Est. cost |
|---|---|---|
| paint · Slight discoloration on exterior | Minor | $500–3,000 |
| siding · Weathered appearance | Minor | $500–3,000 |
| Total estimated repair cost · 2 items | $1,000–6,000 |
Value-add ROI direction
- Both paint exterior — Enhances curb appeal and value ↑
- Both paint interior — Improves home's appearance and value ↑
ⓘ Cost ranges are severity-bucket heuristics (US national rule-of-thumb). Get contractor quotes + a written scope before underwriting a rehab budget.
Schools (NCES district)
- District
- Judson ISD
- NCES district ID
- 4824990
- Math proficiency
- 21% ▼ -21.00%
- Reading proficiency
- 33% ▼ -7.00%
- Median HH income
- $57,542
- Composite
- 24.39/100
- National rank
- #7689
- State rank
- #660 of 826 in TX
Livability — Converse
- Score
- 66/100
- State rank
- #649
- US rank
- #12250
Category grades
Schools grade is shown separately in the Schools card above.
Census & demographics
- County
- Bexar County · 1,990,555 people
- City population
- 63,067
- Metro
- San Antonio-New Braunfels, TX
- Population (ZIP)
- 63,067
- Household income
- $91,320
- Rent vs Own
- Severe rent burden
- 1732.0
Population outlook (Bexar County) Hauer SSP2
- Today (2025)
- 2,336,851 people
- By 2030
- 2,560,728 · +9.6%
- By 2040
- 3,020,569 · +29.3%
- By 2050
- 3,493,522 · +49.5%
- By 2075
- 4,668,459 · +99.8%
- By 2100
- 5,533,242 · +136.8%
Race, ethnicity, and origin ACS 2023
- Neighborhood character
- Diverse neighborhood (Simpson 0.69)
- Race & ethnicity
- Hispanic / Latino 44% White 27% Two or more races 21% Black 21% Asian 3%
- Hispanic origin (detail)
- Mexican 29% Puerto Rican 4%
- Common ancestry
- Lithuanian 1% Romanian 1% Italian 1%
- Foreign-born
- 11% · Canada, Vietnam, South Korea
- Languages at home
- 71% English-only · Spanish 23% Tagalog/Filipino 1% Other Asian/Pacific 1%
Political lean MEDSL · Bexar
- 2024 margin
- Lean D (+9.8) · D 54.3% · R 44.6% · Other 1.1%
- 2008→2024 swing
- +4.2pp toward D · 2008: 5.6pp · 2024: 9.8pp
- All cycles
- 2024: D+9.8 2020: D+18.2 2016: D+13.5 2012: D+4.6 2008: D+5.6
Not yet ingested
- Civics
- —
Market trends
- HPI YoY
- ▼ -51.02%
- Current HPI
- 236.4923
- Rent YoY
- ▼ -1.08%
- Metro
- San Antonio-New Braunfels, TX
- State GDP YoY
- ▲ 3.95%
- F500 in state
- 110
Industry mix (Fortune 500 HQ in TX)
| Industry | F500 HQs | Revenue |
|---|---|---|
| Energy | 16 | $1,198B |
|
||
| Technology | 5 | $198B |
|
||
| Engineering / Construction | 4 | $72B |
|
||
| Energy Services | 3 | $60B |
|
||
| Utilities | 3 | $41B |
|
||
| Healthcare | 2 | $330B |
|
||
Price history
-49.3% since first listed57 events — show timeline
- 2026-06-16 Price Changed $35,000 FSBO.com
- 2026-05-12 Listed $62,999 FSBO.com
- 2025-04-21 Listing Removed — LERA
- 2025-04-18 Listed $32,000 LERA
- 2025-04-16 Listing Removed — LERA
- 2025-04-14 Listed $82,000 LERA
- 2025-04-02 Price Changed $53,000 LERA
- 2025-04-01 Listing Removed — LERA
- 2025-01-23 Listed $60,000 LERA
- 2024-09-07 Listing Removed — LERA
- 2024-08-30 Listed $84,990 LERA
- 2024-02-29 Listing Removed — LERA
- 2024-02-25 Listed $58,000 LERA
- 2021-05-18 Listing Removed — LERA
- 2021-05-17 Listed $55,000 LERA
- 2021-05-10 Listing Removed — LERA
- 2021-05-05 Listing Removed — LERA
- 2021-05-02 Contingent — LERA
- 2021-05-01 Price Changed $94,500 LERA
- 2021-04-25 Listed $99,500 LERA
- 2021-04-10 Listed $72,900 LERA
- 2021-01-07 Listing Removed — LERA
- 2021-01-07 Listed $72,900 LERA
- 2020-03-05 Listing Removed — LERA
- 2020-03-04 Listed $45,000 LERA
- 2019-08-13 Listing Removed — LERA
- 2019-08-12 Listed $65,000 LERA
- 2019-05-28 Listing Removed — LERA
- 2019-05-24 Listing Removed — LERA
- 2019-05-07 Listed $39,900 LERA
- 2019-05-04 Price Changed $49,900 LERA
- 2019-04-26 Listing Removed — LERA
- 2019-04-15 Listed $51,500 LERA
- 2019-03-30 Listed $35,000 LERA
- 2018-09-05 Listing Removed — LERA
- 2018-08-22 Listed $105,000 LERA
- 2016-05-23 Listing Removed — LERA
- 2016-05-17 Listed $65,000 LERA
- 2015-10-14 Listing Removed — LERA
- 2015-09-11 Price Changed $29,900 LERA
- 2015-09-02 Listed $35,000 LERA
- 2015-02-25 Listing Removed — LERA
- 2015-02-15 Listed $55,000 LERA
- 2013-07-15 Listing Removed — LERA
- 2013-05-01 Listed $49,900 LERA
- 2010-04-22 Listing Removed — LERA
- 2010-04-19 Listing Removed — LERA
- 2010-03-30 Listed $38,000 LERA
- 2010-02-23 Listed $80,000 LERA
- 2009-07-13 Listing Removed — LERA
- 2009-07-13 Listing Removed — LERA
- 2009-05-12 Listed $54,900 LERA
- 2008-08-25 Listed $42,900 LERA
- 2007-02-22 Listing Removed — LERA
- 2006-11-15 Listed $65,000 LERA
- 2005-07-28 Listing Removed — LERA
- 2005-07-27 Listed $69,000 LERA
Property tax history
+11.6%/yrLatest (2025): $1,659 · -2.0% YoY. Source: county tax records.
Cash-flow waterfall
monthlySold comps — $/sqft
last 12 mo · ≤1 miLoading sold comps…