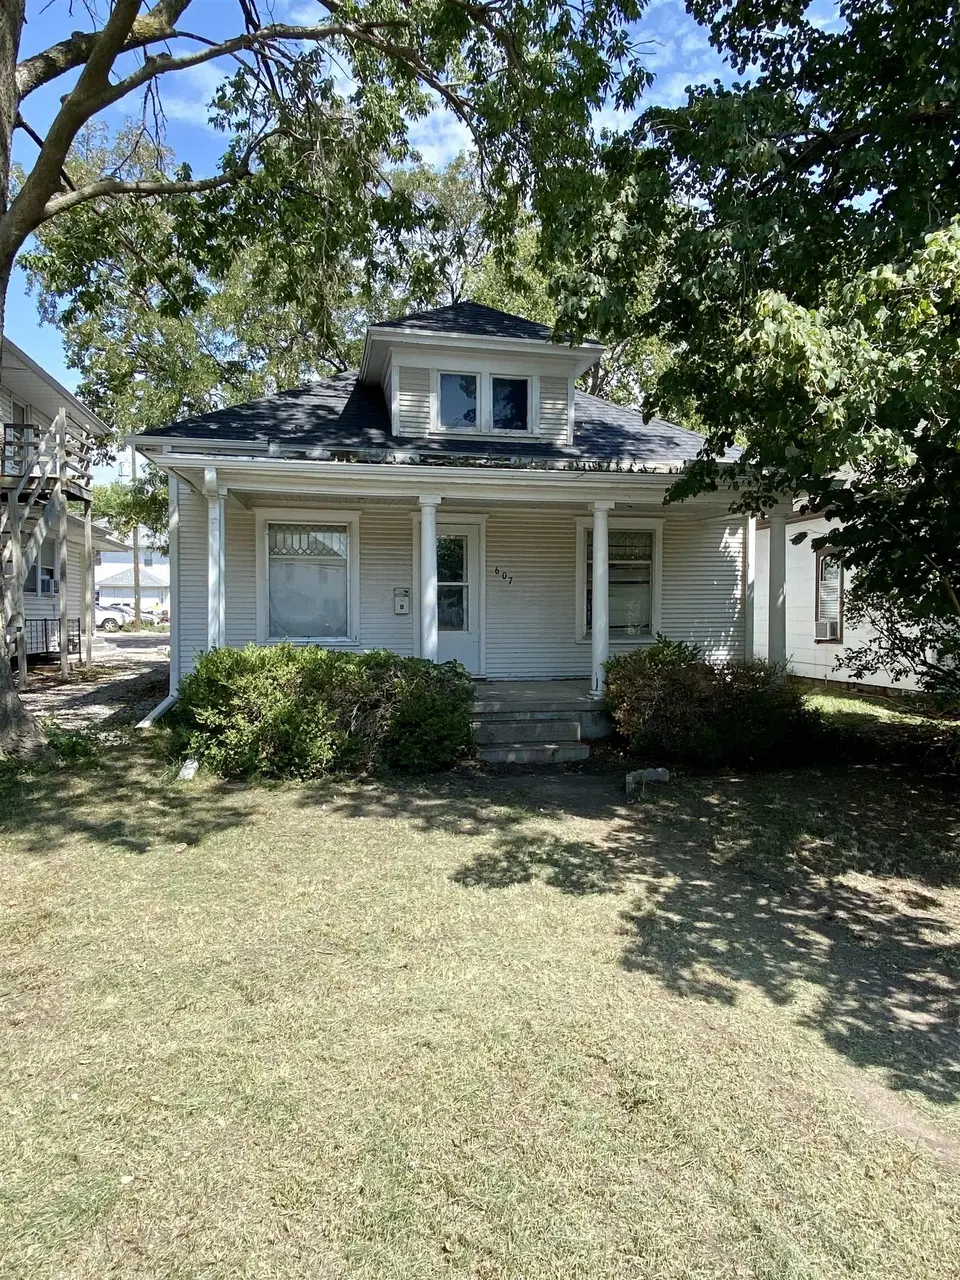
607 W 25th St · Kearney, NE
Flood risk 1/10 · Minimal
- FEMA flood zone
- X (unshaded)
- Chance of flooding over 30 yrs
- 0.0%
- Est. flood insurance / yr
- $473 – $860
Fire risk 1/10 · Minimal
- Est. fire insurance / yr
- $1,161 – $2,155
Heat risk 3/10 · Minor
- Hot days now (above 101°F)
- 7 days/yr
- Hot days in 30 yrs
- 16 days/yr
Wind risk 2/10 · Minimal
- Chance of severe wind over 30 yrs
- —
Air-quality risk 1/10 · Minimal
- Unhealthy air days now
- 0 days/yr
- Unhealthy air days in 30 yrs
- 0 days/yr
Risk factors via First Street. Map © Google.
Why this score? — see what drove the A- grade
The composite is a weighted blend of 9 inputs, each scored 0–100. Each bar is that input's sub-score; the figure is the points it added to the 100-point composite (weight × sub-score).
- Cash flow +30.0/30.0
- ARV discount +15.0/15.0
- 1% rule +10.0/10.0
- DSCR +10.0/10.0
- Schools +4.7/10.0
- Rent growth +4.4/5.0
- Livability +4.2/5.0
- Condition / age +2.5/5.0
- Appreciation +0.0/10.0
$134,900
🖨 Deal sheet 📄 Offer letter ✓ Due diligence
Listing remarks MLS
-
Key facts
- Alley access
- New furnace
- R-3 zoning
Tags
Property features AI
Exterior
- Utilities: Public water; Public sewer; Cable available; Natural gas available
- Home design: Single-family residence; Residential property
- Construction: Wood frame with wood siding
- Exterior features: 30' x 130' lot; R-3 zoning
Interior
- Bathrooms: One main-level bathroom
- Heating & cooling: Forced air heating; Central air conditioning
- Interior features: Gas water heater; Partial basement
- Laundry & utility: Laundry on the main level
Neighborhood map
What this means for you Summary
Snapshot
- This is a 3-bed/1.0-bath single-family listed at $135k.
Deal economics
- At list price, monthly cash flow is $922 ($11k/yr) — positive.
- The deal already cash-flows at list — no discount required.
- Meets the 1% rule at list price ($2k rent vs $135k).
- Cap rate 14.5% vs local median 2.5% in Kearney — top-decile yield for the area; either an underpriced asset or a hidden risk that comps aren't pricing in. Stress-test before assuming the spread holds.
Location & tenants
- Location reads 83/100 on livability (#11 in NE, #858 nationally) — a professional / high-income tenant draw. Strengths: cost of living A+, housing A+, health & safety A+; Watch: commute F.
- Kearney Public Schools (town): math 55% / reading 54% proficiency, ranked #43 of 111 in NE (top 39%) — acceptable for families but not a draw, mixed tenant base, ~2y average lease.
- Market conditions: Rents rising fast (+7.7%/yr); 133 active listings in the ZIP; 3 comparable units currently listed for rent nearby; rentals lingering (median 44d on market — plan ~5-8 weeks vacancy on turnover, expect pricing pressure); 100% of comp listings sitting > 30 days — soft ceiling on asking rent; solid renter incomes; 125 units permitted in Buffalo County in 2024 (0 in 5+ unit buildings).
- This rent runs 36% of the median local income ($77k/yr) — at the standard rent-burdened threshold; future hikes will face affordability resistance.
Forward outlook
- Local home prices are declining (-3.0%/yr); year-one equity from $933 of loan paydown is wiped out by about $4k of value loss. Plan a longer hold.
- Buffalo County population projected at +31% by 2050 — long-run rental-demand tailwind backs the buy-and-hold thesis.
- At projected returns (-3.0% appreciation + 7.7% rent growth), your $38k cash investment doubles in ~4 years — after that, you're playing with house money.
Negotiation context
- Only 6 days on market — expect competitive offers; lowballing is unlikely to land.
- 3 sale attempts since 8y ago; this cycle's ask has dropped $10k (7%) from the opening price — seller is motivated, your offer sets the floor, not the list.
- Current owner paid $104k; 30% above their basis — modest negotiation headroom, anchor on the comps not their cost.
Risks & watch-outs
- Watch-outs: built in 1917 — expect roof / HVAC / electrical / plumbing capex.
Questions for the listing agent
- Built in 1917 — when were the roof, HVAC, electrical panel, plumbing, and water heater last replaced?
- Is there a deadline driving the sale (1031 exchange, divorce, estate, relocation)? That informs how much negotiation room exists.
- Schools are A-rated — typically a magnet for longer-tenancy family renters. What's the average tenant stay here, and is there a school-zone premium baked into asking?
- What's the average days-on-market for RENTAL listings here right now (not sales)? A rising rental-DOM trend means longer vacancies and softer asking-rent achievability than the comps imply.
- What's the recent tenant-quality profile in this submarket — average credit score on applications, eviction rate, late-payment / NSF rate, and stable-employment percentage? A property-management company in the area should have these aggregated.
- How much new for-sale + rental construction is in the pipeline within 1–3 miles? Heavy new supply typically softens prices + rents 12–24 months out; constrained supply supports both.
Investment metrics
- 1% rule
- 1.72% ✓
- Cap rate
- 14.49%
- Cash-on-cash
- 29.28%
- DSCR
- 2.30
- GRM
- 4.9
CMA / ARV
- ARV (on-the-fly)
- $239,616
- Comps found
- 12
Show comp detail 12 sales within ~0.75 mi
| Address | Dist | Beds/Ba | Sqft | Sold | Price | $/sf | Match |
|---|---|---|---|---|---|---|---|
| 607 W 25th St | 0.00mi | 3/1.0 | 1,872 (0%) | 0mo | $130,000 | $69 | 100 |
| 711 W 31st St | 0.42mi | 3/2.0 | 1,958 (+5%) | 1mo | $277,700 | $142 | 68 |
| 522 W 25th St | 0.06mi | 3/2.0 | 2,150 (+15%) | 1mo | $237,000 | $110 | 68 |
| 816 W 24th St | 0.19mi | 4/2.0 (+1) | 2,048 (+9%) | 5mo | $220,000 | $107 | 62 |
| 819 W 24th St | 0.18mi | 4/2.0 (+1) | 1,607 (-14%) | 2mo | $220,000 | $137 | 58 |
| 2010 3rd Ave | 0.40mi | 3/2.0 | 1,664 (-11%) | 2mo | $230,000 | $138 | 57 |
| 3214 10th Ave | 0.59mi | 2/2.0 (-1) | 1,810 (-3%) | 8mo | $269,000 | $149 | 51 |
| 1701 7th Ave | 0.64mi | 3/2.0 | 1,738 (-7%) | 5mo | $150,000 | $86 | 50 |
| 3311 Lakeview Dr | 0.70mi | 4/2.0 (+1) | 1,824 (-3%) | 9mo | $325,000 | $178 | 47 |
| 2204 15th Ave | 0.62mi | 4/2.0 (+1) | 1,994 (+6%) | 8mo | $235,000 | $118 | 45 |
| 2205 C Ave | 0.72mi | 3/3.0 | 1,995 (+7%) | 5mo | $254,900 | $128 | 43 |
| 218 W 33rd St | 0.59mi | 2/1.0 (-1) | 1,596 (-15%) | 4mo | $147,500 | $92 | 40 |
Match score weights: distance 35% · size 25% · config 20% · recency 20%. Top-matched comps best support the ARV.
Projected returns pro-forma
-3.0% appreciation · 7.74% rent growth · sell at horizon
- IRR
- 28.9%
- Equity multiple
- 2.28×
- Total profit
- $48,432
- Equity at exit
- $20,114
- IRR
- 38.9%
- Equity multiple
- 5.51×
- Total profit
- $170,245
- Equity at exit
- $11,664
Cash invested: $37,772 (down + closing). Projections, not guarantees.
Landlord ↔ Tenant lean methodology
- Overall (STATE)
- 83 Strongly Landlord-Friendly
- State Nebraska
- 83 Strongly Landlord-Friendly · R+13
- County
- — inherits STATE
- City
- — inherits STATE
ZIP-level market 68845
- Rents YoY
- 7.7%
- Active inventory
- 133
- Price-to-rent
- 4.9×
Monthly cashflow live
- Estimated rent
- $2,317 medium interval (Pro) →
- Mortgage (P&I)
- −$707
- Tax from tax record
- −$145 /mo · $1,744/yr
- Insurance
- −$56
- HOA
- −$0
- Vacancy / Maint / Mgmt
- −$487
- Net cashflow
- $922
Break-even live
UW: 25.0% down · 7.5% · 30yr · 1.5% tax · 5.0% vac · 8.0% maint · 8.0% mgmt
Financing live
Cash to close
- Down payment
- $33,725
- Closing costs
- $4,047
- Reserves months
- —
- Total cash needed
- —
Loan-product check · same deal, 3 products live
Conventional
25% down · 7.5% · 30yr
- Down + closing
- —
- Monthly P&I
- —
- Monthly cashflow
- —
- DSCR
- —
- Eligible?
- —
Personal DTI + credit; lowest rate.
DSCR
20% down · 8.5% · 30yr
- Down + closing
- —
- Monthly P&I
- —
- Monthly cashflow
- —
- DSCR
- —
- Eligible?
- —
No personal income docs; deal must DSCR.
Hard money
10% down · 12.0% · 12mo
- Down + closing
- —
- Monthly P&I
- —
- Monthly cashflow
- —
- DSCR
- —
- Eligible?
- —
Short-term bridge; refi at stabilization.
Rent comps 3 comps
| Address | Beds | Baths | Sqft | Rent | $/sqft | DOM | Units | Dist |
|---|---|---|---|---|---|---|---|---|
| 2114 University Dr Kearney, NE | 2.0 | 1.0–2.0 | 1022 | $2,545 | $2.49 | 43d | 23 | 1.12mi |
| 2109 Chancellors Ave Kearney, NE | 2.0 | 2.5 | 1753 | $2,495 | $1.42 | 43d | 1 | 1.15mi |
| 2005 Chancellors Ave Kearney, NE | 2.0 | 2.5 | 1753 | $2,495 | $1.42 | 43d | 1 | 1.16mi |
Listing history 7 events
-
2026-05-18$144,900 Active
-
2026-01-13price $183,900
-
2025-09-17price $198,500
-
2025-08-15$204,000 Active
-
2019-02-01soldstatus $104,000 1-char remark
Show marketing remark (1 chars)
-
-
2019-02-01soldstatus $104,000
Show marketing remark (1 chars)
-
-
2018-10-01$114,900 1-char remark
Show marketing remark (1 chars)
-
ⓘ Source: listings_history table (triggers on properties + properties_extension) + one-shot
backfill from property_details.listing_events for pre-trigger history.
Tax reassessment forecast NE · Resets to sale price
- Current annual tax
- $1,744 · $145/mo
- Projected year-2 tax
- $2,334 · $194/mo
- Expected delta
- +$590/yr (+$49/mo · 33.8%)
ⓘ Screening estimate from a state-policy table — verify with the county assessor before closing.
Climate risk First Street
- Flood 1/10 Low FEMA zone X (unshaded) · 0% chance over 30 yrs
- Wildfire 1/10 Low
- Heat 3/10 Moderate 7 d/yr ≥101°F today · 16 d/yr by 30 yrs out
- Wind 2/10 Low
- Air quality 1/10 Low 0 unhealthy d/yr today · 0 by 30 yrs out
Nearby sold comps map
Loading sold comps map…
Walkable amenities ~0.75 mi
Loading nearby amenities…
Taxation est. · year 1
- Rental income
- $27,805
- − Mortgage interest
- −$7,556
- − Property taxes
- −$1,744
- − Insurance
- −$674
- − Repairs & maintenance
- −$2,224
- − Management
- −$2,224
- − Depreciation
- −$3,924
- Taxable income
- $9,457
- Est. tax owed @ 24.0%
- −$2,270
- After-tax cash flow
- $8,789/yr
For passive investors: Depreciation is non-cash, so a rental often shows a tax loss while cash-flowing — sheltering income. Rental losses are passive: they offset passive income freely, and up to $25,000/yr can offset ordinary (W-2) income if you actively participate and your MAGI is under $100k (phasing out to $0 by $150k); unused losses carry forward. On sale, claimed depreciation is recaptured at up to 25%, and gains may owe capital-gains tax (a 1031 exchange can defer both). Figures are a year-1 estimate at your 24.0% rate — not tax advice; consult a CPA.
Schools (NCES district)
- District
- Kearney Public Schools
- NCES district ID
- 3172390
- Math proficiency
- 55% ▼ -3.00%
- Reading proficiency
- 54% ▼ -4.00%
- Median HH income
- $50,913
- Composite
- 46.61/100
- National rank
- #2415
- State rank
- #43 of 111 in NE
Livability — Kearney
- Score
- 83/100
- State rank
- #11
- US rank
- #858
Category grades
Schools grade is shown separately in the Schools card above.
Census & demographics
- Census place
- Kearney, NE
- County
- Buffalo County · 20,536 people
- City population
- 20,536
- Metro
- Kearney, NE
- Population (ZIP)
- 20,536
- Household income
- $76,978
- Rent vs Own
- Severe rent burden
- 661.0
Population outlook (Buffalo County) Hauer SSP2
- Today (2025)
- 54,980 people
- By 2030
- 58,298 · +6.0%
- By 2040
- 64,975 · +18.2%
- By 2050
- 72,054 · +31.1%
- By 2075
- 90,838 · +65.2%
- By 2100
- 106,838 · +94.3%
Race, ethnicity, and origin ACS 2023
- Neighborhood character
- Predominantly White (85%)
- Race & ethnicity
- White 85% Hispanic / Latino 10% Two or more races 5% Black 1% Asian 1%
- Hispanic origin (detail)
- Mexican 8%
- Common ancestry
- Romanian 3% Italian 3% Lithuanian 2%
- Foreign-born
- 5% · Canada
- Languages at home
- 91% English-only · Spanish 7% German/W. Germanic 1% Other Asian/Pacific 1%
Political lean MEDSL · Buffalo
- 2024 margin
- Solid R (+44.9) · D 26.9% · R 71.8% · Other 1.3%
- 2008→2024 swing
- -7.5pp toward R · 2008: -37.5pp · 2024: -44.9pp
- All cycles
- 2024: R+44.9 2020: R+43.4 2016: R+47.5 2012: R+42.6 2008: R+37.5
Not yet ingested
- Civics
- —
Market trends
- HPI YoY
- ▼ -127.38%
- Current HPI
- 218.8182
- Rent YoY
- ▲ 7.74%
- Metro
- Kearney, NE
- State GDP YoY
- ▲ 0.68%
- F500 in state
- 2
Industry mix (Fortune 500 HQ in NE)
| Industry | F500 HQs | Revenue |
|---|---|---|
| Conglomerate | 1 | $371B |
|
||
Price history
+26.1% since first listed7 events — show timeline
- 2026-05-18 Listed $144,900 GMNMLS
- 2026-01-13 Price Changed $183,900 GMNMLS
- 2025-09-17 Price Changed $198,500 GMNMLS
- 2025-08-15 Listed $204,000 GMNMLS
- 2019-02-01 Sold (Public Records) $104,000 Public Records
- 2019-02-01 Sold (MLS) $104,000 GMNMLS
- 2018-10-01 Listed $114,900 GMNMLS
Property tax history
+7.1%/yrLatest (2025): $1,744 · +3.7% YoY. Source: county tax records.
Cash-flow waterfall
monthlySold comps — $/sqft
last 12 mo · ≤1 miLoading sold comps…