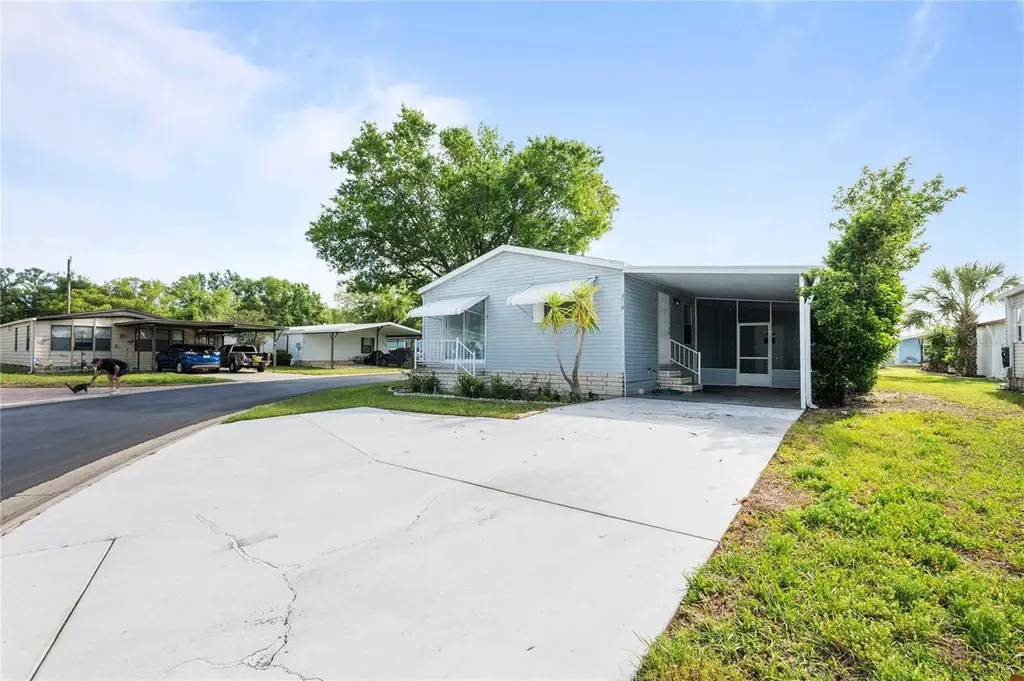
3210 Hickory Dr · Wesley Chapel, FL
Flood risk 1/10 · Minimal
- FEMA flood zone
- X (unshaded)
- Chance of flooding over 30 yrs
- 0.0%
- Est. flood insurance / yr
- $507 – $1,088
Fire risk 5/10 · Moderate
- Est. fire insurance / yr
- $947 – $1,759
Heat risk 9/10 · Severe
- Hot days now (above 108°F)
- 7 days/yr
- Hot days in 30 yrs
- 25 days/yr
Wind risk 9/10 · Severe
- Chance of severe wind over 30 yrs
- 99.0%
Air-quality risk 2/10 · Minimal
- Unhealthy air days now
- 2 days/yr
- Unhealthy air days in 30 yrs
- 2 days/yr
Risk factors via First Street. Map © Google.
Why this score? — see what drove the C grade
The composite is a weighted blend of 9 inputs, each scored 0–100. Each bar is that input's sub-score; the figure is the points it added to the 100-point composite (weight × sub-score).
- Cash flow +23.8/30.0
- 1% rule +7.9/10.0
- DSCR +7.7/10.0
- Schools +4.3/10.0
- Livability +4.0/5.0
- ARV discount +3.5/15.0
- Condition / age +2.5/5.0
- Rent growth +2.4/5.0
- Appreciation +0.0/10.0
$139,000
🖨 Deal sheet 📄 Offer letter ✓ Due diligence
Listing remarks MLS
.
Key facts
- Open floor plan
- Screened-in patio
- Walk-in shower
Tags
Property features AI
Finance
- Other: Total annual association fees reported
- Financial info: Lease restrictions apply
- HOA & community: Timber Lake Estates community; Association amenities include clubhouse, playground, pool and recreation facilities; Association maintains common grounds and utilities (water, sewer) and common area taxes; Buyer approval required for association; Monthly association fee $217; Pets allowed (cats and dogs; size limits apply); Deed restrictions and community mailbox; golf carts permitted
Exterior
- Parking: Covered parking; Carport (1 space)
- Utilities: Public water; Public sewer; Cable available; High-speed internet available; Electricity connected; Water connected; Sewer connected
- Home design: Manufactured home (double wide); Single-story; Faces west; Corner lot, level and private
- Construction: Vinyl siding; Shingle roof; Crawlspace foundation
- Exterior features: Patio (screened); Sliding doors; Storage
Interior
- Kitchen: Dishwasher; Microwave; Range; Range hood; Refrigerator; Electric water heater
- Bedrooms: 2 bedrooms
- Flooring: Carpet; Hardwood; Laminate
- Bathrooms: 2 full bathrooms
- Heating & cooling: Central heating (electric); Central air conditioning
- Interior features: Ceiling fans; Open floor plan; Blinds on windows
- Laundry & utility: Laundry closet; Inside utility
Neighborhood map
What this means for you Summary
Snapshot
- This is a 2-bed/2.0-bath manufactured listed at $139k.
Deal economics
- At list price, monthly cash flow is $268 ($3k/yr) — positive.
- The deal already cash-flows at list — no discount required.
- Meets the 1% rule at list price ($2k rent vs $139k).
- Recommended offer: $131k (6.0% below list) — sets the bar for market timing.
- Cap rate 8.6% vs local median 3.7% in Wesley Chapel — top-decile yield for the area; either an underpriced asset or a hidden risk that comps aren't pricing in. Stress-test before assuming the spread holds.
Location & tenants
- Location reads 79/100 on livability (#143 in FL, #2,137 nationally) — a middle-class / working-renter tenant base. Strengths: employment A+, housing A+, health & safety A+; Watch: commute F.
- Pasco (suburban): math 50% / reading 52% proficiency, ranked #32 of 73 in FL (top 44%) — acceptable for families but not a draw, mixed tenant base, ~2y average lease.
- Market conditions: Rents soft (-0.4%/yr); 638 active listings in the ZIP; 5 comparable units currently listed for rent nearby; rentals leasing fast (median 13d on market — plan ~1-2 weeks tenant-placement turnaround); solid renter incomes; 6,765 units permitted in Pasco County in 2024 (1,250 in 5+ unit buildings).
Forward outlook
- Local home prices are declining (-3.0%/yr); year-one equity from $961 of loan paydown is wiped out by about $4k of value loss. Plan a longer hold.
- Pasco County population projected at +29% by 2050 — long-run rental-demand tailwind backs the buy-and-hold thesis.
Negotiation context
- It's been on market 72 days — a 6% lower offer ($131k) is reasonable based on typical stale-listing flexibility.
- 2 sale attempts since 21y ago with the ask held roughly flat each time — persistent listings suggest the price (not the market) is what's stuck; bring a comps-based counter.
- Current owner paid $46k; list at $139k implies a 202% gain — meaningful room to come down on a strong offer.
Risks & watch-outs
- Climate carrying-cost: severe wind risk, 99% chance of damaging wind over 30y; moderate wildfire risk; extreme-heat days projected 7→25/yr by 2055 (HVAC capex compounding) — expect insurance premiums to compound above CPI over the hold.
Questions for the listing agent
- It's been on market 72 days. Have you received any prior offers? Is the seller open to a 6% concession, seller financing, or rate buy-down credit?
- What does the HOA fee cover, when was the last increase, and are there any pending special assessments or reserve-fund shortfalls?
- Why hasn't it sold? Are there any deal-killer items the seller is aware of (foundation, flood, title, zoning, code violations)?
- Is there a deadline driving the sale (1031 exchange, divorce, estate, relocation)? That informs how much negotiation room exists.
- Schools are B-rated — typically a magnet for longer-tenancy family renters. What's the average tenant stay here, and is there a school-zone premium baked into asking?
- What's the average days-on-market for RENTAL listings here right now (not sales)? A rising rental-DOM trend means longer vacancies and softer asking-rent achievability than the comps imply.
- What's the recent tenant-quality profile in this submarket — average credit score on applications, eviction rate, late-payment / NSF rate, and stable-employment percentage? A property-management company in the area should have these aggregated.
- How much new for-sale + rental construction is in the pipeline within 1–3 miles? Heavy new supply typically softens prices + rents 12–24 months out; constrained supply supports both.
Investment metrics
- 1% rule
- 1.29% ✓
- Cap rate
- 8.61%
- Cash-on-cash
- 8.26%
- DSCR
- 1.37
- GRM
- 6.5
CMA / ARV
- ARV (on-the-fly)
- $127,680
- Comps found
- 12
Show comp detail 12 sales within ~0.75 mi
| Address | Dist | Beds/Ba | Sqft | Sold | Price | $/sf | Match |
|---|---|---|---|---|---|---|---|
| 34121 Tree Lake Dr | 0.09mi | 2/2.0 | 988 (+3%) | 9mo | $118,000 | $119 | 83 |
| 34616 Morning Glory Gln | 0.62mi | 2/2.0 | 960 (0%) | 8mo | $53,000 | $55 | 65 |
| 3915 Julie Dr | 0.72mi | 2/1.5 | 964 (+0%) | 6mo | $90,000 | $93 | 58 |
| 34135 Brown Byu | 0.20mi | 3/2.0 (+1) | 1,081 (+13%) | 10mo | $160,000 | $148 | 56 |
| 3906 Sarah Dr | 0.74mi | 2/2.0 | 936 (-2%) | 7mo | $128,000 | $137 | 55 |
| 34630 Petunia Pl | 0.62mi | 2/2.0 | 864 (-10%) | 10mo | $115,000 | $133 | 46 |
| 3010 Whispering Ln | 0.25mi | 3/2.0 (+1) | 1,104 (+15%) | 15mo | $172,000 | $156 | 46 |
| 34704 Morning Glory Gln | 0.69mi | 3/2.0 (+1) | 888 (-8%) | 6mo | $60,000 | $68 | 46 |
| 34645 Lily Ln | 0.64mi | 2/2.0 | 1,056 (+10%) | 10mo | $127,500 | $121 | 45 |
| 3921 Chris Dr | 0.74mi | 2/2.0 | 1,056 (+10%) | 8mo | $142,500 | $135 | 42 |
| 3914 Kim Dr | 0.74mi | 2/2.0 | 1,056 (+10%) | 12mo | $145,000 | $137 | 39 |
| 34632 Sweetpea Ln | 0.63mi | 2/1.0 | 816 (-15%) | 6mo | $70,000 | $86 | 37 |
Match score weights: distance 35% · size 25% · config 20% · recency 20%. Top-matched comps best support the ARV.
Projected returns pro-forma
-3.0% appreciation · 0.0% rent growth · sell at horizon
- IRR
- -7.6%
- Equity multiple
- 0.73×
- Total profit
- $-10,559
- Equity at exit
- $20,725
- IRR
- -3.1%
- Equity multiple
- 0.82×
- Total profit
- $-6,908
- Equity at exit
- $12,018
Cash invested: $38,920 (down + closing). Projections, not guarantees.
Landlord ↔ Tenant lean methodology
- Overall (STATE)
- 87 Strongly Landlord-Friendly
- State Florida
- 87 Strongly Landlord-Friendly · R+3
- County
- — inherits STATE
- City
- — inherits STATE
ZIP-level market 33543
- Home prices YoY
- -24.0%
- Rents YoY
- -0.4%
- Active inventory
- 638
- Price-to-rent
- 6.5×
Monthly cashflow live
- Estimated rent
- $1,789 high interval (Pro) →
- Mortgage (P&I)
- −$729
- Tax from tax record
- −$141 /mo · $1,697/yr
- Insurance
- −$58
- HOA
- −$217
- Vacancy / Maint / Mgmt
- −$376
- Net cashflow
- $268
Break-even live
UW: 25.0% down · 7.5% · 30yr · 1.5% tax · 5.0% vac · 8.0% maint · 8.0% mgmt
Financing live
Cash to close
- Down payment
- $34,750
- Closing costs
- $4,170
- Reserves months
- —
- Total cash needed
- —
Loan-product check · same deal, 3 products live
Conventional
25% down · 7.5% · 30yr
- Down + closing
- —
- Monthly P&I
- —
- Monthly cashflow
- —
- DSCR
- —
- Eligible?
- —
Personal DTI + credit; lowest rate.
DSCR
20% down · 8.5% · 30yr
- Down + closing
- —
- Monthly P&I
- —
- Monthly cashflow
- —
- DSCR
- —
- Eligible?
- —
No personal income docs; deal must DSCR.
Hard money
10% down · 12.0% · 12mo
- Down + closing
- —
- Monthly P&I
- —
- Monthly cashflow
- —
- DSCR
- —
- Eligible?
- —
Short-term bridge; refi at stabilization.
Rent comps 5 comps
| Address | Beds | Baths | Sqft | Rent | $/sqft | DOM | Units | Dist |
|---|---|---|---|---|---|---|---|---|
| 3030 Beaver Creek Dr Wesley Chapel, FL | 2.0 | 1.0 | 700 | $950 | $1.36 | 14d | 1 | 0.32mi |
| 3829 Kim Dr Wesley Chapel, FL | 2.0 | 1.0 | 832 | $1,395 | $1.68 | 24d | 1 | 0.66mi |
| 33780 Charleston Club Cir Wesley Chapel, FL | 1.0–2.0 | 1.0–2.0 | 977 | $2,135 | $2.19 | 2d | 11 | 0.90mi |
| 33976 Lusitano Dr Wesley Chapel, FL | 1.0–3.0 | 1.0–2.5 | 1251 | $2,284 | $1.82 | 12d | 71 | 1.35mi |
| 34002 Painthorse Way Wesley Chapel, FL | 1.0–3.0 | 1.0–2.0 | 1022 | $2,208 | $2.16 | 2d | 46 | 1.46mi |
HOA detail
- Monthly dues
- $217 · $2,604/yr
Listing history 16 events
-
2026-06-18days on market $139,000 Active 72 DOM
-
2026-06-17days on market $139,000 Active 71 DOM
-
2026-06-16days on market $139,000 Active 70 DOM
-
2026-06-15days on market $139,000 Active 69 DOM
-
2026-06-13days on market $139,000 Active 67 DOM
-
2026-06-09days on market $139,000 Active 63 DOM
-
2026-06-08days on market $139,000 Active 62 DOM
-
2026-06-07days on market $139,000 Active 61 DOM
-
2026-06-04days on market $139,000 Active 58 DOM
-
2026-06-03days on market $139,000 Active 57 DOM
-
2026-06-02days on market $139,000 Active 56 DOM
-
2026-06-01days on market $139,000 Active 55 DOM
-
2026-05-31days on market $139,000 Active 54 DOM
-
2026-04-07$139,000 Active
-
2005-05-03soldstatus $46,000 1-char remark
Show marketing remark (1 chars)
.
-
2005-02-01$59,900 1-char remark
Show marketing remark (1 chars)
.
ⓘ Source: listings_history table (triggers on properties + properties_extension) + one-shot
backfill from property_details.listing_events for pre-trigger history.
Tax reassessment forecast FL · Resets to sale price
- Current annual tax
- $1,697 · $141/mo
- Projected year-2 tax
- $1,697 · $141/mo
- Expected delta
- $0/yr ($0/mo · 0.0%)
ⓘ Screening estimate from a state-policy table — verify with the county assessor before closing.
Climate risk First Street
- Flood 1/10 Low FEMA zone X (unshaded) · 0% chance over 30 yrs
- Wildfire 5/10 Major
- Heat 9/10 Extreme 7 d/yr ≥108°F today · 25 d/yr by 30 yrs out
- Wind 9/10 Extreme 99% chance of damaging wind over 30 yrs
- Air quality 2/10 Low 2 unhealthy d/yr today · 2 by 30 yrs out
Nearby sold comps map
Loading sold comps map…
Walkable amenities ~0.75 mi
Loading nearby amenities…
Taxation est. · year 1
- Rental income
- $21,467
- − Mortgage interest
- −$7,786
- − Property taxes
- −$1,697
- − Insurance
- −$695
- − Repairs & maintenance
- −$1,717
- − Management
- −$1,717
- − HOA
- −$2,604
- − Depreciation
- −$4,044
- Taxable income
- $1,206
- Est. tax owed @ 24.0%
- −$290
- After-tax cash flow
- $2,926/yr
For passive investors: Depreciation is non-cash, so a rental often shows a tax loss while cash-flowing — sheltering income. Rental losses are passive: they offset passive income freely, and up to $25,000/yr can offset ordinary (W-2) income if you actively participate and your MAGI is under $100k (phasing out to $0 by $150k); unused losses carry forward. On sale, claimed depreciation is recaptured at up to 25%, and gains may owe capital-gains tax (a 1031 exchange can defer both). Figures are a year-1 estimate at your 24.0% rate — not tax advice; consult a CPA.
Schools (NCES district)
- District
- Pasco
- NCES district ID
- 1201530
- Math proficiency
- 50% ▼ -10.00%
- Reading proficiency
- 52% ▼ -5.00%
- Median HH income
- $45,039
- Composite
- 43.14/100
- National rank
- #3074
- State rank
- #32 of 73 in FL
Livability — Wesley Chapel
- Score
- 79/100
- State rank
- #143
- US rank
- #2137
Category grades
Schools grade is shown separately in the Schools card above.
Census & demographics
- Census place
- Wesley Chapel, FL
- County
- Pasco County · 524,098 people
- City population
- 100,771
- Metro
- Tampa-St. Petersburg-Clearwater, FL
- Population (ZIP)
- 40,648
- Household income
- $107,349
- Rent vs Own
- Severe rent burden
- 407.0
Population outlook (Pasco County) Hauer SSP2
- Today (2025)
- 570,045 people
- By 2030
- 605,844 · +6.3%
- By 2040
- 674,806 · +18.4%
- By 2050
- 736,022 · +29.1%
- By 2075
- 862,900 · +51.4%
- By 2100
- 906,364 · +59.0%
Race, ethnicity, and origin ACS 2023
- Neighborhood character
- Diverse neighborhood (Simpson 0.67)
- Race & ethnicity
- White 51% Hispanic / Latino 22% Two or more races 15% Black 12% Asian 9%
- Hispanic origin (detail)
- Mexican 2% Puerto Rican 8% Cuban 2% Dominican 2%
- Common ancestry
- Romanian 3% Lithuanian 1% Scotch-Irish 1%
- Foreign-born
- 20% · Canada, Jamaica, China
- Languages at home
- 71% English-only · Spanish 16% Other Indo-European 2% Tagalog/Filipino 2%
Political lean MEDSL · Pasco
- 2024 margin
- Strong R (+25.2) · D 36.9% · R 62.1% · Other 1.0%
- 2008→2024 swing
- -21.6pp toward R · 2008: -3.6pp · 2024: -25.2pp
- All cycles
- 2024: R+25.2 2020: R+20.1 2016: R+21.6 2012: R+6.7 2008: R+3.6
Not yet ingested
- Civics
- —
Market trends
- HPI YoY
- ▼ -83.13%
- Current HPI
- 263.2513
- Rent YoY
- ▼ -0.37%
- Metro
- Tampa-St. Petersburg-Clearwater, FL
- State GDP YoY
- ▲ 3.28%
- F500 in state
- 36
Industry mix (Fortune 500 HQ in FL)
| Industry | F500 HQs | Revenue |
|---|---|---|
| Industrial Technology | 2 | $29B |
|
||
| Insurance | 2 | $17B |
|
||
| Retail | 1 | $60B |
|
||
| Technology Distribution | 1 | $58B |
|
||
| Homebuilding | 1 | $35B |
|
||
| Technology Manufacturing | 1 | $35B |
|
||
Price history
+132.1% since first listed3 events — show timeline
- 2026-04-07 Listed $139,000 Stellar MLS as Distributed by MLS Grid
- 2005-05-03 Sold (MLS) $46,000 Stellar MLS as Distributed by MLS Grid
- 2005-02-01 Listed $59,900 Stellar MLS as Distributed by MLS Grid
Property tax history
+5.4%/yrLatest (2025): $1,697 · +3.2% YoY. Source: county tax records.
Cash-flow waterfall
monthlySold comps — $/sqft
last 12 mo · ≤1 miLoading sold comps…