 Multi-family
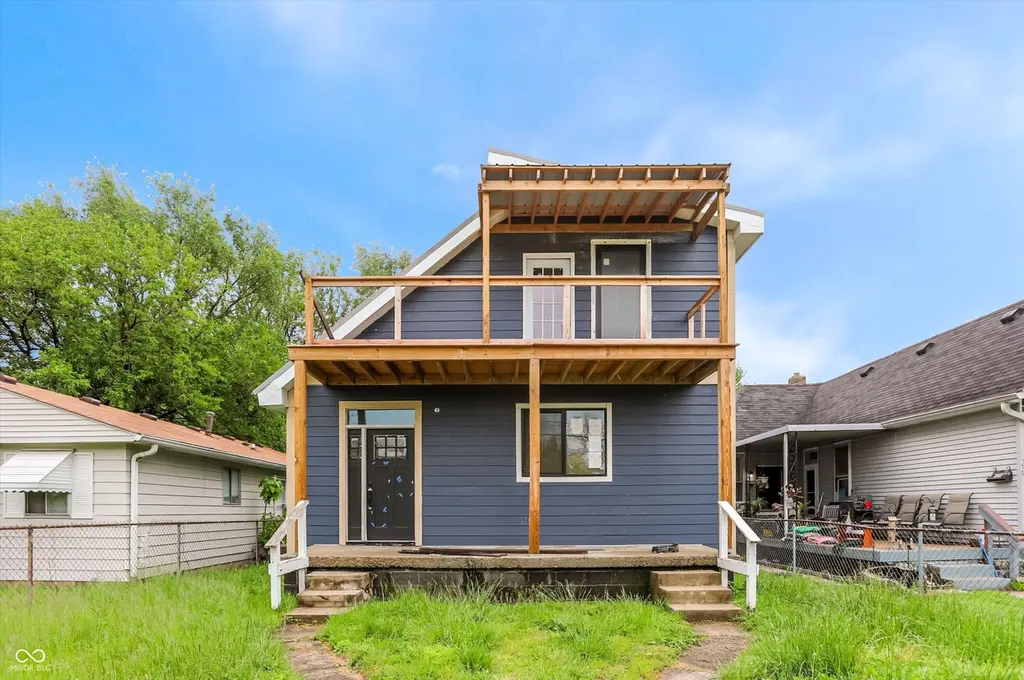
1425 Churchman Ave · Indianapolis city (balance), IN
Flood risk 1/10 · Minimal
- FEMA flood zone
- X (shaded)
- Chance of flooding over 30 yrs
- 0.0%
- Est. flood insurance / yr
- $507 – $1,088
Fire risk 1/10 · Minimal
- Est. fire insurance / yr
- $717 – $1,331
Heat risk 3/10 · Minor
- Hot days now (above 101°F)
- 7 days/yr
- Hot days in 30 yrs
- 19 days/yr
Wind risk 2/10 · Minimal
- Chance of severe wind over 30 yrs
- 1.0%
Air-quality risk 3/10 · Minor
- Unhealthy air days now
- 2 days/yr
- Unhealthy air days in 30 yrs
- 3 days/yr
Risk factors via First Street. Map © Google.
Why this score? — see what drove the B grade
The composite is a weighted blend of 9 inputs, each scored 0–100. Each bar is that input's sub-score; the figure is the points it added to the 100-point composite (weight × sub-score).
- Cash flow +30.0/30.0
- ARV discount +13.0/15.0
- DSCR +10.0/10.0
- 1% rule +9.4/10.0
- Rent growth +3.2/5.0
- Livability +2.5/5.0
- Condition / age +2.5/5.0
- Schools +1.4/10.0
- Appreciation +0.0/10.0
$180,000
🖨 Deal sheet 📄 Offer letter ✓ Due diligence
Multi-family units
County records classify this as Multi-Family (2-4 Unit). Listing-text estimate: 1 unit. estimate disagrees with records
Listing remarks MLS
Value add opportunity for a duplex in an up and coming area.
Key facts
- Partial drywall
- Gutted interior
- 4,182 sq ft lot
Tags
Property features AI
Exterior
- Utilities: Public water; Municipal sewer connected; Solid waste service available
- Home design: Single-family residence; Two levels
- Construction: Cement siding; Slab foundation
- Exterior features: Lot of approximately 0.1 acre
Interior
- Kitchen: No appliances listed
- Bedrooms: Four bedrooms total — one on the main level and three on the upper level
- Bathrooms: Three full bathrooms — one on the main level and two on the upper level
- Heating & cooling: No heating system listed; No cooling system listed
- Interior features: Walk-in closet(s)
- Laundry & utility: No laundry appliances listed
Neighborhood map
What this means for you Summary
Snapshot
- This is a 2-bed/3.0-bath multifamily listed at $180k.
Deal economics
- At list price, monthly cash flow is $804 ($10k/yr) — positive.
- The deal already cash-flows at list — no discount required.
- Meets the 1% rule at list price ($3k rent vs $180k).
- Cap rate 11.7% vs local median 4.4% in Indianapolis city (balance) — top-decile yield for the area; either an underpriced asset or a hidden risk that comps aren't pricing in. Stress-test before assuming the spread holds.
Location & tenants
- Location reads: area grade B — affects rentability + tenant quality, not the cash-flow math above.
- Indianapolis Public Schools (urban): math 14% / reading 20% proficiency, ranked #286 of 301 in IN (top 95%) — low school quality limits family demand, transient renter base, plan for 1-2y turnover; 77% free/reduced lunch — lower-income household profile, screen leases tightly.
- Market conditions: Rents rising (+2.9%/yr); 493 active listings in the ZIP; 37 comparable units currently listed for rent nearby; rentals at typical pace (median 24d on market — plan ~3-4 weeks tenant-placement turnaround); 49% of comp listings sitting > 30 days — soft ceiling on asking rent; 1,906 units permitted in Marion County in 2024 (621 in 5+ unit buildings).
- At $2,587/mo this rent would consume 54% of the median local household income ($57k/yr) (locally 1499% of renters already pay >50% of income on rent) — very limited rent-growth headroom before tenants either downsize or default.
Forward outlook
- Local home prices are declining (-3.0%/yr); year-one equity from $1k of loan paydown is wiped out by about $5k of value loss. Plan a longer hold.
- Marion County population projected at +18% by 2050 — long-run rental-demand tailwind backs the buy-and-hold thesis.
- At projected returns (-3.0% appreciation + 2.9% rent growth), your $50k cash investment doubles in ~7 years — after that, you're playing with house money.
Negotiation context
- Only 1 days on market — expect competitive offers; lowballing is unlikely to land.
- 5 sale attempts since 9y ago; this cycle's ask has dropped $45k (20%) from the opening price — seller is motivated, your offer sets the floor, not the list.
- Current owner paid $60k; list at $180k implies a 203% gain — meaningful room to come down on a strong offer.
Risks & watch-outs
- Watch-outs: built in 1900 — expect roof / HVAC / electrical / plumbing capex.
Questions for the listing agent
- Built in 1900 — when were the roof, HVAC, electrical panel, plumbing, and water heater last replaced?
- Is there a deadline driving the sale (1031 exchange, divorce, estate, relocation)? That informs how much negotiation room exists.
- What's the average days-on-market for RENTAL listings here right now (not sales)? A rising rental-DOM trend means longer vacancies and softer asking-rent achievability than the comps imply.
- What's the recent tenant-quality profile in this submarket — average credit score on applications, eviction rate, late-payment / NSF rate, and stable-employment percentage? A property-management company in the area should have these aggregated.
- How much new apartment / multifamily construction is in the pipeline within 1–3 miles? Heavy new supply (>2% of stock underway) typically softens rents 12–24 months out; light construction supports rent growth.
Investment metrics
- 1% rule
- 1.44% ✓
- Cap rate
- 11.65%
- Cash-on-cash
- 19.14%
- DSCR
- 1.85
- GRM
- 5.8
CMA / ARV
- ARV (on-the-fly)
- $204,864
- Comps found
- 1
Show comp detail 1 sale within ~0.75 mi
| Address | Dist | Beds/Ba | Sqft | Sold | Price | $/sf | Match |
|---|---|---|---|---|---|---|---|
| 1719 S Randolph St | 0.30mi | 1/1.0 (-1) | 616 (-12%) | 21mo | $179,500 | $291 | 34 |
Match score weights: distance 35% · size 25% · config 20% · recency 20%. Top-matched comps best support the ARV.
Projected returns pro-forma
-3.0% appreciation · 2.88% rent growth · sell at horizon
- IRR
- 10.9%
- Equity multiple
- 1.43×
- Total profit
- $21,755
- Equity at exit
- $26,839
- IRR
- 19.9%
- Equity multiple
- 2.66×
- Total profit
- $83,742
- Equity at exit
- $15,563
Cash invested: $50,400 (down + closing). Projections, not guarantees.
Landlord ↔ Tenant lean methodology
- Overall (STATE)
- 90 Strongly Landlord-Friendly
- State Indiana
- 90 Strongly Landlord-Friendly · R+11
- County
- — inherits STATE
- City
- — inherits STATE
ZIP-level market 46203
- Home prices YoY
- -26.7%
- Rents YoY
- 2.9%
- Active inventory
- 493
- Price-to-rent
- 11.6×
Monthly cashflow live
- Estimated rent
- $2,587 medium interval (Pro) →
- Mortgage (P&I)
- −$944
- Tax from tax record
- −$221 /mo · $2,651/yr
- Insurance
- −$75
- HOA
- −$0
- Vacancy / Maint / Mgmt
- −$543
- Net cashflow
- $804
Break-even live
2-unit breakdown (identical units grouped — click to expand)
| Units | Beds | Baths | Est. rent |
|---|---|---|---|
| 2× units | 2 | 1 | $2,586 |
| #1 | 2 | 1 | $1,293 |
| #2 | 2 | 1 | $1,293 |
| Total (2 units) | $2,587 | ||
UW: 25.0% down · 7.5% · 30yr · 1.5% tax · 5.0% vac · 8.0% maint · 8.0% mgmt
Financing live
Cash to close
- Down payment
- $45,000
- Closing costs
- $5,400
- Reserves months
- —
- Total cash needed
- —
Loan-product check · same deal, 3 products live
Conventional
25% down · 7.5% · 30yr
- Down + closing
- —
- Monthly P&I
- —
- Monthly cashflow
- —
- DSCR
- —
- Eligible?
- —
Personal DTI + credit; lowest rate.
DSCR
20% down · 8.5% · 30yr
- Down + closing
- —
- Monthly P&I
- —
- Monthly cashflow
- —
- DSCR
- —
- Eligible?
- —
No personal income docs; deal must DSCR.
Hard money
10% down · 12.0% · 12mo
- Down + closing
- —
- Monthly P&I
- —
- Monthly cashflow
- —
- DSCR
- —
- Eligible?
- —
Short-term bridge; refi at stabilization.
Rent comps 37 comps
| Address | Beds | Baths | Sqft | Rent | $/sqft | DOM | Units | Dist |
|---|---|---|---|---|---|---|---|---|
| 1503 Dawson St Indianapolis, IN | 2.0 | 1.0 | 700 | $1,200 | $1.71 | 43d | 1 | 0.22mi |
| 1026 Laurel St Indianapolis, IN | 1.0 | 1.0 | 655 | $860 | $1.31 | 43d | 1 | 0.27mi |
| 1727 S Randolph St Indianapolis, IN | 1.0 | 1.0 | 616 | $950 | $1.54 | 43d | 1 | 0.30mi |
| 1640 Asbury St Indianapolis, IN | 1.0 | 1.0 | 700 | $850 | $1.21 | 43d | 1 | 0.35mi |
| 1022 S Churchman Ave Unit 1024 Indianapolis, IN | 1.0 | 1.0 | 350 | $895 | $2.56 | 43d | 1 | 0.39mi |
| 1023 S State Ave Indianapolis, IN | 1.0 | 1.0 | 600 | $1,099 | $1.83 | 23d | 1 | 0.51mi |
| 815 Dawson St Unit 2 Indianapolis, IN | 2.0 | 1.0 | 600 | $1,300 | $2.17 | 4d | 1 | 0.60mi |
| 1912 Lexington Ave Unit 1910B Indianapolis, IN | 1.0 | 1.0 | 660 | $850 | $1.29 | 43d | 1 | 0.61mi |
| 1441 Prospect St Indianapolis, IN | 2.0 | 1.0–2.0 | 2840 | $2,000 | $0.70 | 1d | 13 | 0.62mi |
| 1224 Prospect St Indianapolis, IN | 2.0 | 1.0–2.0 | 691 | $2,235 | $3.23 | 1d | 8 | 0.78mi |
| 1306 Woodlawn Ave Unit 1B Indianapolis, IN | 1.0 | 1.0 | 720 | $1,275 | $1.77 | 43d | 1 | 0.78mi |
| 1306 Woodlawn Ave Unit 1D Indianapolis, IN | 1.0 | 1.0 | 391 | $1,025 | $2.62 | 43d | 1 | 0.78mi |
| 1558 Shelby St Indianapolis, IN | 1.0 | 1.0 | 500 | $1,000 | $2.00 | 43d | 1 | 0.86mi |
| 1556 Shelby St Indianapolis, IN | 2.0 | 1.0 | 500 | $1,000 | $2.00 | 43d | 1 | 0.86mi |
| 423 Villa Ave Indianapolis, IN | 1.0 | 1.0 | 593 | $799 | $1.35 | 23d | 1 | 0.86mi |
| 1044 Shelby St Unit 205 CDBG 80% Indianapolis, IN | 1.0 | 1.0 | 579 | $650 | $1.12 | 17d | 1 | 0.91mi |
| 1604 E Kelly St Indianapolis, IN | 2.0 | 1.0 | 750 | $1,025 | $1.37 | 17d | 1 | 0.93mi |
| 1409 E Tabor St Indianapolis, IN | 1.0 | 1.0 | 528 | $775 | $1.47 | 23d | 1 | 0.99mi |
| 2025 Southeastern Ave Indianapolis, IN | 1.0 | 1.0 | 663 | $775 | $1.17 | 43d | 1 | 1.00mi |
| 247 S Randolph St Indianapolis, IN | 2.0 | 1.0 | 720 | $750 | $1.04 | 43d | 1 | 1.00mi |
| 245 S Randolph St Indianapolis, IN | 2.0 | 1.0 | 720 | $750 | $1.04 | 43d | 1 | 1.01mi |
| 3022 English Ave Unit 3022 Indianapolis, IN | 2.0 | 1.0 | 600 | $650 | $1.08 | 43d | 1 | 1.02mi |
| 2034 Southeastern Ave Indianapolis, IN | 1.0 | 1.0 | 525 | $850 | $1.62 | 14d | 1 | 1.03mi |
| 2469 Dawson St Indianapolis, IN | 2.0 | 1.0 | 700 | $949 | $1.36 | 3d | 4 | 1.08mi |
| 1718 Southeastern Ave Indianapolis, IN | 1.0 | 1.0 | 700 | $1,080 | $1.54 | 43d | 1 | 1.14mi |
| 1861 Orleans St Indianapolis, IN | 1.0 | 1.0 | 552 | $2,500 | $4.53 | 23d | 1 | 1.28mi |
| 2142 S Garfield Dr Unit 2142 Indianapolis, IN | 1.0 | 1.0 | 500 | $650 | $1.30 | 43d | 1 | 1.29mi |
| 270 S Lasalle St Indianapolis, IN | 3.0 | 2.0 | 562 | $1,329 | $2.36 | 7d | 1 | 1.32mi |
| 49 S Rural St Indianapolis, IN | 2.0 | 1.5 | 750 | $950 | $1.27 | 10d | 1 | 1.37mi |
| 2525 Shelby St Unit 1 Indianapolis, IN | 1.0 | 1.0 | 600 | $865 | $1.44 | 2d | 1 | 1.40mi |
| 2525 Shelby St Unit 4 Indianapolis, IN | 1.0 | 1.0 | 600 | $775 | $1.29 | 23d | 1 | 1.40mi |
| 1436 S New Jersey St Unit B Indianapolis, IN | 2.0 | 2.0 | 650 | $1,700 | $2.62 | 7d | 1 | 1.43mi |
| 1436 S New Jersey St Unit C Indianapolis, IN | 2.0 | 2.0 | 600 | $1,600 | $2.67 | 43d | 1 | 1.43mi |
| 520 Virginia Ave Apt 24 Indianapolis, IN | 1.0 | 1.0 | 665 | $1,575 | $2.37 | 23d | 1 | 1.45mi |
| 2555 Shelby St Unit 2559 Indianapolis, IN | 1.0 | 1.0 | 717 | $1,250 | $1.74 | 43d | 1 | 1.46mi |
| 531 Virginia Ave Indianapolis, IN | 1.0 | 1.0 | 642 | $1,384 | $2.16 | 7d | 4 | 1.46mi |
| 355 E Morris St Indianapolis, IN | 2.0 | 1.0 | 648 | $1,800 | $2.78 | 23d | 1 | 1.50mi |
Listing history 22 events
-
2026-06-17pricedays on market $180,000 Active 1 DOM
-
2026-06-09days on market $185,000 Active 12 DOM
-
2026-06-08days on market $185,000 Active 11 DOM
-
2026-06-07statusdays on market $185,000 Active 10 DOM
-
2026-05-22status Pending
-
2026-05-21price $185,000
-
2026-05-16$225,000 Active
-
2021-04-19historical
-
2021-04-18status Pending
-
2021-03-30historical
-
2021-02-09status Pending
-
2021-01-17price $99,000
-
2021-01-11$104,900 Active
-
2020-04-06soldstatus $59,500 Sold 60-char remark
Show marketing remark (60 chars)
Value add opportunity for a duplex in an up and coming area.
-
2020-01-30status Pending 60-char remark
Show marketing remark (60 chars)
Value add opportunity for a duplex in an up and coming area.
-
2019-12-06$62,000 Active 60-char remark
Show marketing remark (60 chars)
Value add opportunity for a duplex in an up and coming area.
-
2017-07-14soldstatus $31,000 Sold
-
2017-06-27status Pending
-
2017-06-22historical Active with Contingency
-
2017-06-20status Active
-
2017-06-15historical
-
2017-06-15$34,900 Active
ⓘ Source: listings_history table (triggers on properties + properties_extension) + one-shot
backfill from property_details.listing_events for pre-trigger history.
Tax reassessment forecast IN · Partial reset (capped growth)
- Current annual tax
- $2,651 · $221/mo
- Projected year-2 tax
- $2,651 · $221/mo
- Expected delta
- $0/yr ($0/mo · 0.0%)
ⓘ Screening estimate from a state-policy table — verify with the county assessor before closing.
Climate risk First Street
- Flood 1/10 Low FEMA zone X (shaded) · 0% chance over 30 yrs
- Wildfire 1/10 Low
- Heat 3/10 Moderate 7 d/yr ≥101°F today · 19 d/yr by 30 yrs out
- Wind 2/10 Low 100% chance of damaging wind over 30 yrs
- Air quality 3/10 Moderate 2 unhealthy d/yr today · 3 by 30 yrs out
Nearby sold comps map
Loading sold comps map…
Walkable amenities ~0.75 mi
Loading nearby amenities…
Taxation est. · year 1
- Rental income
- $31,044
- − Mortgage interest
- −$10,083
- − Property taxes
- −$2,651
- − Insurance
- −$900
- − Repairs & maintenance
- −$2,484
- − Management
- −$2,484
- − Depreciation
- −$5,236
- Taxable income
- $7,207
- Est. tax owed @ 24.0%
- −$1,730
- After-tax cash flow
- $7,917/yr
For passive investors: Depreciation is non-cash, so a rental often shows a tax loss while cash-flowing — sheltering income. Rental losses are passive: they offset passive income freely, and up to $25,000/yr can offset ordinary (W-2) income if you actively participate and your MAGI is under $100k (phasing out to $0 by $150k); unused losses carry forward. On sale, claimed depreciation is recaptured at up to 25%, and gains may owe capital-gains tax (a 1031 exchange can defer both). Figures are a year-1 estimate at your 24.0% rate — not tax advice; consult a CPA.
Schools (NCES district)
- District
- Indianapolis Public Schools
- NCES district ID
- 1804770
- Math proficiency
- 14% ▼ -7.00%
- Reading proficiency
- 20% ▼ -3.00%
- Median HH income
- $32,034
- Composite
- 13.69/100
- National rank
- #9499
- State rank
- #286 of 301 in IN
Livability — Indianapolis city (balance)
No livability data for this city. (Only ~50 U.S. cities are tracked.)
Census & demographics
- Census place
- Indianapolis city (balance), IN
- County
- Marion County · 998,460 people
- City population
- 881,119
- Metro
- Indianapolis-Carmel-Anderson, IN
- Population (ZIP)
- 37,758
- Household income
- $57,393
- Rent vs Own
- Severe rent burden
- 1499.0
Population outlook (Marion County) Hauer SSP2
- Today (2025)
- 1,025,572 people
- By 2030
- 1,065,727 · +3.9%
- By 2040
- 1,141,577 · +11.3%
- By 2050
- 1,208,920 · +17.9%
- By 2075
- 1,367,288 · +33.3%
- By 2100
- 1,438,201 · +40.2%
Race, ethnicity, and origin ACS 2023
- Neighborhood character
- Predominantly White (69%)
- Race & ethnicity
- White 69% Hispanic / Latino 14% Black 12% Two or more races 8% Asian 2% Native American 1%
- Hispanic origin (detail)
- Mexican 12% Puerto Rican 1%
- Common ancestry
- Slovak 2% Lithuanian 2% Italian 1%
- Foreign-born
- 8% · Canada
- Languages at home
- 88% English-only · Spanish 10% Other Indo-European 1%
Political lean MEDSL · Marion
- 2024 margin
- Strong D (+27.7) · D 63.0% · R 35.3% · Other 1.7%
- 2008→2024 swing
- -0.7pp no change · 2008: 28.4pp · 2024: 27.7pp
- All cycles
- 2024: D+27.7 2020: D+29.1 2016: D+22.8 2012: D+22.2 2008: D+28.4
Not yet ingested
- Civics
- —
Market trends
- HPI YoY
- ▼ -127.37%
- Current HPI
- 349.579
- Rent YoY
- ▲ 2.88%
- Metro
- Indianapolis-Carmel-Anderson, IN
- State GDP YoY
- ▲ 2.90%
- F500 in state
- 18
Industry mix (Fortune 500 HQ in IN)
| Industry | F500 HQs | Revenue |
|---|---|---|
| Industrial Machinery | 2 | $37B |
|
||
| Healthcare | 1 | $177B |
|
||
| Pharmaceuticals | 1 | $45B |
|
||
| Metals / Steel | 1 | $18B |
|
||
| Agriculture | 1 | $17B |
|
||
| Packaging | 1 | $12B |
|
||
Price history
+430.1% since first listed18 events — show timeline
- 2026-05-22 Pending — MIBOR as Distributed by MLS Grid
- 2026-05-21 Price Changed $185,000 MIBOR as Distributed by MLS Grid
- 2026-05-16 Listed $225,000 MIBOR as Distributed by MLS Grid
- 2021-04-19 Listing Removed — MIBOR as Distributed by MLS Grid
- 2021-04-18 Pending — MIBOR as Distributed by MLS Grid
- 2021-03-30 Listing Removed — MIBOR as Distributed by MLS Grid
- 2021-02-09 Pending — MIBOR as Distributed by MLS Grid
- 2021-01-17 Price Changed $99,000 MIBOR as Distributed by MLS Grid
- 2021-01-11 Listed $104,900 MIBOR as Distributed by MLS Grid
- 2020-04-06 Sold (MLS) $59,500 MIBOR as Distributed by MLS Grid
- 2020-01-30 Pending — MIBOR as Distributed by MLS Grid
- 2019-12-06 Listed $62,000 MIBOR as Distributed by MLS Grid
- 2017-07-14 Sold (MLS) $31,000 MIBOR as Distributed by MLS Grid
- 2017-06-27 Pending — MIBOR as Distributed by MLS Grid
- 2017-06-22 Contingent — MIBOR as Distributed by MLS Grid
- 2017-06-20 Relisted — MIBOR as Distributed by MLS Grid
- 2017-06-15 Listing Removed — MIBOR as Distributed by MLS Grid
- 2017-06-15 Listed $34,900 MIBOR as Distributed by MLS Grid
Property tax history
+19.8%/yrLatest (2025): $2,651 · -9.9% YoY. Source: county tax records.
Cash-flow waterfall
monthlySold comps — $/sqft
last 12 mo · ≤1 miLoading sold comps…