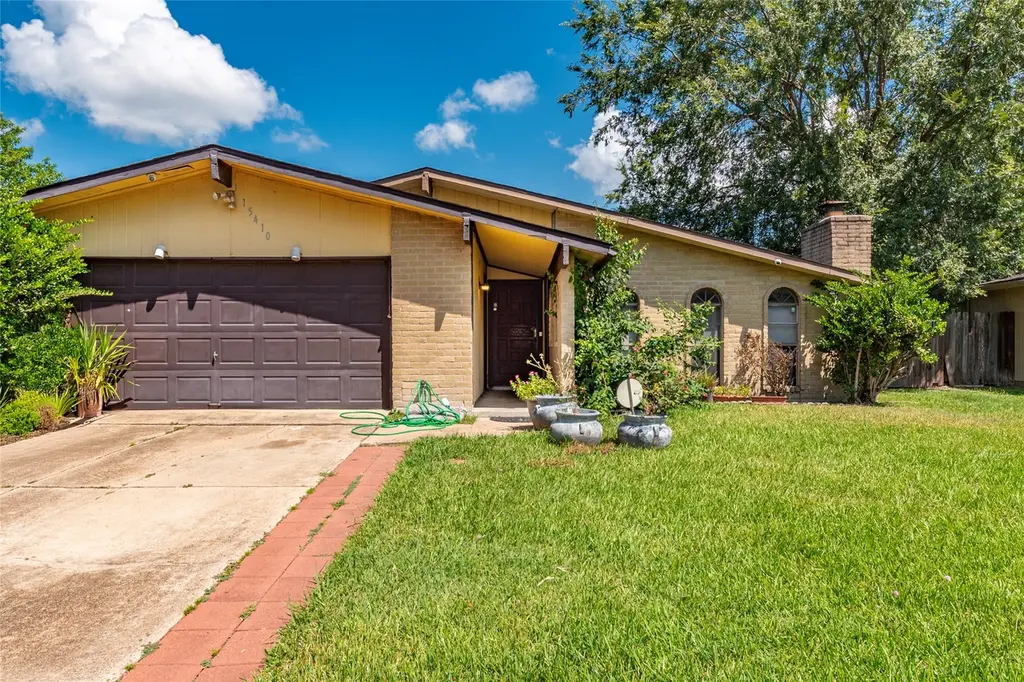
15410 Empanada Dr · Mission Bend, TX
Flood risk 1/10 · Minimal
- FEMA flood zone
- X (unshaded)
- Chance of flooding over 30 yrs
- 0.0%
- Est. flood insurance / yr
- $507 – $1,088
Fire risk 1/10 · Minimal
- Est. fire insurance / yr
- $1,222 – $2,270
Heat risk 9/10 · Severe
- Hot days now (above 110°F)
- 7 days/yr
- Hot days in 30 yrs
- 23 days/yr
Wind risk 9/10 · Severe
- Chance of severe wind over 30 yrs
- 99.0%
Air-quality risk 2/10 · Minimal
- Unhealthy air days now
- 1 days/yr
- Unhealthy air days in 30 yrs
- 2 days/yr
Risk factors via First Street. Map © Google.
Why this score? — see what drove the D+ grade
The composite is a weighted blend of 9 inputs, each scored 0–100. Each bar is that input's sub-score; the figure is the points it added to the 100-point composite (weight × sub-score).
- ARV discount +15.0/15.0
- Cash flow +14.2/30.0
- 1% rule +5.1/10.0
- DSCR +4.3/10.0
- Livability +3.2/5.0
- Rent growth +3.0/5.0
- Condition / age +2.5/5.0
- Schools +2.1/10.0
- Appreciation +0.0/10.0
$200,000
🖨 Deal sheet 📄 Offer letter ✓ Due diligence
Listing remarks MLS
Welcome to 15410 Empanada Dr Houston,TX !
Key facts
- 8,398 sq ft lot
- Built 1977
- Listed 17 days
Neighborhood map
What this means for you Summary
Snapshot
- This is a 3-bed/1.0-bath single-family listed at $200k.
Deal economics
- At list price, monthly cash flow is $35 ($416/yr) — positive.
- The deal already cash-flows at list — no discount required.
- Meets the 1% rule at list price ($2k rent vs $200k).
- Recommended offer: $197k (1.5% below list) — sets the bar for market timing.
- Cap rate 6.5% vs local median 4.2% in Mission Bend — top-decile yield for the area; either an underpriced asset or a hidden risk that comps aren't pricing in. Stress-test before assuming the spread holds.
Location & tenants
- Location reads 65/100 on livability (#715 in TX) — a middle-class / working-renter tenant base. Strengths: cost of living A+, housing A+; Watch: schools D, crime D-, amenities F.
- Alief ISD (urban): math 23% / reading 28% proficiency, ranked #717 of 826 in TX (top 87%) — low school quality limits family demand, transient renter base, plan for 1-2y turnover; 74% free/reduced lunch — lower-income household profile, screen leases tightly.
- Market conditions: Rents rising (+1.9%/yr); 262 active listings in the ZIP; 15 comparable units currently listed for rent nearby; rentals lingering (median 44d on market — plan ~5-8 weeks vacancy on turnover, expect pricing pressure); 53% of comp listings sitting > 30 days — soft ceiling on asking rent; 29,883 units permitted in Harris County in 2024 (8,621 in 5+ unit buildings).
- This rent runs 38% of the median local income ($64k/yr) — at the standard rent-burdened threshold; future hikes will face affordability resistance.
Forward outlook
- Local home prices are declining (-3.0%/yr); year-one equity from $1k of loan paydown is wiped out by about $6k of value loss. Plan a longer hold.
- Harris County population projected at +47% by 2050 — long-run rental-demand tailwind backs the buy-and-hold thesis.
Negotiation context
- It's been on market 17 days — a 2% lower offer ($197k) is reasonable based on typical stale-listing flexibility.
- 6 sale attempts since 23y ago with the ask held roughly flat each time — persistent listings suggest the price (not the market) is what's stuck; bring a comps-based counter.
- Current owner paid $55k; list at $200k implies a 264% gain — meaningful room to come down on a strong offer.
Risks & watch-outs
- Climate carrying-cost: severe wind risk, 99% chance of damaging wind over 30y; extreme-heat days projected 7→23/yr by 2055 (HVAC capex compounding) — expect insurance premiums to compound above CPI over the hold.
Questions for the listing agent
- Built in 1977 — when were the roof, HVAC, electrical panel, plumbing, and water heater last replaced?
- What does the HOA fee cover, when was the last increase, and are there any pending special assessments or reserve-fund shortfalls?
- Is there a deadline driving the sale (1031 exchange, divorce, estate, relocation)? That informs how much negotiation room exists.
- Schools are D-rated, which usually means shorter tenancies and higher turnover. Who's the typical renter profile here, and what's been the actual vacancy rate?
- Crime grade is D in this area — have there been break-ins, vandalism, or insurance claims at this property in the last 3 years? What carrier currently insures it and at what premium?
- The area grade is low — what's the realistic commute time and amenity access for the typical tenant pool here? Any planned neighborhood developments (good or bad) we should know about?
- What's the average days-on-market for RENTAL listings here right now (not sales)? A rising rental-DOM trend means longer vacancies and softer asking-rent achievability than the comps imply.
- What's the recent tenant-quality profile in this submarket — average credit score on applications, eviction rate, late-payment / NSF rate, and stable-employment percentage? A property-management company in the area should have these aggregated.
- How much new for-sale + rental construction is in the pipeline within 1–3 miles? Heavy new supply typically softens prices + rents 12–24 months out; constrained supply supports both.
Investment metrics
- 1% rule
- 1.01% ✓
- Cap rate
- 6.50%
- Cash-on-cash
- 0.74%
- DSCR
- 1.03
- GRM
- 8.2
CMA / ARV
- ARV (median comp)
- $247,011
- List price
- $200,000
- Delta
- -19.03%
- Verdict
- UNDERPRICED
- Comps
- 20 within 1.0 mi
Show comp detail 12 sales within ~0.75 mi
| Address | Dist | Beds/Ba | Sqft | Sold | Price | $/sf | Match |
|---|---|---|---|---|---|---|---|
| 15410 Empanada Dr | 0.00mi | 4/2.0 (+1) | 2,083 (0%) | 1mo | $200,000 | $96 | 90 |
| 15414 Empanada Dr | 0.01mi | 4/2.5 (+1) | 2,228 (+7%) | 1mo | $319,000 | $143 | 76 |
| 15427 Rio Plaza Dr | 0.34mi | 3/2.0 | 1,992 (-4%) | 1mo | $225,000 | $113 | 72 |
| 15519 Montesa Dr | 0.52mi | 4/2.0 (+1) | 2,017 (-3%) | 1mo | $289,000 | $143 | 60 |
| 15818 Beechnut St | 0.68mi | 3/2.0 | 2,040 (-2%) | 1mo | $270,000 | $132 | 60 |
| 15119 Mira Vista Dr | 0.27mi | 4/2.5 (+1) | 2,302 (+10%) | 0mo | $225,000 | $98 | 58 |
| 7107 Mission Bay Dr | 0.08mi | 4/3.0 (+1) | 2,383 (+14%) | 1mo | $335,000 | $141 | 58 |
| 15319 La Paloma Dr | 0.43mi | 4/2.0 (+1) | 2,223 (+7%) | 2mo | $299,900 | $135 | 58 |
| 14938 Mesita Dr | 0.51mi | 3/2.5 | 2,253 (+8%) | 2mo | $289,999 | $129 | 55 |
| 8118 Vista Del Sol Dr | 0.66mi | 3/2.0 | 1,868 (-10%) | 1mo | $269,000 | $144 | 47 |
| 15211 Paladora Dr | 0.73mi | 4/2.0 (+1) | 2,380 (+14%) | 2mo | $271,999 | $114 | 32 |
| 15214 El Padre Dr | 0.71mi | 4/2.5 (+1) | 2,381 (+14%) | 1mo | $315,000 | $132 | 31 |
Match score weights: distance 35% · size 25% · config 20% · recency 20%. Top-matched comps best support the ARV.
Projected returns pro-forma
-3.0% appreciation · 1.89% rent growth · sell at horizon
- IRR
- -16.4%
- Equity multiple
- 0.42×
- Total profit
- $-32,293
- Equity at exit
- $29,821
- IRR
- -10.4%
- Equity multiple
- 0.40×
- Total profit
- $-33,668
- Equity at exit
- $17,292
Cash invested: $56,000 (down + closing). Projections, not guarantees.
Landlord ↔ Tenant lean methodology
- Overall (STATE)
- 87 Strongly Landlord-Friendly
- State Texas
- 87 Strongly Landlord-Friendly · R+5
- County
- — inherits STATE
- City
- — inherits STATE
ZIP-level market 77083
- Home prices YoY
- -19.3%
- Rents YoY
- 1.9%
- Active inventory
- 262
- Price-to-rent
- 8.2×
Monthly cashflow live
- Estimated rent
- $2,024 high interval (Pro) →
- Mortgage (P&I)
- −$1,049
- Tax from tax record
- −$410 /mo · $4,924/yr
- Insurance
- −$83
- HOA
- −$22
- Vacancy / Maint / Mgmt
- −$425
- Net cashflow
- $35
Break-even live
UW: 25.0% down · 7.5% · 30yr · 1.5% tax · 5.0% vac · 8.0% maint · 8.0% mgmt
Financing live
Cash to close
- Down payment
- $50,000
- Closing costs
- $6,000
- Reserves months
- —
- Total cash needed
- —
Loan-product check · same deal, 3 products live
Conventional
25% down · 7.5% · 30yr
- Down + closing
- —
- Monthly P&I
- —
- Monthly cashflow
- —
- DSCR
- —
- Eligible?
- —
Personal DTI + credit; lowest rate.
DSCR
20% down · 8.5% · 30yr
- Down + closing
- —
- Monthly P&I
- —
- Monthly cashflow
- —
- DSCR
- —
- Eligible?
- —
No personal income docs; deal must DSCR.
Hard money
10% down · 12.0% · 12mo
- Down + closing
- —
- Monthly P&I
- —
- Monthly cashflow
- —
- DSCR
- —
- Eligible?
- —
Short-term bridge; refi at stabilization.
Rent comps 15 comps
| Address | Beds | Baths | Sqft | Rent | $/sqft | DOM | Units | Dist |
|---|---|---|---|---|---|---|---|---|
| 7214 Addicks Clodine Rd Houston, TX | 4.0 | 2.0 | 1969 | $1,900 | $0.96 | 5d | 1 | 0.48mi |
| 6514 Winkleman Rd Houston, TX | 3.0 | 2.0 | 2225 | $2,095 | $0.94 | 12d | 1 | 0.65mi |
| 15511 Evergreen Grove Dr Houston, TX | 3.0 | 2.0 | 1634 | $1,786 | $1.09 | 5d | 1 | 0.77mi |
| 7431 Navidad Rd Houston, TX | 3.0 | 2.0 | 1904 | $1,621 | $0.85 | 43d | 1 | 0.82mi |
| 15306 Evergreen Place Dr Houston, TX | 3.0 | 2.0 | 1726 | $1,730 | $1.00 | 24d | 1 | 1.06mi |
| 16311 Paso Hondo Dr Houston, TX | 3.0 | 2.5 | 1449 | $1,723 | $1.19 | 43d | 1 | 1.11mi |
| 7010 Santa Rita Dr Houston, TX | 4.0 | 3.0 | 2410 | $2,200 | $0.91 | 43d | 1 | 1.12mi |
| 15406 Lynford Crest Dr Houston, TX | 4.0 | 2.5 | 2740 | $2,200 | $0.80 | 4d | 1 | 1.22mi |
| 16243 April Ridge Dr Houston, TX | 4.0 | 2.0 | 2189 | $2,295 | $1.05 | 43d | 1 | 1.23mi |
| 16131 April Ridge Dr Houston, TX | 3.0 | 2.0 | 1782 | $2,000 | $1.12 | 43d | 1 | 1.27mi |
| 15706 Tammany Ln Houston, TX | 3.0 | 2.0 | 1420 | $1,816 | $1.28 | 12d | 1 | 1.39mi |
| 7211 Crescent Mills Dr Houston, TX | 4.0 | 2.0 | 1878 | $8,850 | $4.71 | 43d | 1 | 1.41mi |
| 7211 Crescent Mills Dr Unit 1521536P Houston, TX | 4.0 | 2.0 | 1872 | $6,487 | $3.47 | 43d | 1 | 1.41mi |
| 7207 Crescent Mills Dr Houston, TX | 4.0 | 2.0 | 1750 | $8,850 | $5.06 | 43d | 1 | 1.42mi |
| 16717 Westpark Dr Houston, TX | 1.0–3.0 | 1.0–2.0 | 1042 | $2,335 | $2.24 | 2d | 38 | 1.49mi |
HOA detail
- Monthly dues
- $22 · $264/yr
Listing history 16 events
-
2026-05-06status Pending 41-char remark
Show marketing remark (41 chars)
Welcome to 15410 Empanada Dr Houston,TX !
-
2026-04-28status Active 41-char remark
Show marketing remark (41 chars)
Welcome to 15410 Empanada Dr Houston,TX !
-
2026-04-25status Pending 41-char remark
Show marketing remark (41 chars)
Welcome to 15410 Empanada Dr Houston,TX !
-
2026-04-25historical 41-char remark
Show marketing remark (41 chars)
Welcome to 15410 Empanada Dr Houston,TX !
-
2026-04-23status Pending 41-char remark
Show marketing remark (41 chars)
Welcome to 15410 Empanada Dr Houston,TX !
-
2026-04-14$200,000 Active 41-char remark
Show marketing remark (41 chars)
Welcome to 15410 Empanada Dr Houston,TX !
-
2026-04-14historical
Show marketing remark (41 chars)
Welcome to 15410 Empanada Dr Houston,TX !
-
2026-01-25$230,000 Active
-
2026-01-25historical
-
2025-08-18$260,000 Active
-
2006-06-13soldstatus
-
2005-11-29historical
-
2004-03-08$105,000
-
2003-10-26historical
-
2003-05-20$104,900
-
1989-10-23soldstatus $55,000
ⓘ Source: listings_history table (triggers on properties + properties_extension) + one-shot
backfill from property_details.listing_events for pre-trigger history.
Tax reassessment forecast TX · Resets to sale price
- Current annual tax
- $4,924 · $410/mo
- Projected year-2 tax
- $4,924 · $410/mo
- Expected delta
- $0/yr ($0/mo · 0.0%)
ⓘ Screening estimate from a state-policy table — verify with the county assessor before closing.
Climate risk First Street
- Flood 1/10 Low FEMA zone X (unshaded) · 0% chance over 30 yrs
- Wildfire 1/10 Low
- Heat 9/10 Extreme 7 d/yr ≥110°F today · 23 d/yr by 30 yrs out
- Wind 9/10 Extreme 99% chance of damaging wind over 30 yrs
- Air quality 2/10 Low 1 unhealthy d/yr today · 2 by 30 yrs out
Nearby sold comps map
Loading sold comps map…
Walkable amenities ~0.75 mi
Loading nearby amenities…
Taxation est. · year 1
- Rental income
- $24,291
- − Mortgage interest
- −$11,203
- − Property taxes
- −$4,924
- − Insurance
- −$1,000
- − Repairs & maintenance
- −$1,943
- − Management
- −$1,943
- − HOA
- −$264
- − Depreciation
- −$5,818
- Taxable loss
- −$2,805
- Est. tax savings @ 24.0%
- +$673
- After-tax cash flow
- $1,089/yr
For passive investors: Depreciation is non-cash, so a rental often shows a tax loss while cash-flowing — sheltering income. Rental losses are passive: they offset passive income freely, and up to $25,000/yr can offset ordinary (W-2) income if you actively participate and your MAGI is under $100k (phasing out to $0 by $150k); unused losses carry forward. On sale, claimed depreciation is recaptured at up to 25%, and gains may owe capital-gains tax (a 1031 exchange can defer both). Figures are a year-1 estimate at your 24.0% rate — not tax advice; consult a CPA.
Schools (NCES district)
- District
- Alief ISD
- NCES district ID
- 4807830
- Math proficiency
- 23% ▼ -19.00%
- Reading proficiency
- 28% ▼ -8.00%
- Median HH income
- $37,775
- Composite
- 21.29/100
- National rank
- #8391
- State rank
- #717 of 826 in TX
Livability — Mission Bend
- Score
- 65/100
- State rank
- #715
- US rank
- #13356
Category grades
Schools grade is shown separately in the Schools card above.
Census & demographics
- Census place
- Mission Bend, TX
- County
- Harris County · 4,702,590 people
- City population
- 74,843
- Metro
- Houston-The Woodlands-Sugar Land, TX
- Population (ZIP)
- 73,230
- Household income
- $64,418
- Rent vs Own
- Severe rent burden
- 2410.0
Population outlook (Harris County) Hauer SSP2
- Today (2025)
- 5,571,493 people
- By 2030
- 6,089,821 · +9.3%
- By 2040
- 7,142,806 · +28.2%
- By 2050
- 8,185,864 · +46.9%
- By 2075
- 10,574,329 · +89.8%
- By 2100
- 12,109,958 · +117.4%
Race, ethnicity, and origin ACS 2023
- Neighborhood character
- Highly diverse neighborhood (Simpson 0.72)
- Race & ethnicity
- Hispanic / Latino 35% Black 30% Asian 23% Two or more races 14% White 8%
- Hispanic origin (detail)
- Mexican 16% Puerto Rican 1% Cuban 1%
- Foreign-born
- 47% · Canada, Vietnam, China
- Languages at home
- 38% English-only · Spanish 29% Vietnamese 11% Other Indo-European 6%
Political lean MEDSL · Harris
- 2024 margin
- Lean D (+5.5) · D 52.0% · R 46.4% · Other 1.6%
- 2008→2024 swing
- +3.9pp toward D · 2008: 1.6pp · 2024: 5.5pp
- All cycles
- 2024: D+5.5 2020: D+13.3 2016: D+12.4 2012: D+0.1 2008: D+1.6
Not yet ingested
- Civics
- —
Market trends
- HPI YoY
- ▼ -65.00%
- Current HPI
- 271.2157
- Rent YoY
- ▲ 1.89%
- Metro
- Houston-The Woodlands-Sugar Land, TX
- State GDP YoY
- ▲ 3.95%
- F500 in state
- 110
Industry mix (Fortune 500 HQ in TX)
| Industry | F500 HQs | Revenue |
|---|---|---|
| Energy | 16 | $1,198B |
|
||
| Technology | 5 | $198B |
|
||
| Engineering / Construction | 4 | $72B |
|
||
| Energy Services | 3 | $60B |
|
||
| Utilities | 3 | $41B |
|
||
| Healthcare | 2 | $330B |
|
||
Price history
+263.6% since first listed16 events — show timeline
- 2026-05-06 Pending — HARMLS
- 2026-04-28 Relisted — HARMLS
- 2026-04-25 Pending — HARMLS
- 2026-04-25 Listing Removed — HARMLS
- 2026-04-23 Pending — HARMLS
- 2026-04-14 Listing Removed — HARMLS
- 2026-04-14 Listed $200,000 HARMLS
- 2026-01-25 Listing Removed — HARMLS
- 2026-01-25 Listed $230,000 HARMLS
- 2025-08-18 Listed $260,000 HARMLS
- 2006-06-13 Sold (Public Records) — Public Records
- 2005-11-29 Listing Removed — HARMLS
- 2004-03-08 Listed $105,000 HARMLS
- 2003-10-26 Listing Removed — HARMLS
- 2003-05-20 Listed $104,900 HARMLS
- 1989-10-23 Sold (Public Records) $55,000 Public Records
Property tax history
+7.6%/yrLatest (2025): $4,924 · -5.7% YoY. Source: county tax records.
Cash-flow waterfall
monthlySold comps — $/sqft
last 12 mo · ≤1 miLoading sold comps…