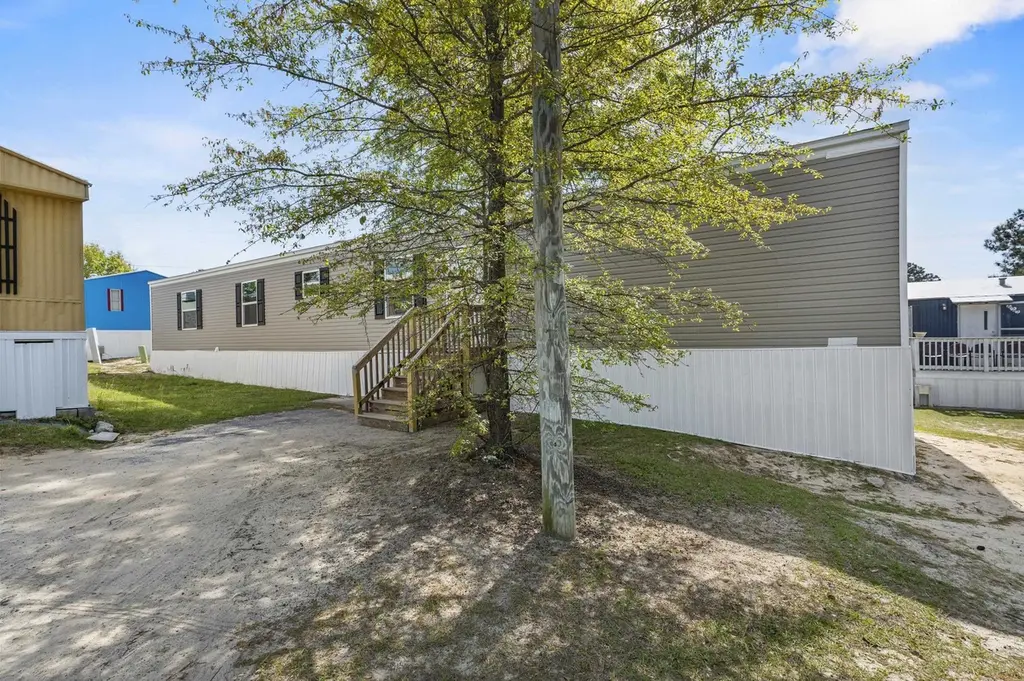
600 Lot 620 Ermine Rd · Springdale, SC
Flood risk 1/10 · Minimal
- FEMA flood zone
- X (unshaded)
- Chance of flooding over 30 yrs
- 0.0%
- Est. flood insurance / yr
- $507 – $1,088
Fire risk 3/10 · Minor
- Est. fire insurance / yr
- $783 – $1,453
Heat risk 7/10 · Major
- Hot days now (above 108°F)
- 7 days/yr
- Hot days in 30 yrs
- 16 days/yr
Wind risk 6/10 · Moderate
- Chance of severe wind over 30 yrs
- 63.0%
Air-quality risk 3/10 · Minor
- Unhealthy air days now
- 2 days/yr
- Unhealthy air days in 30 yrs
- 2 days/yr
Risk factors via First Street. Map © Google.
Why this score? — see what drove the B grade
The composite is a weighted blend of 9 inputs, each scored 0–100. Each bar is that input's sub-score; the figure is the points it added to the 100-point composite (weight × sub-score).
- Cash flow +30.0/30.0
- 1% rule +10.0/10.0
- DSCR +10.0/10.0
- ARV discount +7.5/15.0
- Condition / age +4.0/5.0
- Rent growth +3.6/5.0
- Livability +3.2/5.0
- Schools +2.9/10.0
- Appreciation +0.0/10.0
$84,000
🖨 Deal sheet 📄 Offer letter ✓ Due diligence
Listing remarks
Just hit the market in the highly desirable Lexington Village community! This brand-new 2026 Clayton Sensation home offers 4 bedrooms, 2 full baths, plus a versatile flex room that can easily serve as a 4th bedroom, office, or guest space. With approximately 1,216 sq ft of thoughtfully designed living space, this home combines comfort, style, and affordability in a prime location just minutes from downtown Columbia and Lexington. Inside, you’ll find an open-concept layout with high ceilings, abundant natural light, durable vinyl plank flooring throughout, and a spacious kitchen featuring brand-new appliances, wood-tone cabinetry, and generous counter space. The oversized laundry room
Key facts
- Spacious kitchen
- Flex room
- Brand-new appliances
Tags
Property features AI
Finance
- Financial info: Land lease of $495 per month; Offered for sale
- HOA & community: Association fee due monthly
Exterior
- Parking: Driveway with space for 5 vehicles
- Home design: Resale property
- Exterior features: Approximately 0.25-acre lot (estimated); Zoned residential
Interior
- Bathrooms: Two full bathrooms
- Interior features: Unfurnished
Neighborhood map
What this means for you Summary
Snapshot
- This is a 4-bed/2.0-bath condo listed at $84k. Condition is rated good.
Deal economics
- At list price, monthly cash flow is $1k ($12k/yr) — positive.
- The deal already cash-flows at list — no discount required.
- Meets the 1% rule at list price ($2k rent vs $84k).
- Recommended offer: $83k (1.5% below list) — sets the bar for market timing.
- Cap rate 20.8% vs local median 3.9% in Springdale — top-decile yield for the area; either an underpriced asset or a hidden risk that comps aren't pricing in. Stress-test before assuming the spread holds.
Location & tenants
- Location reads 63/100 on livability (#170 in SC) — a middle-class / working-renter tenant base. Strengths: cost of living A+, health & safety A+; Watch: housing D+, crime F, amenities F.
- Lexington 02 (suburban): math 30% / reading 38% proficiency, ranked #45 of 80 in SC (top 56%) — families likely to look elsewhere, expect single-tenant / working-renter base with shorter leases.
- Market conditions: Rents rising fast (+4.6%/yr); 187 active listings in the ZIP; 2 comparable units currently listed for rent nearby; 1,712 units permitted in Lexington County in 2024 (0 in 5+ unit buildings).
- This rent runs 32% of the median local income ($75k/yr) — at the standard rent-burdened threshold; future hikes will face affordability resistance.
Forward outlook
- Local home prices are declining (-3.0%/yr); year-one equity from $581 of loan paydown is wiped out by about $3k of value loss. Plan a longer hold.
- Lexington County population projected at +26% by 2050 — long-run rental-demand tailwind backs the buy-and-hold thesis.
- At projected returns (-3.0% appreciation + 4.6% rent growth), your $24k cash investment doubles in ~3 years — after that, you're playing with house money.
Negotiation context
- It's been on market 24 days — a 2% lower offer ($83k) is reasonable based on typical stale-listing flexibility.
- 10 sale attempts; this cycle's ask has dropped $15k (15%) from the opening price — seller is motivated, your offer sets the floor, not the list.
Risks & watch-outs
- Climate carrying-cost: major wind risk, 63% chance of damaging wind over 30y; extreme-heat days projected 7→16/yr by 2055 (HVAC capex compounding) — expect insurance premiums to compound above CPI over the hold.
Questions for the listing agent
- Any open or pending special assessments — roof, HVAC, plumbing, elevator, façade? What's the per-unit balance and payoff schedule, and is the seller paying it off at close or rolling it to the buyer?
- Is there a deadline driving the sale (1031 exchange, divorce, estate, relocation)? That informs how much negotiation room exists.
- Crime grade is F in this area — have there been break-ins, vandalism, or insurance claims at this property in the last 3 years? What carrier currently insures it and at what premium?
- What's the average days-on-market for RENTAL listings here right now (not sales)? A rising rental-DOM trend means longer vacancies and softer asking-rent achievability than the comps imply.
- What's the recent tenant-quality profile in this submarket — average credit score on applications, eviction rate, late-payment / NSF rate, and stable-employment percentage? A property-management company in the area should have these aggregated.
- How much new apartment / multifamily construction is in the pipeline within 1–3 miles? Heavy new supply (>2% of stock underway) typically softens rents 12–24 months out; light construction supports rent growth.
Investment metrics
- 1% rule
- 2.41% ✓
- Cap rate
- 20.83%
- Cash-on-cash
- 51.91%
- DSCR
- 3.31
- GRM
- 3.5
CMA / ARV
No comps found within radius.
Projected returns pro-forma
-3.0% appreciation · 4.57% rent growth · sell at horizon
- IRR
- 51.6%
- Equity multiple
- 3.32×
- Total profit
- $54,460
- Equity at exit
- $12,525
- IRR
- 57.6%
- Equity multiple
- 7.15×
- Total profit
- $144,732
- Equity at exit
- $7,263
Cash invested: $23,520 (down + closing). Projections, not guarantees.
Landlord ↔ Tenant lean methodology
- Overall (STATE)
- 90 Strongly Landlord-Friendly
- State South Carolina
- 90 Strongly Landlord-Friendly · R+6
- County
- — inherits STATE
- City
- — inherits STATE
ZIP-level market 29170
- Home prices YoY
- -16.9%
- Rents YoY
- 4.6%
- Active inventory
- 187
- Price-to-rent
- 3.5×
Monthly cashflow live
- Estimated rent
- $2,023 medium interval (Pro) →
- Mortgage (P&I)
- −$441
- Tax est. 1.5%
- −$105 /mo · $1,260/yr
- Insurance
- −$35
- HOA
- −$0
- Vacancy / Maint / Mgmt
- −$425
- Net cashflow
- $1,017
Break-even live
UW: 25.0% down · 7.5% · 30yr · 1.5% tax · 5.0% vac · 8.0% maint · 8.0% mgmt
Financing live
Cash to close
- Down payment
- $21,000
- Closing costs
- $2,520
- Reserves months
- —
- Total cash needed
- —
Loan-product check · same deal, 3 products live
Conventional
25% down · 7.5% · 30yr
- Down + closing
- —
- Monthly P&I
- —
- Monthly cashflow
- —
- DSCR
- —
- Eligible?
- —
Personal DTI + credit; lowest rate.
DSCR
20% down · 8.5% · 30yr
- Down + closing
- —
- Monthly P&I
- —
- Monthly cashflow
- —
- DSCR
- —
- Eligible?
- —
No personal income docs; deal must DSCR.
Hard money
10% down · 12.0% · 12mo
- Down + closing
- —
- Monthly P&I
- —
- Monthly cashflow
- —
- DSCR
- —
- Eligible?
- —
Short-term bridge; refi at stabilization.
Rent comps 2 comps
| Address | Beds | Baths | Sqft | Rent | $/sqft | DOM | Units | Dist |
|---|---|---|---|---|---|---|---|---|
| 600 Ermine Rd Lot 620 West Columbia, SC | 4.0 | 2.0 | 1216 | $1,875 | $1.54 | 18d | 1 | 0.01mi |
| 105 Landford Ct Lexington, SC | 3.0 | 2.0 | 1260 | $1,450 | $1.15 | 3d | 1 | 1.37mi |
HOA detail condo
- Monthly dues
- $0 · $0/yr
- Assessments
- None detected in remarks — confirm with the listing agent.
Listing history 29 events
-
2026-05-31pricedays on market $84,000 Active 24 DOM
-
2026-05-20price $90,000
-
2026-05-13price $95,000
-
2026-05-07$99,000 Active
-
2026-04-30historical
-
2026-04-28price $99,000
-
2026-04-20price $103,000
-
2026-04-16price $103,500
-
2026-04-10status Active
-
2026-04-10$103,000 Active
-
2026-04-10price $103,000
-
2026-04-10historical
-
2026-04-07historical
-
2026-03-10historical Active Under Contract
-
2026-03-01status Active
-
2026-03-01price $99,000
-
2026-02-19historical
-
2026-01-28status Active
-
2026-01-19price $89,000
-
2026-01-19historical
-
2026-01-16status Active
-
2026-01-16status Active
-
2026-01-16price $89,000
-
2026-01-16Active Under Contract
-
2026-01-16historical
-
2026-01-16historical
-
2026-01-16soldstatus $89,000 Closed
-
2026-01-16$76,234
-
2026-01-08$77,000 Active
ⓘ Source: listings_history table (triggers on properties + properties_extension) + one-shot
backfill from property_details.listing_events for pre-trigger history.
Climate risk First Street
- Flood 1/10 Low FEMA zone X (unshaded) · 0% chance over 30 yrs
- Wildfire 3/10 Moderate
- Heat 7/10 Severe 7 d/yr ≥108°F today · 16 d/yr by 30 yrs out
- Wind 6/10 Major 63% chance of damaging wind over 30 yrs
- Air quality 3/10 Moderate 2 unhealthy d/yr today · 2 by 30 yrs out
Nearby sold comps map
Loading sold comps map…
Walkable amenities ~0.75 mi
Loading nearby amenities…
Taxation est. · year 1
- Rental income
- $24,271
- − Mortgage interest
- −$4,705
- − Property taxes
- −$1,260
- − Insurance
- −$420
- − Repairs & maintenance
- −$1,942
- − Management
- −$1,942
- − Depreciation
- −$2,444
- Taxable income
- $11,559
- Est. tax owed @ 24.0%
- −$2,774
- After-tax cash flow
- $9,434/yr
For passive investors: Depreciation is non-cash, so a rental often shows a tax loss while cash-flowing — sheltering income. Rental losses are passive: they offset passive income freely, and up to $25,000/yr can offset ordinary (W-2) income if you actively participate and your MAGI is under $100k (phasing out to $0 by $150k); unused losses carry forward. On sale, claimed depreciation is recaptured at up to 25%, and gains may owe capital-gains tax (a 1031 exchange can defer both). Figures are a year-1 estimate at your 24.0% rate — not tax advice; consult a CPA.
Condition & rehab AI · 12 photos
This brand-new 2026 Clayton Sensation home in Lexington Village is move-in ready with good condition and minimal maintenance needed.
Value-add opportunities
- Both paint exterior — enhances curb appeal and resale value
- Both landscape around house — improves curb appeal and rental value
Renovation cost estimate screening
Value-add ROI direction
- Both paint exterior — enhances curb appeal and resale value ↑
- Both landscape around house — improves curb appeal and rental value ↑
ⓘ Cost ranges are severity-bucket heuristics (US national rule-of-thumb). Get contractor quotes + a written scope before underwriting a rehab budget.
Schools (NCES district)
- District
- Lexington 02
- NCES district ID
- 4502730
- Math proficiency
- 30% ▼ -6.00%
- Reading proficiency
- 38% ▬ 0.00%
- Median HH income
- $42,532
- Composite
- 28.78/100
- National rank
- #6669
- State rank
- #45 of 80 in SC
Livability — Springdale
- Score
- 63/100
- State rank
- #170
- US rank
- #15255
Category grades
Schools grade is shown separately in the Schools card above.
Census & demographics
- County
- Lexington County · 232,571 people
- City population
- 21,247
- Metro
- Columbia, SC
- Population (ZIP)
- 21,247
- Household income
- $74,902
- Rent vs Own
- Severe rent burden
- 147.0
Population outlook (Lexington County) Hauer SSP2
- Today (2025)
- 322,999 people
- By 2030
- 342,356 · +6.0%
- By 2040
- 377,715 · +16.9%
- By 2050
- 406,984 · +26.0%
- By 2075
- 465,447 · +44.1%
- By 2100
- 485,674 · +50.4%
Race, ethnicity, and origin ACS 2023
- Neighborhood character
- Predominantly White (66%)
- Race & ethnicity
- White 66% Black 17% Hispanic / Latino 10% Two or more races 8% Asian 3%
- Hispanic origin (detail)
- Mexican 6% Puerto Rican 1%
- Common ancestry
- Serbian 2% Italian 2% Romanian 2%
- Foreign-born
- 9% · Canada, Jamaica, Guatemala
- Languages at home
- 90% English-only · Spanish 7% Other Indo-European 2%
Political lean MEDSL · Lexington
- 2024 margin
- Solid R (+33.5) · D 32.5% · R 66.0% · Other 1.4%
- 2008→2024 swing
- +4.6pp toward D · 2008: -38.0pp · 2024: -33.5pp
- All cycles
- 2024: R+33.5 2020: R+30.1 2016: R+36.7 2012: R+37.8 2008: R+38.0
Not yet ingested
- Civics
- —
Market trends
- HPI YoY
- ▼ -52.72%
- Current HPI
- 259.713
- Rent YoY
- ▲ 4.57%
- Metro
- Columbia, SC
- State GDP YoY
- ▲ 4.51%
- F500 in state
- 2
Industry mix (Fortune 500 HQ in SC)
| Industry | F500 HQs | Revenue |
|---|---|---|
| Packaging | 1 | $7B |
|
||
Price history
+16.9% since first listed28 events — show timeline
- 2026-05-20 Price Changed $90,000 CCAR
- 2026-05-13 Price Changed $95,000 CCAR
- 2026-05-07 Listed $99,000 CCAR
- 2026-04-30 Listing Removed — CCAR
- 2026-04-28 Price Changed $99,000 CCAR
- 2026-04-20 Price Changed $103,000 CCAR
- 2026-04-16 Price Changed $103,500 CCAR
- 2026-04-10 Relisted — CCAR
- 2026-04-10 Listing Removed — CCAR
- 2026-04-10 Price Changed $103,000 CCAR
- 2026-04-10 Listed $103,000 CCAR
- 2026-04-07 Listing Removed — CCAR
- 2026-03-10 Contingent — CCAR
- 2026-03-01 Relisted — CCAR
- 2026-03-01 Price Changed $99,000 CCAR
- 2026-02-19 Listing Removed — CCAR
- 2026-01-28 Relisted — CCAR
- 2026-01-19 Price Changed $89,000 CCAR
- 2026-01-19 Listing Removed — CCAR
- 2026-01-16 Relisted — CCAR
- 2026-01-16 Relisted — CCAR
- 2026-01-16 Price Changed $89,000 CCAR
- 2026-01-16 Listed — CCAR
- 2026-01-16 Listed $76,234 CCAR
- 2026-01-16 Sold (MLS) $89,000 CCAR
- 2026-01-16 Listing Removed — CCAR
- 2026-01-16 Listing Removed — CCAR
- 2026-01-08 Listed $77,000 CCAR
Cash-flow waterfall
monthlySold comps — $/sqft
last 12 mo · ≤1 miLoading sold comps…