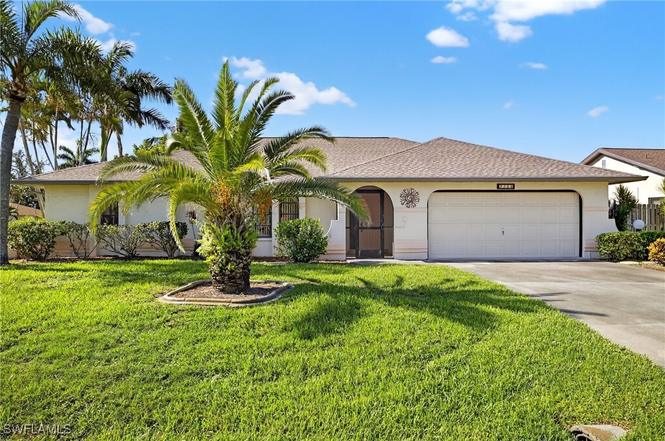
2244 SE 27th Ter · Cape Coral, FL
Flood risk 7/10 · Major
- FEMA flood zone
- AE
- Chance of flooding over 30 yrs
- 0.95%
- Est. flood insurance / yr
- $1,737 – $8,500
Fire risk 2/10 · Minimal
- Est. fire insurance / yr
- $947 – $1,759
Heat risk 10/10 · Severe
- Hot days now (above 107°F)
- 7 days/yr
- Hot days in 30 yrs
- 30 days/yr
Wind risk 10/10 · Severe
- Chance of severe wind over 30 yrs
- 99.0%
Air-quality risk 2/10 · Minimal
- Unhealthy air days now
- 1 days/yr
- Unhealthy air days in 30 yrs
- 1 days/yr
Risk factors via First Street. Map © Google.
Why this score? — see what drove the C+ grade
The composite is a weighted blend of 9 inputs, each scored 0–100. Each bar is that input's sub-score; the figure is the points it added to the 100-point composite (weight × sub-score).
- Cash flow +23.1/30.0
- ARV discount +15.0/15.0
- DSCR +7.4/10.0
- 1% rule +5.1/10.0
- Schools +4.1/10.0
- Livability +3.9/5.0
- Condition / age +2.5/5.0
- Rent growth +1.1/5.0
- Appreciation +0.0/10.0
$329,900
🖨 Deal sheet (PDF) 📄 Offer letter ✓ Due diligence
Listing remarks
Seller Motivated, Immaculate Original-Owner Home! Don’t miss your chance to own this beautifully maintained, '1990 custom home build in the highly sought-after Gold Coast Estates — an exclusive and serene community offering the ultimate Florida lifestyle. This meticulously cared-for property sits on a lushly landscaped lot surrounded by waterfront properties. Key Features: Custom- designed, one owner home with vaulted ceilings along with a unique spacious floor plan, A large primary suite includes a private sitting area, Walk-in closets in every bedroom, Split-bedroom layout for privacy and comfort, Separate living, dining and family rooms for flexible living space, Abundant sto
Key facts
- Split-bedroom layout
- Private sitting area
- Spacious floor plan
Tags
Property features AI
Finance
- Financial info: Pets allowed
- HOA & community: No association fee; Community features include boat facilities; Non-gated community
Exterior
- Parking: Attached 2-car garage with garage door opener; Driveway; Paved parking
- Utilities: Public water (assessment paid); Public sewer (assessment paid); Cable available; High-speed internet available
- Home design: Single-story; Entry level: 1; North-facing
- Construction: Block, concrete and stucco construction; Shingle roof
- Exterior features: Patio; Room for pool; Storage; Sprinkler/irrigation (automatic); Across-the-road water frontage; South exposure; Rectangular lot; Paved public road
Interior
- Kitchen: Dishwasher; Disposal; Range; Refrigerator; Icemaker
- Bedrooms: Guest quarters
- Flooring: Carpet; Tile
- Bathrooms: Two full bathrooms
- Heating & cooling: Central heating (electric); Central air conditioning (electric); Humidity control
- Interior features: Furnished; Attic with pull-down stairs; Separate/formal dining room; Combined family/dining room; Living/dining room; Fireplace; Custom mirrors; Pantry; Shower only (separate shower); Cable TV ready; Vaulted ceilings; Walk-in closets; Window treatments; Single-hung windows; Split bedroom floor plan
- Laundry & utility: Washer hookup inside; Dryer hookup inside; Washer; Dryer
Neighborhood map
What this means for you Summary
Snapshot
- This is a 3-bed/2.0-bath single-family listed at $330k.
Deal economics
- At list price, monthly cash flow is $165 ($2k/yr) — positive.
- The deal already cash-flows at list — no discount required.
- Meets the 1% rule at list price ($3k rent vs $330k).
- Recommended offer: $290k (12.0% below list) — sets the bar for market timing.
- Cap rate 8.4% vs local median 3.1% in Cape Coral — top-decile yield for the area; either an underpriced asset or a hidden risk that comps aren't pricing in. Stress-test before assuming the spread holds.
Location & tenants
- Location reads 77/100 on livability (#208 in FL, #3,098 nationally) — a middle-class / working-renter tenant base. Strengths: housing A+, health & safety A+, amenities B+; Watch: commute F.
- Lee (suburban): math 47% / reading 50% proficiency, ranked #42 of 73 in FL (top 58%) — families likely to look elsewhere, expect single-tenant / working-renter base with shorter leases.
- Zoned schools: Gulf Elementary School (math 70% / reading 65%, grade B+, #435 of 2,144 statewide, top 21%, 1,231 students, 38% FRL); Challenger Middle School (math 59% / reading 56%, grade B, #157 of 571 statewide, top 28%, 1,124 students, 50% FRL); Ida S. Baker High School (math 44% / reading 47%, grade D-, #223 of 667 statewide, top 34%, 1,933 students, 39% FRL) — zoned schools average 42% FRL vs 57% district-wide (15 pts lower); this property's tenant base skews higher-income than the district average.
- Market conditions: Rents falling (-5.5%/yr); 823 active listings in the ZIP; 25 comparable units currently listed for rent nearby; rentals at typical pace (median 26d on market — plan ~3-4 weeks tenant-placement turnaround); 15,411 units permitted in Lee County in 2024 (4,686 in 5+ unit buildings).
- At $3,343/mo this rent would consume 56% of the median local household income ($71k/yr) (locally 1182% of renters already pay >50% of income on rent) — very limited rent-growth headroom before tenants either downsize or default.
Forward outlook
- Local home prices are declining (-3.0%/yr); year-one equity from $2k of loan paydown is wiped out by about $10k of value loss. Plan a longer hold.
- Lee County population projected at +44% by 2050 — long-run rental-demand tailwind backs the buy-and-hold thesis.
Negotiation context
- It's been on market 330 days — a 12% lower offer ($290k) is reasonable based on typical stale-listing flexibility.
- 3 sale attempts; this cycle's ask has dropped $45k (12%) from the opening price — seller is motivated, your offer sets the floor, not the list.
- Current owner paid $17k; list at $330k implies a 1841% gain — meaningful room to come down on a strong offer.
Risks & watch-outs
- Watch-outs: flood insurance adds $427/mo.
- Climate carrying-cost: in FEMA flood zone AE (mandatory federal flood insurance); severe wind risk, 99% chance of damaging wind over 30y; extreme-heat days projected 7→30/yr by 2055 (HVAC capex compounding) — expect insurance premiums to compound above CPI over the hold.
Questions for the listing agent
- It's been on market 330 days. Have you received any prior offers? Is the seller open to a 12% concession, seller financing, or rate buy-down credit?
- What's the actual annual flood-insurance premium (NFIP or private), and is the property in a SFHA with mandatory coverage?
- Why hasn't it sold? Are there any deal-killer items the seller is aware of (foundation, flood, title, zoning, code violations)?
- Is there a deadline driving the sale (1031 exchange, divorce, estate, relocation)? That informs how much negotiation room exists.
- Schools are B-rated — typically a magnet for longer-tenancy family renters. What's the average tenant stay here, and is there a school-zone premium baked into asking?
- What's the average days-on-market for RENTAL listings here right now (not sales)? A rising rental-DOM trend means longer vacancies and softer asking-rent achievability than the comps imply.
- What's the recent tenant-quality profile in this submarket — average credit score on applications, eviction rate, late-payment / NSF rate, and stable-employment percentage? A property-management company in the area should have these aggregated.
- How much new for-sale + rental construction is in the pipeline within 1–3 miles? Heavy new supply typically softens prices + rents 12–24 months out; constrained supply supports both.
Investment metrics
- 1% rule
- 1.01% ✓
- Cap rate
- 8.44%
- Cash-on-cash
- 7.68%
- DSCR
- 1.34
- GRM
- 8.2
CMA / ARV
- ARV (on-the-fly)
- $582,180
- Comps found
- 8
Show comp detail 8 sales within ~0.75 mi
| Address | Dist | Beds/Ba | Sqft | Sold | Price | $/sf | Match |
|---|---|---|---|---|---|---|---|
| 2244 SE 27th St | 0.07mi | 3/2.5 | 1,705 (-8%) | 7mo | $522,250 | $306 | 75 |
| 2543 SE 22nd Ave | 0.18mi | 3/2.0 | 1,758 (-6%) | 12mo | $375,000 | $213 | 72 |
| 2121 SE 25th Ter | 0.31mi | 3/2.0 | 1,747 (-6%) | 10mo | $600,000 | $343 | 67 |
| 1922 SE 26th Ter | 0.54mi | 3/2.0 | 1,934 (+4%) | 3mo | $342,000 | $177 | 65 |
| 2243 SE 28th St | 0.08mi | 3/2.0 | 1,597 (-14%) | 14mo | $477,500 | $299 | 61 |
| 2711 SE 18th Ct | 0.66mi | 4/2.0 (+1) | 2,015 (+8%) | 6mo | $630,000 | $313 | 46 |
| 1828 SE 28th St | 0.70mi | 3/2.0 | 2,067 (+11%) | 12mo | $725,000 | $351 | 39 |
| 2636 SE 19th Pl | 0.54mi | 3/2.0 | 2,096 (+13%) | 18mo | $800,000 | $382 | 38 |
Match score weights: distance 35% · size 25% · config 20% · recency 20%. Top-matched comps best support the ARV.
Projected returns pro-forma
-3.0% appreciation · 0.0% rent growth · sell at horizon
- IRR
- -16.6%
- Equity multiple
- 0.43×
- Total profit
- $-52,578
- Equity at exit
- $49,189
- IRR
- -15.6%
- Equity multiple
- 0.25×
- Total profit
- $-69,421
- Equity at exit
- $28,524
Cash invested: $92,372 (down + closing). Projections, not guarantees.
Landlord ↔ Tenant lean methodology
- Overall (STATE)
- 87 Strongly Landlord-Friendly
- State Florida
- 87 Strongly Landlord-Friendly · R+3
- County
- — inherits STATE
- City
- — inherits STATE
ZIP-level market 33904
- Rents YoY
- -5.5%
- Active inventory
- 823
- Price-to-rent
- 8.2×
Monthly cashflow live
- Estimated rent
- $3,343 high interval (Pro) →
- Mortgage (P&I)
- −$1,730
- Tax from tax record
- −$182 /mo · $2,181/yr
- Insurance
- −$137
- Flood insurance flood zone
- −$427 /mo · $5,118/yr
- HOA
- −$0
- Vacancy / Maint / Mgmt
- −$702
- Net cashflow
- $165
Break-even live
Sensitivity live
| Price | -10% $352 | -5% $258 | +0% $165 | +5% $72 | +10% $-22 |
|---|---|---|---|---|---|
| Rent | -10% $-99 | -5% $33 | +0% $165 | +5% $297 | +10% $429 |
| Rate | -1.0pp $331 | -0.5pp $249 | base $165 | +0.5pp $79 | +1.0pp $-8 |
UW: 25.0% down · 7.5% · 30yr · 1.5% tax · 5.0% vac · 8.0% maint · 8.0% mgmt
Financing live
Cash to close
- Down payment
- $82,475
- Closing costs
- $9,897
- Reserves months
- —
- Total cash needed
- —
Loan-product check · same deal, 3 products live
Conventional
25% down · 7.5% · 30yr
- Down + closing
- —
- Monthly P&I
- —
- Monthly cashflow
- —
- DSCR
- —
- Eligible?
- —
Personal DTI + credit; lowest rate.
DSCR
20% down · 8.5% · 30yr
- Down + closing
- —
- Monthly P&I
- —
- Monthly cashflow
- —
- DSCR
- —
- Eligible?
- —
No personal income docs; deal must DSCR.
Hard money
10% down · 12.0% · 12mo
- Down + closing
- —
- Monthly P&I
- —
- Monthly cashflow
- —
- DSCR
- —
- Eligible?
- —
Short-term bridge; refi at stabilization.
Rent comps 25 comps
| Address | Beds | Baths | Sqft | Rent | $/sqft | DOM | Units | Dist |
|---|---|---|---|---|---|---|---|---|
| 2232 SE 27th St Cape Coral, FL | 3.0 | 3.0 | 1894 | $4,250 | $2.24 | 3d | 1 | 0.11mi |
| 2308 SE 27th St Cape Coral, FL | 3.0 | 2.0 | 1612 | $4,520 | $2.80 | 25d | 1 | 0.20mi |
| 2423 Everest Pkwy Cape Coral, FL | 3.0 | 2.0 | 1683 | $4,350 | $2.58 | 13d | 1 | 0.47mi |
| 2633 SE 19th Pl Cape Coral, FL | 3.0 | 2.0 | 1924 | $8,379 | $4.35 | 25d | 1 | 0.52mi |
| 3142 SE 22nd Pl Cape Coral, FL | 4.0 | 2.0 | 2170 | $3,500 | $1.61 | 25d | 1 | 0.68mi |
| 3010 SE 19th Ave Cape Coral, FL | 3.0 | 2.0 | 2435 | $2,800 | $1.15 | 25d | 1 | 0.81mi |
| 1809 Everest Pkwy Cape Coral, FL | 3.0 | 2.5 | 1680 | $2,400 | $1.43 | 25d | 1 | 0.83mi |
| 1638 SE 28th St Cape Coral, FL | 3.0 | 2.0 | 1317 | $2,850 | $2.16 | 15d | 1 | 0.93mi |
| 2220 SE 18th Ave Cape Coral, FL | 4.0 | 2.0 | 2274 | $3,200 | $1.41 | 23d | 1 | 0.94mi |
| 3105 SE 18th Ave Cape Coral, FL | 3.0 | 2.0 | 1978 | $2,995 | $1.51 | 5d | 1 | 0.95mi |
| 1608 SE 28th Ter Unit A28 Cape Coral, FL | 2.0 | 2.5 | 1444 | $1,400 | $0.97 | 25d | 1 | 1.05mi |
| 3021 SE 17th Ave Cape Coral, FL | 3.0 | 2.0 | 1317 | $3,955 | $3.00 | 25d | 1 | 1.06mi |
| 3510 SE 19th Pl Cape Coral, FL | 3.0 | 3.0 | 2318 | $4,000 | $1.73 | 16d | 1 | 1.20mi |
| 3418 SE 19th Ave Cape Coral, FL | 3.0 | 2.0 | 1880 | $3,500 | $1.86 | 25d | 1 | 1.20mi |
| 1795 Four Mile Cove Pkwy #834 Cape Coral, FL | 2.0 | 2.0 | 1226 | $3,300 | $2.69 | 25d | 1 | 1.33mi |
| 1320 SE 25th Ln Cape Coral, FL | 3.0 | 2.0 | 1752 | $2,700 | $1.54 | 5d | 1 | 1.36mi |
| 1401 Everest Pkwy Cape Coral, FL | 2.0 | 2.0 | 1436 | $2,250 | $1.57 | 16d | 1 | 1.37mi |
| 1789 Four Mile Cove Pkwy Cape Coral, FL | 3.0 | 2.0 | 1362 | $2,188 | $1.61 | 5d | 2 | 1.39mi |
| 1789 Four Mile Cove Pkwy #541 Cape Coral, FL | 3.0 | 2.0 | 1395 | $2,200 | $1.58 | 25d | 1 | 1.39mi |
| 2063 Ottersrest Ln Cape Coral, FL | 3.0 | 2.0 | 1414 | $2,095 | $1.48 | 25d | 1 | 1.40mi |
| 1326 SE 23rd Ter Cape Coral, FL | 3.0 | 2.0 | 1982 | $2,150 | $1.08 | 16d | 1 | 1.43mi |
| 1781 Four Mile Cove Pkwy #133 Cape Coral, FL | 2.0 | 2.0 | 1226 | $1,649 | $1.35 | 25d | 1 | 1.44mi |
| 1502 SE 33rd St Cape Coral, FL | 3.0 | 2.0 | 1430 | $2,100 | $1.47 | 5d | 1 | 1.46mi |
| 1410 SE 31st Ter Cape Coral, FL | 3.0 | 2.0 | 1792 | $5,600 | $3.12 | 25d | 1 | 1.46mi |
| 1235 Shelby Pkwy Cape Coral, FL | 3.0 | 2.0 | 1479 | $2,200 | $1.49 | 5d | 1 | 1.49mi |
Listing history 20 events
-
2026-06-22days on market $329,900 Active 330 DOM
-
2026-06-17days on market $329,900 Active 326 DOM
-
2026-06-16days on market $329,900 Active 325 DOM
-
2026-06-16days on market $329,900 Active 324 DOM
-
2026-06-13days on market $329,900 Active 322 DOM
-
2026-06-09days on market $329,900 Active 318 DOM
-
2026-06-07days on market $329,900 Active 316 DOM
-
2026-06-02days on market $329,900 Active 311 DOM
-
2026-06-01days on market $329,900 Active 310 DOM
-
2026-06-01days on market $329,900 Active 309 DOM
-
2026-04-22price $329,900
-
2026-02-16price $343,900
-
2026-02-15status Active
-
2026-02-07status Pending
-
2026-01-12price $344,900
-
2025-10-31price $364,900
-
2025-09-15status Active
-
2025-09-13status Pending
-
2025-07-16$374,900 Active
-
1988-04-20soldstatus $17,000
ⓘ Source: listings_history table (triggers on properties + properties_extension) + one-shot
backfill from property_details.listing_events for pre-trigger history.
Tax reassessment forecast FL · Resets to sale price
- Current annual tax
- $2,181 · $182/mo
- Projected year-2 tax
- $2,738 · $228/mo
- Expected delta
- +$557/yr (+$46/mo · 25.5%)
ⓘ Screening estimate from a state-policy table — verify with the county assessor before closing.
Climate risk First Street
- Flood 7/10 Severe FEMA zone AE · 95% chance over 30 yrs
- Wildfire 2/10 Low
- Heat 10/10 Extreme 7 d/yr ≥107°F today · 30 d/yr by 30 yrs out
- Wind 10/10 Extreme 99% chance of damaging wind over 30 yrs
- Air quality 2/10 Low 1 unhealthy d/yr today · 1 by 30 yrs out
Nearby sold comps map
Loading sold comps map…
Walkable amenities ~0.75 mi
Loading nearby amenities…
Taxation est. · year 1
- Rental income
- $40,113
- − Mortgage interest
- −$18,480
- − Property taxes
- −$2,181
- − Insurance
- −$6,768
- − Repairs & maintenance
- −$3,209
- − Management
- −$3,209
- − Depreciation
- −$9,597
- Taxable loss
- −$3,331
- Est. tax savings @ 24.0%
- +$799
- After-tax cash flow
- $2,779/yr
For passive investors: Depreciation is non-cash, so a rental often shows a tax loss while cash-flowing — sheltering income. Rental losses are passive: they offset passive income freely, and up to $25,000/yr can offset ordinary (W-2) income if you actively participate and your MAGI is under $100k (phasing out to $0 by $150k); unused losses carry forward. On sale, claimed depreciation is recaptured at up to 25%, and gains may owe capital-gains tax (a 1031 exchange can defer both). Figures are a year-1 estimate at your 24.0% rate — not tax advice; consult a CPA.
Schools (NCES district)
- District
- Lee
- NCES district ID
- 1201080
- Math proficiency
- 47% ▼ -11.00%
- Reading proficiency
- 50% ▼ -4.00%
- Median HH income
- $49,518
- Composite
- 41.49/100
- National rank
- #3458
- State rank
- #42 of 73 in FL
Livability — Cape Coral
- Score
- 77/100
- State rank
- #208
- US rank
- #3098
Category grades
Schools grade is shown separately in the Schools card above.
Census & demographics
- Census place
- Cape Coral, FL
- County
- Lee County · 788,662 people
- City population
- 217,388
- Metro
- Cape Coral-Fort Myers, FL
- Population (ZIP)
- 33,599
- Household income
- $71,190
- Rent vs Own
- Severe rent burden
- 1182.0
Population outlook (Lee County) Hauer SSP2
- Today (2025)
- 871,946 people
- By 2030
- 955,468 · +9.6%
- By 2040
- 1,113,587 · +27.7%
- By 2050
- 1,256,891 · +44.1%
- By 2075
- 1,560,270 · +78.9%
- By 2100
- 1,726,848 · +98.0%
Race, ethnicity, and origin ACS 2023
- Neighborhood character
- Predominantly White (76%)
- Race & ethnicity
- White 76% Hispanic / Latino 16% Two or more races 11% Black 3% Asian 2%
- Hispanic origin (detail)
- Mexican 2% Puerto Rican 2% Cuban 9%
- Common ancestry
- Romanian 4% Lithuanian 2% Slovak 2%
- Foreign-born
- 14% · Canada, China, Jamaica
- Languages at home
- 82% English-only · Spanish 13% Other Indo-European 1% Chinese 1%
Political lean MEDSL · Lee
- 2024 margin
- Strong R (+28.4) · D 35.5% · R 63.9%
- 2008→2024 swing
- -18.0pp toward R · 2008: -10.4pp · 2024: -28.4pp
- All cycles
- 2024: R+28.4 2020: R+19.2 2016: R+20.4 2012: R+16.6 2008: R+10.4
Not yet ingested
- Civics
- —
Market trends
- HPI YoY
- ▼ -190.05%
- Current HPI
- 266.3458
- Rent YoY
- ▼ -5.48%
- Metro
- Cape Coral-Fort Myers, FL
- State GDP YoY
- ▲ 3.28%
- F500 in state
- 36
Industry mix (Fortune 500 HQ in FL)
| Industry | F500 HQs | Revenue |
|---|---|---|
| Industrial Technology | 2 | $29B |
|
||
| Insurance | 2 | $17B |
|
||
| Retail | 1 | $60B |
|
||
| Technology Distribution | 1 | $58B |
|
||
| Homebuilding | 1 | $35B |
|
||
| Technology Manufacturing | 1 | $35B |
|
||
Price history
+1840.6% since first listed10 events — show timeline
- 2026-04-22 Price Changed $329,900 FORTMLS
- 2026-02-16 Price Changed $343,900 FORTMLS
- 2026-02-15 Relisted — FORTMLS
- 2026-02-07 Pending — FORTMLS
- 2026-01-12 Price Changed $344,900 FORTMLS
- 2025-10-31 Price Changed $364,900 FORTMLS
- 2025-09-15 Relisted — FORTMLS
- 2025-09-13 Pending — FORTMLS
- 2025-07-16 Listed $374,900 FORTMLS
- 1988-04-20 Sold (Public Records) $17,000 Public Records
Property tax history
+3.7%/yrLatest (2025): $2,181 · +9.1% YoY. Source: county tax records.
Cash-flow waterfall
monthlySold comps — $/sqft
last 12 mo · ≤1 miLoading sold comps…