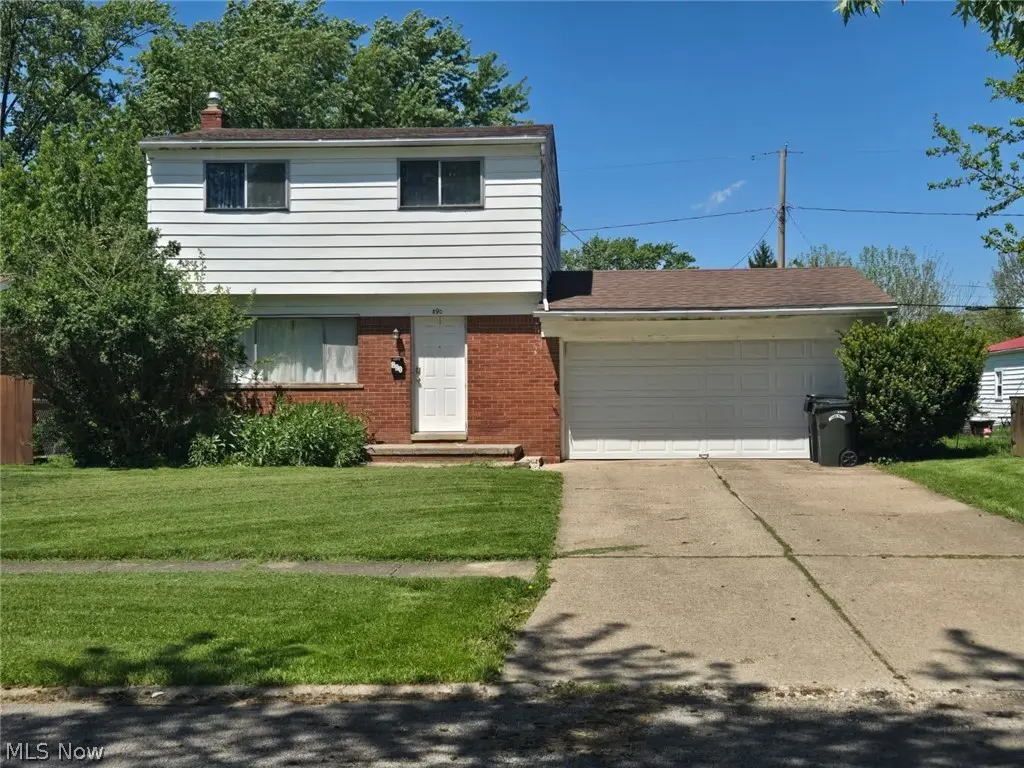
890 Salem Ave · Elyria, OH
Flood risk 1/10 · Minimal
- FEMA flood zone
- X (unshaded)
- Chance of flooding over 30 yrs
- 0.0%
- Est. flood insurance / yr
- $473 – $860
Fire risk 1/10 · Minimal
- Est. fire insurance / yr
- $713 – $1,323
Heat risk 3/10 · Minor
- Hot days now (above 99°F)
- 7 days/yr
- Hot days in 30 yrs
- 16 days/yr
Wind risk 1/10 · Minimal
- Chance of severe wind over 30 yrs
- —
Air-quality risk 3/10 · Minor
- Unhealthy air days now
- 2 days/yr
- Unhealthy air days in 30 yrs
- 4 days/yr
Risk factors via First Street. Map © Google.
Why this score? — see what drove the D+ grade
The composite is a weighted blend of 9 inputs, each scored 0–100. Each bar is that input's sub-score; the figure is the points it added to the 100-point composite (weight × sub-score).
- ARV discount +15.0/15.0
- Cash flow +12.7/30.0
- Rent growth +4.2/5.0
- 1% rule +3.8/10.0
- DSCR +3.8/10.0
- Livability +3.8/5.0
- Condition / age +2.5/5.0
- Schools +2.4/10.0
- Appreciation +0.0/10.0
$139,900
🖨 Deal sheet 📄 Offer letter ✓ Due diligence
Listing remarks
Located on Elyria’s northside, this home has easy access to highways, shopping, dining, medical care, and Lorain County Community College. Concrete patio off the kitchen area, full basement, gas heat, and a two car garage.
Key facts
- Gas heat
- Concrete patio
- Full basement
Tags
Property features AI
Exterior
- Parking: Attached 2-car garage
- Utilities: Public water; Public sewer
- Home design: 2-story home; Above-grade living area approximately 1,056
- Construction: Built according to public records; Aluminum siding and brick exterior; Asphalt/fiberglass roof
- Exterior features: Flat, level lot; Patio; Porch; Faces south
Interior
- Bathrooms: 1 full bathroom; 1 half bathroom
- Heating & cooling: Forced-air gas heating
- Interior features: Full basement; Patio and porch
- Laundry & utility: Laundry located in the basement
Neighborhood map
What this means for you Summary
Snapshot
- This is a 3-bed/1.5-bath single-family listed at $140k.
Deal economics
- At list price, monthly cash flow is $-16 ($-195/yr) — negative.
- To cash-flow at today's rent, offer at most $137k (2.1% below list).
- To meet the 1% rule (rent ≥ 1% of price), the offer needs to be $123k (12.0% below list).
- Recommended offer: $123k (12.0% below list) — sets the bar for 1% rule.
- Cap rate 6.2% vs local median 3.8% in Elyria — top-decile yield for the area; either an underpriced asset or a hidden risk that comps aren't pricing in. Stress-test before assuming the spread holds.
Location & tenants
- Location reads 75/100 on livability (#243 in OH, #3,869 nationally) — a middle-class / working-renter tenant base. Strengths: cost of living A+, housing A+, health & safety A; Watch: schools C-, employment D, commute F.
- Elyria City Schools (urban): math 21% / reading 37% proficiency, ranked #586 of 656 in OH (top 89%) — low school quality limits family demand, transient renter base, plan for 1-2y turnover.
- Market conditions: Rents rising fast (+6.7%/yr); 356 active listings in the ZIP; 6 comparable units currently listed for rent nearby; rentals leasing fast (median 2d on market — plan ~1-2 weeks tenant-placement turnaround); 1,098 units permitted in Lorain County in 2024 (20 in 5+ unit buildings).
Forward outlook
- Local home prices are declining (-3.0%/yr); year-one equity from $967 of loan paydown is wiped out by about $4k of value loss. Plan a longer hold.
Negotiation context
- It's been on market 18 days — a 2% lower offer ($138k) is reasonable based on typical stale-listing flexibility.
- 2 sale attempts since 10y ago with the ask held roughly flat each time — persistent listings suggest the price (not the market) is what's stuck; bring a comps-based counter.
- Current owner paid $103k; 36% above their basis — modest negotiation headroom, anchor on the comps not their cost.
Questions for the listing agent
- What do current leases actually rent for vs. the listed asking? Can we see a recent rent roll and the last 12 months of T-12 income?
- Built in 1963 — when were the roof, HVAC, electrical panel, plumbing, and water heater last replaced?
- Is there a deadline driving the sale (1031 exchange, divorce, estate, relocation)? That informs how much negotiation room exists.
- The area grade is low — what's the realistic commute time and amenity access for the typical tenant pool here? Any planned neighborhood developments (good or bad) we should know about?
- What's the average days-on-market for RENTAL listings here right now (not sales)? A rising rental-DOM trend means longer vacancies and softer asking-rent achievability than the comps imply.
- What's the recent tenant-quality profile in this submarket — average credit score on applications, eviction rate, late-payment / NSF rate, and stable-employment percentage? A property-management company in the area should have these aggregated.
- How much new for-sale + rental construction is in the pipeline within 1–3 miles? Heavy new supply typically softens prices + rents 12–24 months out; constrained supply supports both.
Investment metrics
- 1% rule
- 0.88% ✗
- Cap rate
- 6.15%
- Cash-on-cash
- -0.50%
- DSCR
- 0.98
- GRM
- 9.5
CMA / ARV
- ARV (on-the-fly)
- $210,144
- Comps found
- 12
Show comp detail 12 sales within ~0.75 mi
| Address | Dist | Beds/Ba | Sqft | Sold | Price | $/sf | Match |
|---|---|---|---|---|---|---|---|
| 837 Jamestown Ave | 0.22mi | 3/1.5 | 1,056 (0%) | 1mo | $205,000 | $194 | 89 |
| 856 Salem Ave | 0.08mi | 4/1.5 (+1) | 1,056 (0%) | 3mo | $210,000 | $199 | 88 |
| 727 Fairwood Blvd | 0.23mi | 3/1.5 | 1,056 (0%) | 2mo | $269,000 | $255 | 87 |
| 921 Rosewood Dr | 0.18mi | 4/1.0 (+1) | 1,008 (-4%) | 7mo | $192,500 | $191 | 71 |
| 853 Jamestown Ave | 0.20mi | 3/1.5 | 945 (-10%) | 4mo | $209,000 | $221 | 70 |
| 897 Livermore Ln | 0.25mi | 3/1.0 | 945 (-10%) | 0mo | $203,000 | $215 | 69 |
| 728 Georgetown Ave | 0.13mi | 3/2.0 | 925 (-12%) | 5mo | $179,900 | $194 | 67 |
| 913 Rosewood Dr | 0.17mi | 3/1.0 | 912 (-14%) | 3mo | $220,100 | $241 | 65 |
| 825 Jamestown Ave | 0.24mi | 3/1.5 | 925 (-12%) | 8mo | $161,900 | $175 | 62 |
| 643 Augdon Dr | 0.55mi | 3/2.0 | 1,101 (+4%) | 6mo | $220,000 | $200 | 60 |
| 706 S Abbe Rd N | 0.34mi | 3/1.0 | 925 (-12%) | 7mo | $168,000 | $182 | 56 |
| 145 Whitman Blvd | 0.70mi | 3/1.0 | 1,160 (+10%) | 8mo | $189,000 | $163 | 42 |
Match score weights: distance 35% · size 25% · config 20% · recency 20%. Top-matched comps best support the ARV.
Projected returns pro-forma
-3.0% appreciation · 6.74% rent growth · sell at horizon
- IRR
- -12.9%
- Equity multiple
- 0.52×
- Total profit
- $-18,868
- Equity at exit
- $20,860
- IRR
- 1.1%
- Equity multiple
- 1.09×
- Total profit
- $3,661
- Equity at exit
- $12,096
Cash invested: $39,172 (down + closing). Projections, not guarantees.
Landlord ↔ Tenant lean methodology
- Overall (STATE)
- 73 Landlord-Friendly
- State Ohio
- 73 Landlord-Friendly · R+6
- County
- — inherits STATE
- City
- — inherits STATE
ZIP-level market 44035
- Rents YoY
- 6.7%
- Active inventory
- 356
- Price-to-rent
- 9.5×
Monthly cashflow live
- Estimated rent
- $1,230 high interval (Pro) →
- Mortgage (P&I)
- −$734
- Tax from tax record
- −$196 /mo · $2,356/yr
- Insurance
- −$58
- HOA
- −$0
- Vacancy / Maint / Mgmt
- −$258
- Net cashflow
- $-16
Break-even live
UW: 25.0% down · 7.5% · 30yr · 1.5% tax · 5.0% vac · 8.0% maint · 8.0% mgmt
Financing live
Cash to close
- Down payment
- $34,975
- Closing costs
- $4,197
- Reserves months
- —
- Total cash needed
- —
Loan-product check · same deal, 3 products live
Conventional
25% down · 7.5% · 30yr
- Down + closing
- —
- Monthly P&I
- —
- Monthly cashflow
- —
- DSCR
- —
- Eligible?
- —
Personal DTI + credit; lowest rate.
DSCR
20% down · 8.5% · 30yr
- Down + closing
- —
- Monthly P&I
- —
- Monthly cashflow
- —
- DSCR
- —
- Eligible?
- —
No personal income docs; deal must DSCR.
Hard money
10% down · 12.0% · 12mo
- Down + closing
- —
- Monthly P&I
- —
- Monthly cashflow
- —
- DSCR
- —
- Eligible?
- —
Short-term bridge; refi at stabilization.
Rent comps 6 comps
| Address | Beds | Baths | Sqft | Rent | $/sqft | DOM | Units | Dist |
|---|---|---|---|---|---|---|---|---|
| 820 Rosewood Dr Elyria, OH | 1.0–3.0 | 1.0–1.5 | 766 | $1,325 | $1.73 | 1d | 1 | 0.26mi |
| 525 Georgetown Ave Elyria, OH | 2.0 | 1.0 | 690 | $810 | $1.17 | 1d | 1 | 0.79mi |
| 180 College Park Dr Elyria, OH | 2.0 | 1.5 | 833 | $838 | $1.01 | 1d | 1 | 0.97mi |
| 689 Lucille Dr Elyria, OH | 3.0 | 1.0 | 1225 | $1,425 | $1.16 | 1d | 1 | 1.00mi |
| 424 Wesley Ave Elyria, OH | 2.0 | 1.0 | 700 | $949 | $1.36 | 1d | 1 | 1.00mi |
| 327 Beebe Ave Elyria, OH | 3.0 | 1.0 | 976 | $1,650 | $1.69 | 16d | 1 | 1.30mi |
Listing history 6 events
-
2026-05-22status Pending
-
2026-05-04$139,900 Active
-
2017-01-27historical
-
2016-12-07price $79,900
-
2016-06-07$95,900 Active
-
1993-11-04soldstatus $103,000
ⓘ Source: listings_history table (triggers on properties + properties_extension) + one-shot
backfill from property_details.listing_events for pre-trigger history.
Tax reassessment forecast OH · Partial reset (capped growth)
- Current annual tax
- $2,356 · $196/mo
- Projected year-2 tax
- $2,356 · $196/mo
- Expected delta
- $0/yr ($0/mo · 0.0%)
ⓘ Screening estimate from a state-policy table — verify with the county assessor before closing.
Climate risk First Street
- Flood 1/10 Low FEMA zone X (unshaded) · 0% chance over 30 yrs
- Wildfire 1/10 Low
- Heat 3/10 Moderate 7 d/yr ≥99°F today · 16 d/yr by 30 yrs out
- Wind 1/10 Low
- Air quality 3/10 Moderate 2 unhealthy d/yr today · 4 by 30 yrs out
Nearby sold comps map
Loading sold comps map…
Walkable amenities ~0.75 mi
Loading nearby amenities…
Taxation est. · year 1
- Rental income
- $14,766
- − Mortgage interest
- −$7,837
- − Property taxes
- −$2,356
- − Insurance
- −$700
- − Repairs & maintenance
- −$1,181
- − Management
- −$1,181
- − Depreciation
- −$4,070
- Taxable loss
- −$2,559
- Est. tax savings @ 24.0%
- +$614
- After-tax cash flow
- $419/yr
For passive investors: Depreciation is non-cash, so a rental often shows a tax loss while cash-flowing — sheltering income. Rental losses are passive: they offset passive income freely, and up to $25,000/yr can offset ordinary (W-2) income if you actively participate and your MAGI is under $100k (phasing out to $0 by $150k); unused losses carry forward. On sale, claimed depreciation is recaptured at up to 25%, and gains may owe capital-gains tax (a 1031 exchange can defer both). Figures are a year-1 estimate at your 24.0% rate — not tax advice; consult a CPA.
Schools (NCES district)
- District
- Elyria City Schools
- NCES district ID
- 3904394
- Math proficiency
- 21% ▼ -25.00%
- Reading proficiency
- 37% ▼ -15.00%
- Median HH income
- $40,992
- Composite
- 24.45/100
- National rank
- #7670
- State rank
- #586 of 656 in OH
Livability — Elyria
- Score
- 75/100
- State rank
- #243
- US rank
- #3869
Category grades
Schools grade is shown separately in the Schools card above.
Census & demographics
- Census place
- Elyria, OH
- County
- Lorain County · 219,437 people
- City population
- 62,179
- Metro
- Cleveland-Elyria, OH
- Population (ZIP)
- 62,179
- Household income
- $56,408
- Rent vs Own
- Severe rent burden
- 2229.0
Population outlook (Lorain County) Hauer SSP2
- Today (2025)
- 314,924 people
- By 2030
- 317,546 · +0.8%
- By 2040
- 317,962 · +1.0%
- By 2050
- 312,872 · -0.7%
- By 2075
- 301,806 · -4.2%
- By 2100
- 278,271 · -11.6%
Race, ethnicity, and origin ACS 2023
- Neighborhood character
- Predominantly White (70%)
- Race & ethnicity
- White 70% Two or more races 12% Black 11% Hispanic / Latino 10% Asian 1%
- Hispanic origin (detail)
- Mexican 2% Puerto Rican 6%
- Common ancestry
- Romanian 5% Slovak 2% Lithuanian 2%
- Foreign-born
- 2% · China, Canada
- Languages at home
- 94% English-only · Spanish 4% Chinese 1%
Political lean MEDSL · Lorain
- 2024 margin
- Lean R (+5.7) · D 46.7% · R 52.4%
- 2008→2024 swing
- -23.6pp toward R · 2008: 17.9pp · 2024: -5.7pp
- All cycles
- 2024: R+5.7 2020: R+2.5 2016: R+0.3 2012: D+14.4 2008: D+17.9
Not yet ingested
- Civics
- —
Market trends
- HPI YoY
- ▼ -139.09%
- Current HPI
- 199.7354
- Rent YoY
- ▲ 6.74%
- Metro
- Cleveland-Elyria, OH
- State GDP YoY
- ▲ 1.98%
- F500 in state
- 48
Industry mix (Fortune 500 HQ in OH)
| Industry | F500 HQs | Revenue |
|---|---|---|
| Insurance | 3 | $145B |
|
||
| Industrial Machinery | 3 | $49B |
|
||
| Financial Services | 3 | $24B |
|
||
| Consumer Goods | 2 | $93B |
|
||
| Aerospace / Defense | 2 | $47B |
|
||
| Utilities | 2 | $33B |
|
||
Price history
+35.8% since first listed6 events — show timeline
- 2026-05-22 Pending — MLSNOW
- 2026-05-04 Listed $139,900 MLSNOW
- 2017-01-27 Listing Removed — MLSNOW
- 2016-12-07 Price Changed $79,900 MLSNOW
- 2016-06-07 Listed $95,900 MLSNOW
- 1993-11-04 Sold (Public Records) $103,000 Public Records
Property tax history
+2.6%/yrLatest (2025): $2,356 · +3.1% YoY. Source: county tax records.
Cash-flow waterfall
monthlySold comps — $/sqft
last 12 mo · ≤1 miLoading sold comps…