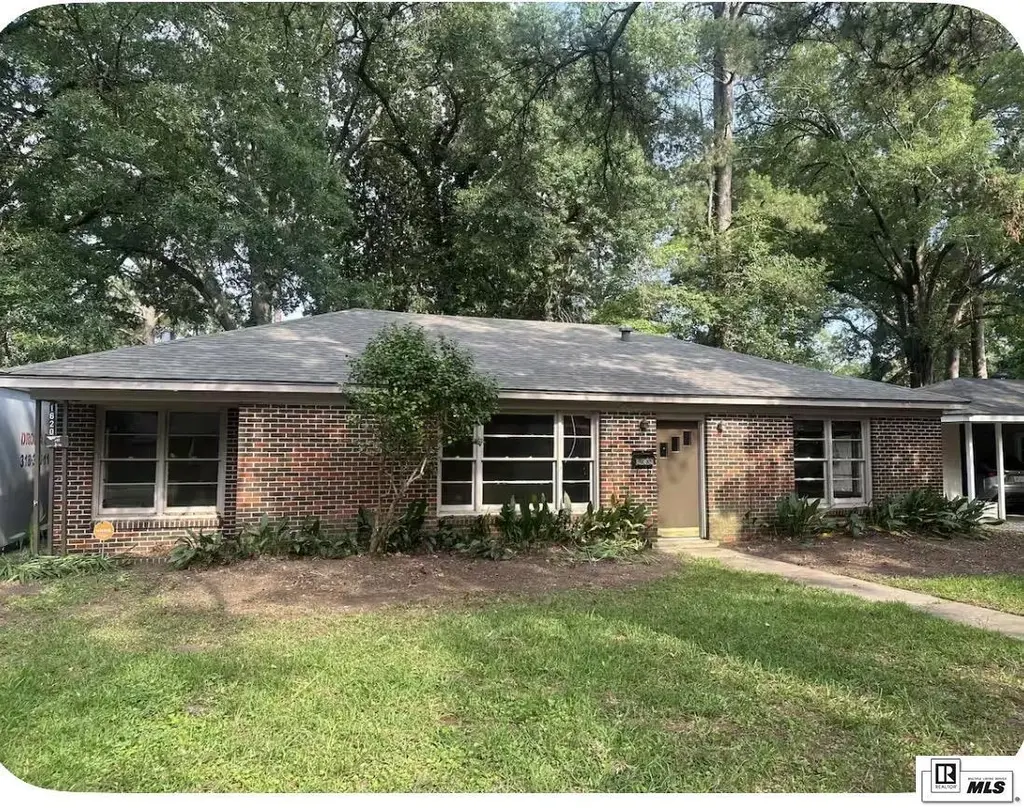
1620 Milton St · Monroe, LA
Flood risk 1/10 · Minimal
- FEMA flood zone
- X (shaded)
- Chance of flooding over 30 yrs
- 0.0%
- Est. flood insurance / yr
- $507 – $1,088
Fire risk 1/10 · Minimal
- Est. fire insurance / yr
- $1,269 – $2,357
Heat risk 7/10 · Major
- Hot days now (above 111°F)
- 7 days/yr
- Hot days in 30 yrs
- 19 days/yr
Wind risk 7/10 · Major
- Chance of severe wind over 30 yrs
- 78.0%
Air-quality risk 1/10 · Minimal
- Unhealthy air days now
- 0 days/yr
- Unhealthy air days in 30 yrs
- 0 days/yr
Risk factors via First Street. Map © Google.
Why this score? — see what drove the D grade
The composite is a weighted blend of 9 inputs, each scored 0–100. Each bar is that input's sub-score; the figure is the points it added to the 100-point composite (weight × sub-score).
- Cash flow +16.8/30.0
- DSCR +5.2/10.0
- ARV discount +4.5/15.0
- 1% rule +3.8/10.0
- Livability +3.3/5.0
- Rent growth +2.5/5.0
- Condition / age +2.5/5.0
- Schools +2.1/10.0
- Appreciation +0.0/10.0
$199,000
🖨 Deal sheet 📄 Offer letter ✓ Due diligence
Listing remarks
This 3-bedroom, 1.5 bath home sits on a large lot in a fantastic location and has been nicely updated inside, making it truly move-in ready. Great Location! Great Home! Half bath is located in extra room in garage. The layout offers comfortable living with an extra room off the carport—perfect for a home office, bonus space, or additional storage. Currently operating as a successful Airbnb, giving you options: Continue as a short-term rental Convert to a long-term investment Or enjoy as a primary residence with added flexibility ?? Showing Notice: Home is actively used as an Airbnb—please allow time for coordinated showings.
Key facts
- Short term rental
- Large lot
- Successful airbnb
Tags
Property features AI
Finance
- Other: Lot dimensions approximately 75 x 174.12 x 84.57 x 174
- HOA & community: No association amenities
Exterior
- Parking: 2-car garage; Carport; Open parking
- Security: Smoke detectors
- Utilities: Public water; Public sewer; Natural gas available and connected; Electric service (implied by electric cooling)
- Home design: Single-family residence (site built); One story; Entry level: 1; Brick veneer construction; Facing direction not specified
- Construction: Brick veneer exterior; Asphalt roof; Slab foundation; Built year not specified
- Exterior features: Covered patio/porch; Landscaped lot; Irregular-shaped lot; Other lot features; Paved road access
Interior
- Kitchen: Dishwasher; Gas range
- Bedrooms: Three main-level bedrooms
- Bathrooms: One full bathroom; One half bathroom; Two main-level bathrooms; One partial bathroom
- Heating & cooling: Central heating (natural gas); Central electric air conditioning; Ceiling fans
- Interior features: Ceiling fans; No fireplace
- Laundry & utility: Gas water heater
Neighborhood map
What this means for you Summary
Snapshot
- This is a 2-bed/2.0-bath single-family listed at $199k.
Deal economics
- At list price, monthly cash flow is $127 ($2k/yr) — positive.
- The deal already cash-flows at list — no discount required.
- To meet the 1% rule (rent ≥ 1% of price), the offer needs to be $175k (12.3% below list).
- Recommended offer: $175k (12.3% below list) — sets the bar for 1% rule.
- Cap rate 7.1% vs local median 5.7% in Monroe — meaningfully above typical; check what's discounted (condition, days-on-market, listing class) to confirm the premium yield is real.
Location & tenants
- Location reads 66/100 on livability (#128 in LA) — a middle-class / working-renter tenant base. Strengths: cost of living A+, health & safety A+; Watch: crime F, amenities F, commute F.
- City Of Monroe School District (urban): math 21% / reading 31% proficiency, ranked #60 of 98 in LA (top 61%) — low school quality limits family demand, transient renter base, plan for 1-2y turnover; 82% free/reduced lunch — lower-income household profile, screen leases tightly.
- Market conditions: 142 active listings in the ZIP; 2 comparable units currently listed for rent nearby; 345 units permitted in Ouachita Parish in 2024 (0 in 5+ unit buildings).
- This rent runs 32% of the median local income ($65k/yr) — at the standard rent-burdened threshold; future hikes will face affordability resistance.
Forward outlook
- Local home prices are declining (-3.0%/yr); year-one equity from $1k of loan paydown is wiped out by about $6k of value loss. Plan a longer hold.
Negotiation context
- It's been on market 20 days — a 2% lower offer ($196k) is reasonable based on typical stale-listing flexibility.
- 3 sale attempts with the ask held roughly flat each time — persistent listings suggest the price (not the market) is what's stuck; bring a comps-based counter.
- Current owner paid $150k; 33% above their basis — modest negotiation headroom, anchor on the comps not their cost.
Risks & watch-outs
- Watch-outs: built in 1950 — expect roof / HVAC / electrical / plumbing capex.
- Climate carrying-cost: major wind risk, 78% chance of damaging wind over 30y; extreme-heat days projected 7→19/yr by 2055 (HVAC capex compounding) — expect insurance premiums to compound above CPI over the hold.
Questions for the listing agent
- Built in 1950 — when were the roof, HVAC, electrical panel, plumbing, and water heater last replaced?
- Is there a deadline driving the sale (1031 exchange, divorce, estate, relocation)? That informs how much negotiation room exists.
- Crime grade is F in this area — have there been break-ins, vandalism, or insurance claims at this property in the last 3 years? What carrier currently insures it and at what premium?
- The area grade is low — what's the realistic commute time and amenity access for the typical tenant pool here? Any planned neighborhood developments (good or bad) we should know about?
- What's the average days-on-market for RENTAL listings here right now (not sales)? A rising rental-DOM trend means longer vacancies and softer asking-rent achievability than the comps imply.
- What's the recent tenant-quality profile in this submarket — average credit score on applications, eviction rate, late-payment / NSF rate, and stable-employment percentage? A property-management company in the area should have these aggregated.
- How much new for-sale + rental construction is in the pipeline within 1–3 miles? Heavy new supply typically softens prices + rents 12–24 months out; constrained supply supports both.
Investment metrics
- 1% rule
- 0.88% ✗
- Cap rate
- 7.06%
- Cash-on-cash
- 2.74%
- DSCR
- 1.12
- GRM
- 9.5
CMA / ARV
- ARV (on-the-fly)
- $186,714
- Comps found
- 12
Show comp detail 12 sales within ~0.75 mi
| Address | Dist | Beds/Ba | Sqft | Sold | Price | $/sf | Match |
|---|---|---|---|---|---|---|---|
| 1901 Richard Dr | 0.28mi | 3/2.0 (+1) | 1,468 (-3%) | 2mo | $200,000 | $136 | 75 |
| 1601 Bois D'arc Pl | 0.12mi | 3/2.0 (+1) | 1,636 (+8%) | 4mo | $160,000 | $98 | 72 |
| 2004 Oakmont St | 0.52mi | 2/2.0 | 1,484 (-2%) | 9mo | $207,000 | $139 | 65 |
| 1311 Spencer Ave | 0.42mi | 3/1.0 (+1) | 1,465 (-4%) | 2mo | $180,000 | $123 | 63 |
| 1604 Fairview Ave | 0.21mi | 2/2.0 | 1,722 (+13%) | 6mo | $295,000 | $171 | 62 |
| 1801 Milton St | 0.18mi | 3/2.0 (+1) | 1,661 (+9%) | 10mo | $220,000 | $132 | 62 |
| 1805 Townhouse Dr Unit A | 0.55mi | 2/2.0 | 1,468 (-3%) | 11mo | $163,000 | $111 | 60 |
| 1012 Emerson St | 0.53mi | 3/2.0 (+1) | 1,592 (+5%) | 8mo | $208,000 | $131 | 55 |
| 2007 Park Ave | 0.55mi | 3/1.5 (+1) | 1,624 (+7%) | 8mo | $147,500 | $91 | 49 |
| 1803 Townhouse Dr #4 | 0.56mi | 3/2.0 (+1) | 1,406 (-7%) | 12mo | $165,000 | $117 | 47 |
| 1916 Spencer Ave | 0.38mi | 3/2.0 (+1) | 1,718 (+13%) | 11mo | $165,000 | $96 | 46 |
| 1003 Emerson St | 0.60mi | 3/1.5 (+1) | 1,363 (-10%) | 12mo | $120,000 | $88 | 38 |
Match score weights: distance 35% · size 25% · config 20% · recency 20%. Top-matched comps best support the ARV.
Projected returns pro-forma
-3.0% appreciation · 3.0% rent growth · sell at horizon
- IRR
- -12.0%
- Equity multiple
- 0.57×
- Total profit
- $-24,205
- Equity at exit
- $29,672
- IRR
- -2.9%
- Equity multiple
- 0.81×
- Total profit
- $-10,861
- Equity at exit
- $17,206
Cash invested: $55,720 (down + closing). Projections, not guarantees.
Landlord ↔ Tenant lean methodology
- Overall (STATE)
- 90 Strongly Landlord-Friendly
- State Louisiana
- 90 Strongly Landlord-Friendly · R+12
- County
- — inherits STATE
- City
- — inherits STATE
ZIP-level market 71201
- Home prices YoY
- -31.9%
- Active inventory
- 142
- Price-to-rent
- 9.5×
Monthly cashflow live
- Estimated rent
- $1,745 medium interval (Pro) →
- Mortgage (P&I)
- −$1,044
- Tax from tax record
- −$125 /mo · $1,502/yr
- Insurance
- −$83
- HOA
- −$0
- Vacancy / Maint / Mgmt
- −$366
- Net cashflow
- $127
Break-even live
UW: 25.0% down · 7.5% · 30yr · 1.5% tax · 5.0% vac · 8.0% maint · 8.0% mgmt
Financing live
Cash to close
- Down payment
- $49,750
- Closing costs
- $5,970
- Reserves months
- —
- Total cash needed
- —
Loan-product check · same deal, 3 products live
Conventional
25% down · 7.5% · 30yr
- Down + closing
- —
- Monthly P&I
- —
- Monthly cashflow
- —
- DSCR
- —
- Eligible?
- —
Personal DTI + credit; lowest rate.
DSCR
20% down · 8.5% · 30yr
- Down + closing
- —
- Monthly P&I
- —
- Monthly cashflow
- —
- DSCR
- —
- Eligible?
- —
No personal income docs; deal must DSCR.
Hard money
10% down · 12.0% · 12mo
- Down + closing
- —
- Monthly P&I
- —
- Monthly cashflow
- —
- DSCR
- —
- Eligible?
- —
Short-term bridge; refi at stabilization.
Rent comps 2 comps
| Address | Beds | Baths | Sqft | Rent | $/sqft | DOM | Units | Dist |
|---|---|---|---|---|---|---|---|---|
| 1707 N 5th St Monroe, LA | 3.0 | 2.0 | 1694 | $3,500 | $2.07 | 21d | 1 | 1.11mi |
| 403 K St Monroe, LA | 3.0 | 2.0 | 1561 | $1,100 | $0.70 | 21d | 1 | 1.12mi |
Listing history 8 events
-
2026-05-23status Active
-
2026-05-06status Pending
-
2026-04-23status Active
-
2026-04-03status Pending
-
2026-03-31$199,000 Active
-
2025-05-13soldstatus $150,000
-
2014-12-03soldstatus $125,000
-
2012-07-20soldstatus $107,000
ⓘ Source: listings_history table (triggers on properties + properties_extension) + one-shot
backfill from property_details.listing_events for pre-trigger history.
Tax reassessment forecast LA · Resets to sale price
- Current annual tax
- $1,502 · $125/mo
- Projected year-2 tax
- $1,502 · $125/mo
- Expected delta
- $0/yr ($0/mo · 0.0%)
ⓘ Screening estimate from a state-policy table — verify with the county assessor before closing.
Climate risk First Street
- Flood 1/10 Low FEMA zone X (shaded) · 0% chance over 30 yrs
- Wildfire 1/10 Low
- Heat 7/10 Severe 7 d/yr ≥111°F today · 19 d/yr by 30 yrs out
- Wind 7/10 Severe 78% chance of damaging wind over 30 yrs
- Air quality 1/10 Low 0 unhealthy d/yr today · 0 by 30 yrs out
Nearby sold comps map
Loading sold comps map…
Walkable amenities ~0.75 mi
Loading nearby amenities…
Taxation est. · year 1
- Rental income
- $20,942
- − Mortgage interest
- −$11,147
- − Property taxes
- −$1,502
- − Insurance
- −$995
- − Repairs & maintenance
- −$1,675
- − Management
- −$1,675
- − Depreciation
- −$5,789
- Taxable loss
- −$1,842
- Est. tax savings @ 24.0%
- +$442
- After-tax cash flow
- $1,966/yr
For passive investors: Depreciation is non-cash, so a rental often shows a tax loss while cash-flowing — sheltering income. Rental losses are passive: they offset passive income freely, and up to $25,000/yr can offset ordinary (W-2) income if you actively participate and your MAGI is under $100k (phasing out to $0 by $150k); unused losses carry forward. On sale, claimed depreciation is recaptured at up to 25%, and gains may owe capital-gains tax (a 1031 exchange can defer both). Figures are a year-1 estimate at your 24.0% rate — not tax advice; consult a CPA.
Schools (NCES district)
- District
- City Of Monroe School District
- NCES district ID
- 2201080
- Math proficiency
- 21% ▼ -36.00%
- Reading proficiency
- 31% ▼ -34.00%
- Median HH income
- $28,751
- Composite
- 20.82/100
- National rank
- #8505
- State rank
- #60 of 98 in LA
Livability — Monroe
- Score
- 66/100
- State rank
- #128
- US rank
- #11948
Category grades
Schools grade is shown separately in the Schools card above.
Census & demographics
- Census place
- Monroe, LA
- County
- Ouachita Parish · 118,340 people
- City population
- 60,136
- Metro
- Monroe, LA
- Population (ZIP)
- 21,782
- Household income
- $65,446
- Rent vs Own
- Severe rent burden
- 1466.0
Population outlook (Ouachita County) Hauer SSP2
- Today (2025)
- 163,370 people
- By 2030
- 165,520 · +1.3%
- By 2040
- 167,652 · +2.6%
- By 2050
- 166,699 · +2.0%
- By 2075
- 156,348 · -4.3%
- By 2100
- 134,102 · -17.9%
Race, ethnicity, and origin ACS 2023
- Neighborhood character
- Diverse neighborhood (Simpson 0.55)
- Race & ethnicity
- White 57% Black 35% Two or more races 3% Hispanic / Latino 3% Asian 2%
- Common ancestry
- Lithuanian 3% Slovak 2% Italian 1%
- Foreign-born
- 3% · Vietnam
- Languages at home
- 95% English-only · Spanish 3% Other Indo-European 1% Arabic 1%
Political lean MEDSL · Ouachita
- 2024 margin
- Strong R (+27.9) · D 35.5% · R 63.3% · Other 1.2%
- 2008→2024 swing
- -2.7pp toward R · 2008: -25.2pp · 2024: -27.9pp
- All cycles
- 2024: R+27.9 2020: R+23.6 2016: R+25.4 2012: R+20.9 2008: R+25.2
Not yet ingested
- Civics
- —
Market trends
- HPI YoY
- ▼ -92.35%
- Current HPI
- 196.7468
- Rent YoY
- —
- Metro
- Monroe, LA
- State GDP YoY
- ▲ 3.29%
- F500 in state
- 10
Industry mix (Fortune 500 HQ in LA)
| Industry | F500 HQs | Revenue |
|---|---|---|
| Telecommunications | 2 | $23B |
|
||
| Utilities | 1 | $12B |
|
||
| Wholesale / Distribution | 1 | $5B |
|
||
| Advertising | 1 | $2B |
|
||
Price history
+86.0% since first listed8 events — show timeline
- 2026-05-23 Relisted — NELABOR
- 2026-05-06 Pending — NELABOR
- 2026-04-23 Relisted — NELABOR
- 2026-04-03 Pending — NELABOR
- 2026-03-31 Listed $199,000 NELABOR
- 2025-05-13 Sold (Public Records) $150,000 Public Records
- 2014-12-03 Sold (Public Records) $125,000 Public Records
- 2012-07-20 Sold (Public Records) $107,000 Public Records
Property tax history
+2.2%/yrLatest (2025): $1,502 · -0.1% YoY. Source: county tax records.
Cash-flow waterfall
monthlySold comps — $/sqft
last 12 mo · ≤1 miLoading sold comps…