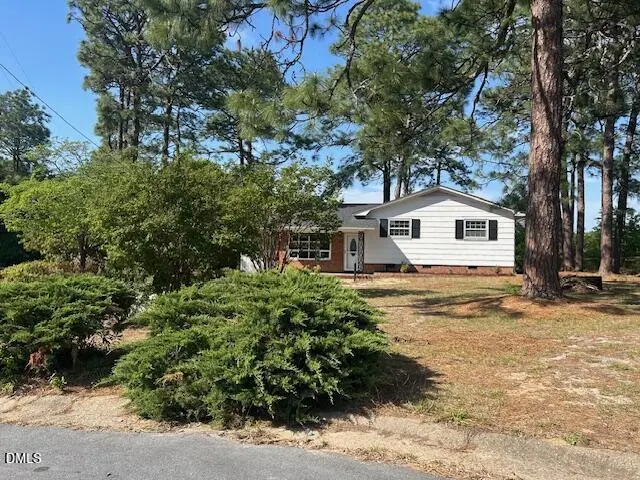
830 Dinmont Cir · Fayetteville, NC
Flood risk 1/10 · Minimal
- FEMA flood zone
- X (unshaded)
- Chance of flooding over 30 yrs
- 0.0%
- Est. flood insurance / yr
- $507 – $1,088
Fire risk 5/10 · Moderate
- Est. fire insurance / yr
- $906 – $1,684
Heat risk 7/10 · Major
- Hot days now (above 106°F)
- 7 days/yr
- Hot days in 30 yrs
- 16 days/yr
Wind risk 7/10 · Major
- Chance of severe wind over 30 yrs
- 78.0%
Air-quality risk 1/10 · Minimal
- Unhealthy air days now
- 0 days/yr
- Unhealthy air days in 30 yrs
- 0 days/yr
Risk factors via First Street. Map © Google.
Why this score? — see what drove the D+ grade
The composite is a weighted blend of 9 inputs, each scored 0–100. Each bar is that input's sub-score; the figure is the points it added to the 100-point composite (weight × sub-score).
- ARV discount +14.8/15.0
- Cash flow +13.7/30.0
- DSCR +4.2/10.0
- Livability +3.8/5.0
- 1% rule +3.3/10.0
- Schools +3.1/10.0
- Rent growth +2.7/5.0
- Condition / age +2.5/5.0
- Appreciation +0.0/10.0
$220,000
🖨 Deal sheet 📄 Offer letter ✓ Due diligence
Listing remarks MLS
3 bed, 1.5 bath home. Single attached carport. Storage in backyard. Train directly behind property.
Key facts
- 0.42 acre lot
- Recently renovated
- 0.42 acre lot
Tags
Property features AI
Finance
- Other: Lot size approximately 0.42 acres; Zoning: SF6; Road frontage: city street (asphalt), publicly maintained; No horse facilities
- HOA & community: No association
Exterior
- Parking: 1-car carport; 2 open parking spaces (3 total parking spaces)
- Utilities: Public water; Public sewer; Electricity connected; Cable available; Sewer connected; Water connected
- Home design: Ranch-style house; One level; Faces southwest
- Construction: Board & batten siding; Brick veneer; Architectural shingle roof; Slab and stone foundation; Built as a Brick Ranch (structure type: house)
- Exterior features: Fenced backyard; Shed(s) on the property
Interior
- Kitchen: Electric oven; Microwave; Refrigerator; Ice maker; Electric water heater
- Bedrooms: 3 bedrooms (all on the main level)
- Flooring: Carpet; Hardwood; Laminate
- Bathrooms: 1 full bathroom; 1 half bathroom
- Heating & cooling: Electric heating with heat pump; Central air; Whole-house fan
- Interior features: Bay window(s); Storm door(s); Wood-burning fireplace in the family room; Updated / remodeled condition
- Laundry & utility: Washer hookup; Laundry area located in a bathroom
Neighborhood map
What this means for you Summary
Snapshot
- This is a 3-bed/2.0-bath single-family listed at $220k.
Deal economics
- At list price, monthly cash flow is $17 ($209/yr) — positive.
- The deal already cash-flows at list — no discount required.
- To meet the 1% rule (rent ≥ 1% of price), the offer needs to be $183k (16.7% below list).
- Recommended offer: $183k (16.7% below list) — sets the bar for 1% rule.
- Cap rate 6.4% vs local median 4.9% in Fayetteville — top-decile yield for the area; either an underpriced asset or a hidden risk that comps aren't pricing in. Stress-test before assuming the spread holds.
Location & tenants
- Location reads 75/100 on livability (#45 in NC, #4,031 nationally) — a middle-class / working-renter tenant base. Strengths: commute A+, cost of living A+, housing A+; Watch: crime F, employment D-.
- Cumberland County Schools (urban): math 32% / reading 41% proficiency, ranked #126 of 178 in NC (top 71%) — families likely to look elsewhere, expect single-tenant / working-renter base with shorter leases.
- Zoned schools: Douglas Byrd Middle (math 13% / reading 30%, grade F, #422 of 475 statewide, top 89%, 935 students, 100% FRL); Douglas Byrd High (math 22% / reading 42%, grade F, #445 of 535 statewide, top 84%, 940 students, 99% FRL) — zoned schools average 99% FRL vs 55% district-wide (45 pts higher); higher-poverty schools than district average — tighter screening recommended.
- Market conditions: Rents flat; 401 active listings in the ZIP; 20 comparable units currently listed for rent nearby; rentals at typical pace (median 23d on market — plan ~3-4 weeks tenant-placement turnaround); 1,125 units permitted in Cumberland County in 2024 (104 in 5+ unit buildings).
- This rent runs 33% of the median local income ($68k/yr) — at the standard rent-burdened threshold; future hikes will face affordability resistance.
Forward outlook
- Local home prices are declining (-3.0%/yr); year-one equity from $2k of loan paydown is wiped out by about $7k of value loss. Plan a longer hold.
Negotiation context
- It's been on market 77 days — a 6% lower offer ($207k) is reasonable based on typical stale-listing flexibility.
- 3 sale attempts; this cycle's ask is 14567% above the opening price — seller raised mid-cycle; expect resistance to lowballs.
- Current owner paid $125k; list at $220k implies a 76% gain — meaningful room to come down on a strong offer.
Risks & watch-outs
- Climate carrying-cost: major wind risk, 78% chance of damaging wind over 30y; moderate wildfire risk; extreme-heat days projected 7→16/yr by 2055 (HVAC capex compounding) — expect insurance premiums to compound above CPI over the hold.
Questions for the listing agent
- It's been on market 77 days. Have you received any prior offers? Is the seller open to a 17% concession, seller financing, or rate buy-down credit?
- Built in 1965 — when were the roof, HVAC, electrical panel, plumbing, and water heater last replaced?
- Why hasn't it sold? Are there any deal-killer items the seller is aware of (foundation, flood, title, zoning, code violations)?
- Is there a deadline driving the sale (1031 exchange, divorce, estate, relocation)? That informs how much negotiation room exists.
- Crime grade is F in this area — have there been break-ins, vandalism, or insurance claims at this property in the last 3 years? What carrier currently insures it and at what premium?
- The area grade is low — what's the realistic commute time and amenity access for the typical tenant pool here? Any planned neighborhood developments (good or bad) we should know about?
- What's the average days-on-market for RENTAL listings here right now (not sales)? A rising rental-DOM trend means longer vacancies and softer asking-rent achievability than the comps imply.
- What's the recent tenant-quality profile in this submarket — average credit score on applications, eviction rate, late-payment / NSF rate, and stable-employment percentage? A property-management company in the area should have these aggregated.
- How much new for-sale + rental construction is in the pipeline within 1–3 miles? Heavy new supply typically softens prices + rents 12–24 months out; constrained supply supports both.
Investment metrics
- 1% rule
- 0.83% ✗
- Cap rate
- 6.39%
- Cash-on-cash
- 0.34%
- DSCR
- 1.02
- GRM
- 10.0
CMA / ARV
- ARV (on-the-fly)
- $262,724
- Comps found
- 12
Show comp detail 12 sales within ~0.75 mi
| Address | Dist | Beds/Ba | Sqft | Sold | Price | $/sf | Match |
|---|---|---|---|---|---|---|---|
| 2228 Lakedale Dr | 0.18mi | 3/2.0 | 1,749 (+2%) | 8mo | $278,500 | $159 | 80 |
| 1242 Brickyard Dr | 0.06mi | 3/2.0 | 1,573 (-8%) | 5mo | $265,000 | $168 | 80 |
| 1202 Brickyard Dr | 0.18mi | 3/2.5 | 1,834 (+8%) | 9mo | $312,000 | $170 | 69 |
| 2515 Fordham Dr | 0.46mi | 4/2.0 (+1) | 1,820 (+7%) | 4mo | $281,000 | $154 | 59 |
| 1607 Stonewood Dr | 0.70mi | 4/2.0 (+1) | 1,744 (+2%) | 4mo | $264,000 | $151 | 56 |
| 1828 Notre Dame Pl | 0.63mi | 3/2.0 | 1,612 (-6%) | 8mo | $248,000 | $154 | 55 |
| 2109 Stonewash Dr | 0.33mi | 3/2.5 | 1,914 (+12%) | 9mo | $295,000 | $154 | 55 |
| 2635 Torcross Dr | 0.71mi | 3/2.0 | 1,760 (+3%) | 8mo | $260,000 | $148 | 55 |
| 1712 Yonkers Ct | 0.65mi | 3/2.0 | 1,902 (+12%) | 9mo | $284,000 | $149 | 43 |
| 2630 Dartmouth Dr | 0.67mi | 3/2.0 | 1,912 (+12%) | 10mo | $275,000 | $144 | 40 |
| 1516 Timberrock Ct | 0.71mi | 4/2.5 (+1) | 1,859 (+9%) | 5mo | $215,000 | $116 | 40 |
| 2129 Rolling Hill Rd | 0.75mi | 4/3.0 (+1) | 1,930 (+13%) | 10mo | $275,000 | $142 | 26 |
Match score weights: distance 35% · size 25% · config 20% · recency 20%. Top-matched comps best support the ARV.
Projected returns pro-forma
-3.0% appreciation · 0.9% rent growth · sell at horizon
- IRR
- -18.0%
- Equity multiple
- 0.38×
- Total profit
- $-38,358
- Equity at exit
- $32,803
- IRR
- -14.6%
- Equity multiple
- 0.24×
- Total profit
- $-47,004
- Equity at exit
- $19,022
Cash invested: $61,600 (down + closing). Projections, not guarantees.
Landlord ↔ Tenant lean methodology
- Overall (STATE)
- 85 Strongly Landlord-Friendly
- State North Carolina
- 85 Strongly Landlord-Friendly · R+3
- County
- — inherits STATE
- City
- — inherits STATE
ZIP-level market 28306
- Home prices YoY
- -17.7%
- Rents YoY
- 0.9%
- Active inventory
- 401
- Price-to-rent
- 10.0×
Monthly cashflow live
- Estimated rent
- $1,832 high interval (Pro) →
- Mortgage (P&I)
- −$1,154
- Tax from tax record
- −$185 /mo · $2,218/yr
- Insurance
- −$92
- HOA
- −$0
- Vacancy / Maint / Mgmt
- −$385
- Net cashflow
- $17
Break-even live
UW: 25.0% down · 7.5% · 30yr · 1.5% tax · 5.0% vac · 8.0% maint · 8.0% mgmt
Financing live
Cash to close
- Down payment
- $55,000
- Closing costs
- $6,600
- Reserves months
- —
- Total cash needed
- —
Loan-product check · same deal, 3 products live
Conventional
25% down · 7.5% · 30yr
- Down + closing
- —
- Monthly P&I
- —
- Monthly cashflow
- —
- DSCR
- —
- Eligible?
- —
Personal DTI + credit; lowest rate.
DSCR
20% down · 8.5% · 30yr
- Down + closing
- —
- Monthly P&I
- —
- Monthly cashflow
- —
- DSCR
- —
- Eligible?
- —
No personal income docs; deal must DSCR.
Hard money
10% down · 12.0% · 12mo
- Down + closing
- —
- Monthly P&I
- —
- Monthly cashflow
- —
- DSCR
- —
- Eligible?
- —
Short-term bridge; refi at stabilization.
Rent comps 20 comps
| Address | Beds | Baths | Sqft | Rent | $/sqft | DOM | Units | Dist |
|---|---|---|---|---|---|---|---|---|
| 2516 Cumberland Rd Fayetteville, NC | 3.0 | 2.0 | 1442 | $1,500 | $1.04 | 23d | 1 | 0.33mi |
| 516 Loom Dr Fayetteville, NC | 3.0 | 2.5 | 2168 | $2,200 | $1.01 | 23d | 1 | 0.35mi |
| 2346 Spinning Wheel Rd Fayetteville, NC | 4.0 | 2.5 | 1877 | $2,050 | $1.09 | 23d | 1 | 0.38mi |
| 2123 Burnett Ave Fayetteville, NC | 3.0 | 2.0 | 1100 | $1,600 | $1.45 | 23d | 1 | 0.42mi |
| 2610 Trenton Rd Fayetteville, NC | 3.0 | 2.0 | 1762 | $2,000 | $1.14 | 13d | 1 | 0.66mi |
| 2026 Progress St Fayetteville, NC | 3.0 | 2.5 | 1500 | $1,600 | $1.07 | 13d | 1 | 0.67mi |
| 707 Veda St Unit B Fayetteville, NC | 3.0 | 1.5 | 1279 | $1,250 | $0.98 | 23d | 1 | 0.76mi |
| 1813 Stetson Ln Fayetteville, NC | 3.0 | 2.0 | 1730 | $2,095 | $1.21 | 13d | 1 | 0.81mi |
| 522 Jernigan St Fayetteville, NC | 3.0 | 2.5 | 1406 | $1,650 | $1.17 | 23d | 1 | 0.83mi |
| 2937 Delaware Dr Fayetteville, NC | 4.0 | 2.5 | 2149 | $1,995 | $0.93 | 13d | 1 | 0.85mi |
| 3120 Phillies Cir Fayetteville, NC | 3.0 | 1.5 | 1418 | $1,650 | $1.16 | 21d | 1 | 0.91mi |
| 1319 Levy Dr Fayetteville, NC | 3.0 | 2.0 | 1428 | $1,700 | $1.19 | 13d | 1 | 0.96mi |
| 2253 Rustic Trl Fayetteville, NC | 3.0 | 2.5 | 1130 | $1,295 | $1.15 | 13d | 1 | 1.01mi |
| 3325 Boone Trl Fayetteville, NC | 4.0 | 2.0 | 1494 | $1,960 | $1.31 | 13d | 1 | 1.17mi |
| 1137 Meadow Creek Rd Fayetteville, NC | 3.0 | 2.0 | 1403 | $2,000 | $1.43 | 23d | 1 | 1.20mi |
| 2809 Trentwood Ct Fayetteville, NC | 3.0 | 2.0 | 1550 | $1,595 | $1.03 | 23d | 1 | 1.26mi |
| 1401 Habersham Dr Fayetteville, NC | 3.0 | 2.0 | 1250 | $1,700 | $1.36 | 23d | 1 | 1.37mi |
| 405 Grand Wailea Dr Hope Mills, NC | 1.0–3.0 | 1.0–2.0 | 1061 | $1,656 | $1.56 | 23d | 9 | 1.40mi |
| 2808 Player Ave Fayetteville, NC | 3.0 | 2.0 | 1546 | $1,600 | $1.03 | 23d | 1 | 1.42mi |
| 935 Fleetwood Dr Unit A Fayetteville, NC | 3.0 | 2.5 | 1600 | $1,650 | $1.03 | 23d | 1 | 1.48mi |
Listing history 29 events
-
2026-06-18days on market $220,000 Active 77 DOM
-
2026-06-17days on market $220,000 Active 76 DOM
-
2026-06-16days on market $220,000 Active 75 DOM
-
2026-06-15days on market $220,000 Active 74 DOM
-
2026-06-14days on market $220,000 Active 72 DOM
-
2026-06-13days on market $220,000 Active 71 DOM
-
2026-06-10days on market $220,000 Active 69 DOM
-
2026-06-09days on market $220,000 Active 68 DOM
-
2026-06-08days on market $220,000 Active 67 DOM
-
2026-06-07days on market $220,000 Active 66 DOM
-
2026-06-03days on market $220,000 Active 62 DOM
-
2026-06-02days on market $220,000 Active 61 DOM
-
2026-06-01days on market $220,000 Active 60 DOM
-
2026-05-31days on market $220,000 Active 59 DOM
-
2026-05-30days on market $220,000 Active 58 DOM
-
2026-05-20$1,500
-
2026-05-19price $220,000
-
2026-04-02$199,000 Active
-
2026-01-16soldstatus $125,001 Closed 99-char remark
Show marketing remark (99 chars)
3 bed, 1.5 bath home. Single attached carport. Storage in backyard. Train directly behind property.
-
2025-12-19status Pending 99-char remark
Show marketing remark (99 chars)
3 bed, 1.5 bath home. Single attached carport. Storage in backyard. Train directly behind property.
-
2025-12-05price $125,000 99-char remark
Show marketing remark (99 chars)
3 bed, 1.5 bath home. Single attached carport. Storage in backyard. Train directly behind property.
-
2025-11-17price $131,900 99-char remark
Show marketing remark (99 chars)
3 bed, 1.5 bath home. Single attached carport. Storage in backyard. Train directly behind property.
-
2025-09-30price $138,900 99-char remark
Show marketing remark (99 chars)
3 bed, 1.5 bath home. Single attached carport. Storage in backyard. Train directly behind property.
-
2025-08-29price $145,900 99-char remark
Show marketing remark (99 chars)
3 bed, 1.5 bath home. Single attached carport. Storage in backyard. Train directly behind property.
-
2025-07-30price $153,500 99-char remark
Show marketing remark (99 chars)
3 bed, 1.5 bath home. Single attached carport. Storage in backyard. Train directly behind property.
-
2025-06-10price $161,500 99-char remark
Show marketing remark (99 chars)
3 bed, 1.5 bath home. Single attached carport. Storage in backyard. Train directly behind property.
-
2025-05-09price $170,000 99-char remark
Show marketing remark (99 chars)
3 bed, 1.5 bath home. Single attached carport. Storage in backyard. Train directly behind property.
-
2025-04-07price $179,000 99-char remark
Show marketing remark (99 chars)
3 bed, 1.5 bath home. Single attached carport. Storage in backyard. Train directly behind property.
-
2025-03-06$187,950 Active 99-char remark
Show marketing remark (99 chars)
3 bed, 1.5 bath home. Single attached carport. Storage in backyard. Train directly behind property.
ⓘ Source: listings_history table (triggers on properties + properties_extension) + one-shot
backfill from property_details.listing_events for pre-trigger history.
Tax reassessment forecast NC · Resets to sale price
- Current annual tax
- $2,218 · $185/mo
- Projected year-2 tax
- $2,218 · $185/mo
- Expected delta
- $0/yr ($0/mo · 0.0%)
ⓘ Screening estimate from a state-policy table — verify with the county assessor before closing.
Climate risk First Street
- Flood 1/10 Low FEMA zone X (unshaded) · 0% chance over 30 yrs
- Wildfire 5/10 Major
- Heat 7/10 Severe 7 d/yr ≥106°F today · 16 d/yr by 30 yrs out
- Wind 7/10 Severe 78% chance of damaging wind over 30 yrs
- Air quality 1/10 Low 0 unhealthy d/yr today · 0 by 30 yrs out
Nearby sold comps map
Loading sold comps map…
Walkable amenities ~0.75 mi
Loading nearby amenities…
Taxation est. · year 1
- Rental income
- $21,990
- − Mortgage interest
- −$12,323
- − Property taxes
- −$2,218
- − Insurance
- −$1,100
- − Repairs & maintenance
- −$1,759
- − Management
- −$1,759
- − Depreciation
- −$6,400
- Taxable loss
- −$3,570
- Est. tax savings @ 24.0%
- +$857
- After-tax cash flow
- $1,066/yr
For passive investors: Depreciation is non-cash, so a rental often shows a tax loss while cash-flowing — sheltering income. Rental losses are passive: they offset passive income freely, and up to $25,000/yr can offset ordinary (W-2) income if you actively participate and your MAGI is under $100k (phasing out to $0 by $150k); unused losses carry forward. On sale, claimed depreciation is recaptured at up to 25%, and gains may owe capital-gains tax (a 1031 exchange can defer both). Figures are a year-1 estimate at your 24.0% rate — not tax advice; consult a CPA.
Schools (NCES district)
- District
- Cumberland County Schools
- NCES district ID
- 3700011
- Math proficiency
- 32% ▼ -2.00%
- Reading proficiency
- 41% ▼ -1.00%
- Median HH income
- $44,168
- Composite
- 31.0/100
- National rank
- #6096
- State rank
- #126 of 178 in NC
Livability — Fayetteville
- Score
- 75/100
- State rank
- #45
- US rank
- #4031
Category grades
Schools grade is shown separately in the Schools card above.
Census & demographics
- Census place
- Fayetteville, NC
- County
- Cumberland County · 265,314 people
- City population
- 226,118
- Metro
- Fayetteville, NC
- Population (ZIP)
- 43,042
- Household income
- $67,544
- Rent vs Own
- Severe rent burden
- 1386.0
Population outlook (Cumberland County) Hauer SSP2
- Today (2025)
- 330,855 people
- By 2030
- 333,523 · +0.8%
- By 2040
- 335,583 · +1.4%
- By 2050
- 335,325 · +1.4%
- By 2075
- 342,853 · +3.6%
- By 2100
- 340,698 · +3.0%
Race, ethnicity, and origin ACS 2023
- Neighborhood character
- Diverse neighborhood (Simpson 0.68)
- Race & ethnicity
- White 44% Black 33% Hispanic / Latino 13% Two or more races 8% Asian 4% Native American 2%
- Hispanic origin (detail)
- Mexican 5% Puerto Rican 5%
- Common ancestry
- Italian 2% Slovak 1% Serbian 1%
- Foreign-born
- 8% · Canada, South Korea, Jamaica
- Languages at home
- 87% English-only · Spanish 9% Other Indo-European 1% French/Haitian/Cajun 1%
Political lean MEDSL · Cumberland
- 2024 margin
- D (+13.4) · D 56.1% · R 42.7% · Other 1.2%
- 2008→2024 swing
- -4.3pp toward R · 2008: 17.7pp · 2024: 13.4pp
- All cycles
- 2024: D+13.4 2020: D+16.6 2016: D+16.0 2012: D+19.7 2008: D+17.7
Not yet ingested
- Civics
- —
Market trends
- HPI YoY
- ▼ -51.69%
- Current HPI
- 239.7281
- Rent YoY
- ▲ 0.90%
- Metro
- Fayetteville, NC
- State GDP YoY
- ▲ 3.28%
- F500 in state
- 26
Industry mix (Fortune 500 HQ in NC)
| Industry | F500 HQs | Revenue |
|---|---|---|
| Financial Services | 2 | $213B |
|
||
| Retail | 2 | $95B |
|
||
| Industrial Conglomerate | 1 | $38B |
|
||
| Metals / Steel | 1 | $35B |
|
||
| Utilities | 1 | $30B |
|
||
| Industrial Machinery | 1 | $19B |
|
||
Price history
-99.2% since first listed14 events — show timeline
- 2026-05-20 Listed for Rent $1,500 TMLS
- 2026-05-19 Price Changed $220,000 TMLS
- 2026-04-02 Listed $199,000 TMLS
- 2026-01-16 Sold (MLS) $125,001 LPRMLS
- 2025-12-19 Pending — LPRMLS
- 2025-12-05 Price Changed $125,000 LPRMLS
- 2025-11-17 Price Changed $131,900 LPRMLS
- 2025-09-30 Price Changed $138,900 LPRMLS
- 2025-08-29 Price Changed $145,900 LPRMLS
- 2025-07-30 Price Changed $153,500 LPRMLS
- 2025-06-10 Price Changed $161,500 LPRMLS
- 2025-05-09 Price Changed $170,000 LPRMLS
- 2025-04-07 Price Changed $179,000 LPRMLS
- 2025-03-06 Listed $187,950 LPRMLS
Property tax history
+4.1%/yrLatest (2025): $2,218 · +17.1% YoY. Source: county tax records.
Cash-flow waterfall
monthlySold comps — $/sqft
last 12 mo · ≤1 miLoading sold comps…