 Multi-family
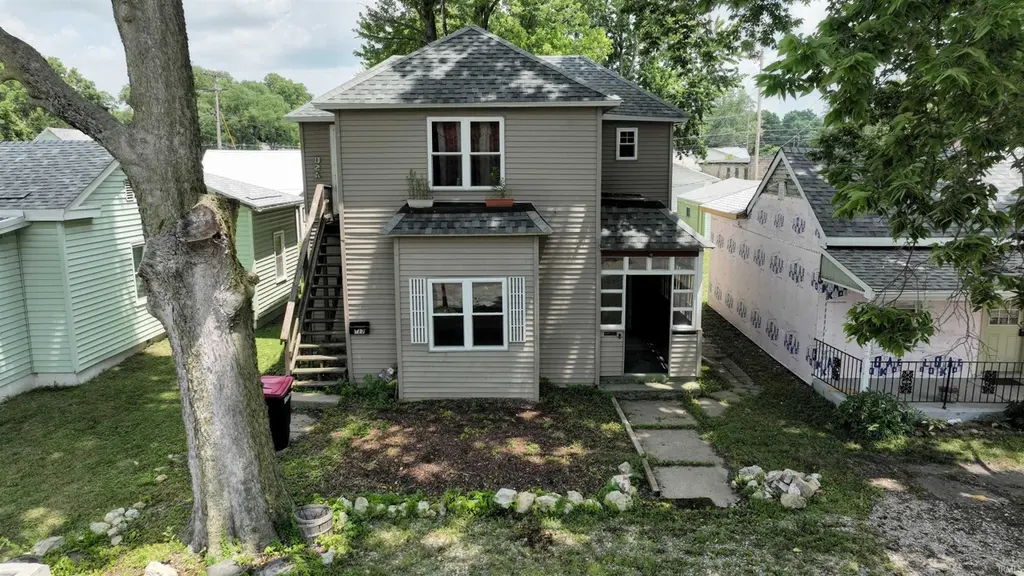
317 N Market St · Delphi, IN
Flood risk 1/10 · Minimal
- FEMA flood zone
- X (unshaded)
- Chance of flooding over 30 yrs
- 0.0%
- Est. flood insurance / yr
- $507 – $1,088
Fire risk 1/10 · Minimal
- Est. fire insurance / yr
- $717 – $1,331
Heat risk 3/10 · Minor
- Hot days now (above 102°F)
- 7 days/yr
- Hot days in 30 yrs
- 17 days/yr
Wind risk 2/10 · Minimal
- Chance of severe wind over 30 yrs
- —
Air-quality risk 2/10 · Minimal
- Unhealthy air days now
- 1 days/yr
- Unhealthy air days in 30 yrs
- 2 days/yr
Risk factors via First Street. Map © Google.
Why this score? — see what drove the B- grade
The composite is a weighted blend of 9 inputs, each scored 0–100. Each bar is that input's sub-score; the figure is the points it added to the 100-point composite (weight × sub-score).
- Cash flow +26.5/30.0
- ARV discount +15.0/15.0
- DSCR +9.0/10.0
- 1% rule +6.7/10.0
- Livability +3.6/5.0
- Schools +3.3/10.0
- Rent growth +2.5/5.0
- Condition / age +2.5/5.0
- Appreciation +0.0/10.0
$179,900
🖨 Deal sheet 📄 Offer letter ✓ Due diligence
Multi-family units
County records classify this as Multi-Family (2-4 Unit). Listing-text estimate: 1 unit. estimate disagrees with records
Listing remarks MLS
Welcome to your next investment opportunity. Seller has made some repairs, but will not finish what is missing. The Property is being sold as is. This large 2 story 3 separate apartments. Located in town and close to amenities. Main unit offers 2 Bed 1 Bath living area and laundry hookup. Unit A offers 2 Bed 1 Bath unit B offers 1 Bed 1 Bath.
Key facts
- 4,840 sq ft lot
- Garage
- Built 1971
Neighborhood map
What this means for you Summary
Snapshot
- This is a 5-bed/3.0-bath multifamily listed at $180k.
Deal economics
- At list price, monthly cash flow is $474 ($6k/yr) — positive.
- The deal already cash-flows at list — no discount required.
- Meets the 1% rule at list price ($2k rent vs $180k).
- Recommended offer: $158k (12.0% below list) — sets the bar for market timing.
- Cap rate 9.5% vs local median 5.2% in Delphi — top-decile yield for the area; either an underpriced asset or a hidden risk that comps aren't pricing in. Stress-test before assuming the spread holds.
Location & tenants
- Location reads 72/100 on livability (#112 in IN) — a middle-class / working-renter tenant base. Strengths: crime A+, cost of living A+, housing A+; Watch: schools D+, employment D+, amenities F.
- Delphi Community School Corporation (town): math 36% / reading 41% proficiency, ranked #160 of 301 in IN (top 53%) — families likely to look elsewhere, expect single-tenant / working-renter base with shorter leases.
- Market conditions: 45 active listings in the ZIP; 2 comparable units currently listed for rent nearby; 32 units permitted in Carroll County in 2024 (0 in 5+ unit buildings).
Forward outlook
- Local home prices are declining (-3.0%/yr); year-one equity from $1k of loan paydown is wiped out by about $5k of value loss. Plan a longer hold.
- Carroll County population projected at -14% by 2050 — secular population decline; favor cash flow + early exit over multi-decade hold.
- At projected returns (-3.0% appreciation + 3.0% rent growth), your $50k cash investment doubles in ~10 years — after that, you're playing with house money.
Negotiation context
- It's been on market 339 days — a 12% lower offer ($158k) is reasonable based on typical stale-listing flexibility.
- 2 sale attempts with the ask held roughly flat each time — persistent listings suggest the price (not the market) is what's stuck; bring a comps-based counter.
- Current owner paid $38k; list at $180k implies a 373% gain — meaningful room to come down on a strong offer.
Questions for the listing agent
- It's been on market 339 days. Have you received any prior offers? Is the seller open to a 12% concession, seller financing, or rate buy-down credit?
- Built in 1971 — when were the roof, HVAC, electrical panel, plumbing, and water heater last replaced?
- Why hasn't it sold? Are there any deal-killer items the seller is aware of (foundation, flood, title, zoning, code violations)?
- Is there a deadline driving the sale (1031 exchange, divorce, estate, relocation)? That informs how much negotiation room exists.
- Schools are D-rated, which usually means shorter tenancies and higher turnover. Who's the typical renter profile here, and what's been the actual vacancy rate?
- What's the average days-on-market for RENTAL listings here right now (not sales)? A rising rental-DOM trend means longer vacancies and softer asking-rent achievability than the comps imply.
- What's the recent tenant-quality profile in this submarket — average credit score on applications, eviction rate, late-payment / NSF rate, and stable-employment percentage? A property-management company in the area should have these aggregated.
- How much new apartment / multifamily construction is in the pipeline within 1–3 miles? Heavy new supply (>2% of stock underway) typically softens rents 12–24 months out; light construction supports rent growth.
Investment metrics
- 1% rule
- 1.17% ✓
- Cap rate
- 9.45%
- Cash-on-cash
- 11.28%
- DSCR
- 1.50
- GRM
- 7.1
CMA / ARV
- ARV (median comp)
- $230,150
- List price
- $179,900
- Delta
- -21.83%
- Verdict
- UNDERPRICED
- Comps
- 3 within 2.0 mi
Show comp detail 1 sale within ~0.75 mi
| Address | Dist | Beds/Ba | Sqft | Sold | Price | $/sf | Match |
|---|---|---|---|---|---|---|---|
| 409 Franklin St | 0.31mi | 6/3.0 (+1) | 1,932 (-1%) | 2mo | $230,150 | $119 | 78 |
Match score weights: distance 35% · size 25% · config 20% · recency 20%. Top-matched comps best support the ARV.
Projected returns pro-forma
-3.0% appreciation · 3.0% rent growth · sell at horizon
- IRR
- 0.5%
- Equity multiple
- 1.02×
- Total profit
- $1,006
- Equity at exit
- $26,824
- IRR
- 10.2%
- Equity multiple
- 1.79×
- Total profit
- $39,694
- Equity at exit
- $15,554
Cash invested: $50,372 (down + closing). Projections, not guarantees.
Landlord ↔ Tenant lean methodology
- Overall (STATE)
- 90 Strongly Landlord-Friendly
- State Indiana
- 90 Strongly Landlord-Friendly · R+11
- County
- — inherits STATE
- City
- — inherits STATE
ZIP-level market 46923
- Home prices YoY
- -10.5%
- Active inventory
- 45
- Price-to-rent
- 21.4×
Monthly cashflow live
- Estimated rent
- $2,097 medium interval (Pro) →
- Mortgage (P&I)
- −$943
- Tax from tax record
- −$165 /mo · $1,976/yr
- Insurance
- −$75
- HOA
- −$0
- Vacancy / Maint / Mgmt
- −$440
- Net cashflow
- $474
Break-even live
3-unit breakdown (identical units grouped — click to expand)
| Units | Beds | Baths | Est. rent |
|---|---|---|---|
| 2× units | 2 | 1 | $1,398 |
| #1 | 2 | 1 | $699 |
| #2 | 2 | 1 | $699 |
| 1× unit | 1 | 1 | $699 |
| Total (3 units) | $2,097 | ||
UW: 25.0% down · 7.5% · 30yr · 1.5% tax · 5.0% vac · 8.0% maint · 8.0% mgmt
Financing live
Cash to close
- Down payment
- $44,975
- Closing costs
- $5,397
- Reserves months
- —
- Total cash needed
- —
Loan-product check · same deal, 3 products live
Conventional
25% down · 7.5% · 30yr
- Down + closing
- —
- Monthly P&I
- —
- Monthly cashflow
- —
- DSCR
- —
- Eligible?
- —
Personal DTI + credit; lowest rate.
DSCR
20% down · 8.5% · 30yr
- Down + closing
- —
- Monthly P&I
- —
- Monthly cashflow
- —
- DSCR
- —
- Eligible?
- —
No personal income docs; deal must DSCR.
Hard money
10% down · 12.0% · 12mo
- Down + closing
- —
- Monthly P&I
- —
- Monthly cashflow
- —
- DSCR
- —
- Eligible?
- —
Short-term bridge; refi at stabilization.
Rent comps 2 comps
| Address | Beds | Baths | Sqft | Rent | $/sqft | DOM | Units | Dist |
|---|---|---|---|---|---|---|---|---|
| 126 E North St Delphi, IN | 4.0 | 3.0 | 2100 | $2,250 | $1.07 | 13d | 1 | 0.59mi |
| 921 S Washington St Delphi, IN | 4.0 | 1.0 | 2244 | $1,650 | $0.74 | 43d | 1 | 0.71mi |
Listing history 21 events
-
2026-06-19days on market $179,900 Active 339 DOM
-
2026-06-18days on market $179,900 Active 338 DOM
-
2026-06-17days on market $179,900 Active 337 DOM
-
2026-06-16days on market $179,900 Active 336 DOM
-
2026-06-15days on market $179,900 Active 335 DOM
-
2026-06-14days on market $179,900 Active 333 DOM
-
2026-06-13days on market $179,900 Active 332 DOM
-
2026-06-10days on market $179,900 Active 330 DOM
-
2026-06-09days on market $179,900 Active 329 DOM
-
2026-06-08days on market $179,900 Active 328 DOM
-
2026-06-07days on market $179,900 Active 327 DOM
-
2026-06-05days on market $179,900 Active 324 DOM
-
2026-06-03days on market $179,900 Active 323 DOM
-
2026-06-02days on market $179,900 Active 322 DOM
-
2026-06-01days on market $179,900 Active 321 DOM
-
2026-05-31days on market $179,900 Active 320 DOM
-
2026-05-30days on market $179,900 Active 319 DOM
-
2025-08-16status Active 344-char remark
Show marketing remark (344 chars)
Welcome to your next investment opportunity. Seller has made some repairs, but will not finish what is missing. The Property is being sold as is. This large 2 story 3 separate apartments. Located in town and close to amenities. Main unit offers 2 Bed 1 Bath living area and laundry hookup. Unit A offers 2 Bed 1 Bath unit B offers 1 Bed 1 Bath.
-
2025-07-26historical Active Under Contract 344-char remark
Show marketing remark (344 chars)
Welcome to your next investment opportunity. Seller has made some repairs, but will not finish what is missing. The Property is being sold as is. This large 2 story 3 separate apartments. Located in town and close to amenities. Main unit offers 2 Bed 1 Bath living area and laundry hookup. Unit A offers 2 Bed 1 Bath unit B offers 1 Bed 1 Bath.
-
2025-07-16$179,900 Active 344-char remark
Show marketing remark (344 chars)
Welcome to your next investment opportunity. Seller has made some repairs, but will not finish what is missing. The Property is being sold as is. This large 2 story 3 separate apartments. Located in town and close to amenities. Main unit offers 2 Bed 1 Bath living area and laundry hookup. Unit A offers 2 Bed 1 Bath unit B offers 1 Bed 1 Bath.
-
2013-09-27soldstatus $38,000
ⓘ Source: listings_history table (triggers on properties + properties_extension) + one-shot
backfill from property_details.listing_events for pre-trigger history.
Tax reassessment forecast IN · Partial reset (capped growth)
- Current annual tax
- $1,976 · $165/mo
- Projected year-2 tax
- $1,976 · $165/mo
- Expected delta
- $0/yr ($0/mo · 0.0%)
ⓘ Screening estimate from a state-policy table — verify with the county assessor before closing.
Climate risk First Street
- Flood 1/10 Low FEMA zone X (unshaded) · 0% chance over 30 yrs
- Wildfire 1/10 Low
- Heat 3/10 Moderate 7 d/yr ≥102°F today · 17 d/yr by 30 yrs out
- Wind 2/10 Low
- Air quality 2/10 Low 1 unhealthy d/yr today · 2 by 30 yrs out
Nearby sold comps map
Loading sold comps map…
Walkable amenities ~0.75 mi
Loading nearby amenities…
Taxation est. · year 1
- Rental income
- $25,164
- − Mortgage interest
- −$10,077
- − Property taxes
- −$1,976
- − Insurance
- −$900
- − Repairs & maintenance
- −$2,013
- − Management
- −$2,013
- − Depreciation
- −$5,233
- Taxable income
- $2,952
- Est. tax owed @ 24.0%
- −$708
- After-tax cash flow
- $4,975/yr
For passive investors: Depreciation is non-cash, so a rental often shows a tax loss while cash-flowing — sheltering income. Rental losses are passive: they offset passive income freely, and up to $25,000/yr can offset ordinary (W-2) income if you actively participate and your MAGI is under $100k (phasing out to $0 by $150k); unused losses carry forward. On sale, claimed depreciation is recaptured at up to 25%, and gains may owe capital-gains tax (a 1031 exchange can defer both). Figures are a year-1 estimate at your 24.0% rate — not tax advice; consult a CPA.
Schools (NCES district)
- District
- Delphi Community School Corporation
- NCES district ID
- 1802700
- Math proficiency
- 36% ▼ -11.00%
- Reading proficiency
- 41% ▼ -8.00%
- Median HH income
- $47,044
- Composite
- 32.95/100
- National rank
- #5589
- State rank
- #160 of 301 in IN
Livability — Delphi
- Score
- 72/100
- State rank
- #112
- US rank
- #5934
Category grades
Schools grade is shown separately in the Schools card above.
Census & demographics
- Census place
- Delphi, IN
- Population (ZIP)
- 8,036
Population outlook (Carroll County) Hauer SSP2
- Today (2025)
- 19,409 people
- By 2030
- 18,970 · -2.3%
- By 2040
- 17,934 · -7.6%
- By 2050
- 16,753 · -13.7%
- By 2075
- 14,084 · -27.4%
- By 2100
- 11,350 · -41.5%
Race, ethnicity, and origin ACS 2023
- Neighborhood character
- Predominantly White (90%)
- Race & ethnicity
- White 90% Hispanic / Latino 7% Two or more races 4%
- Hispanic origin (detail)
- Mexican 6%
- Common ancestry
- Lithuanian 2% Slovak 2% Italian 2%
- Foreign-born
- 3% · Canada, Jamaica
- Languages at home
- 95% English-only · Spanish 5%
Political lean MEDSL · Carroll
- 2024 margin
- Solid R (+52.1) · D 23.1% · R 75.2% · Other 1.7%
- 2008→2024 swing
- -39.3pp toward R · 2008: -12.8pp · 2024: -52.1pp
- All cycles
- 2024: R+52.1 2020: R+51.2 2016: R+50.9 2012: R+30.3 2008: R+12.8
Not yet ingested
- Civics
- —
Market trends
- HPI YoY
- ▼ -30.54%
- Current HPI
- 261.2451
- Rent YoY
- —
- Metro
- —
- State GDP YoY
- ▲ 2.90%
- F500 in state
- 18
Industry mix (Fortune 500 HQ in IN)
| Industry | F500 HQs | Revenue |
|---|---|---|
| Industrial Machinery | 2 | $37B |
|
||
| Healthcare | 1 | $177B |
|
||
| Pharmaceuticals | 1 | $45B |
|
||
| Metals / Steel | 1 | $18B |
|
||
| Agriculture | 1 | $17B |
|
||
| Packaging | 1 | $12B |
|
||
Price history
+373.4% since first listed4 events — show timeline
- 2025-08-16 Relisted — IRMLS
- 2025-07-26 Contingent — IRMLS
- 2025-07-16 Listed $179,900 IRMLS
- 2013-09-27 Sold (Public Records) $38,000 Public Records
Property tax history
+3.5%/yrLatest (2024): $1,976 · +14.6% YoY. Source: county tax records.
Cash-flow waterfall
monthlySold comps — $/sqft
last 12 mo · ≤1 miLoading sold comps…