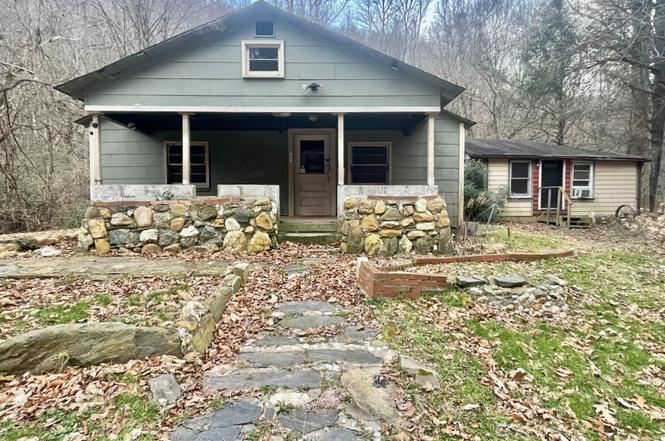
4747 Highway 76 W · Tiger, GA
Flood risk 1/10 · Minimal
- FEMA flood zone
- X (unshaded)
- Chance of flooding over 30 yrs
- 0.0%
- Est. flood insurance / yr
- $507 – $1,088
Fire risk 4/10 · Minor
- Est. fire insurance / yr
- $963 – $1,789
Heat risk 3/10 · Minor
- Hot days now (above 98°F)
- 7 days/yr
- Hot days in 30 yrs
- 20 days/yr
Wind risk 2/10 · Minimal
- Chance of severe wind over 30 yrs
- —
Air-quality risk 4/10 · Minor
- Unhealthy air days now
- 5 days/yr
- Unhealthy air days in 30 yrs
- 5 days/yr
Risk factors via First Street. Map © Google.
Why this score? — see what drove the B grade
The composite is a weighted blend of 9 inputs, each scored 0–100. Each bar is that input's sub-score; the figure is the points it added to the 100-point composite (weight × sub-score).
- Cash flow +30.0/30.0
- DSCR +10.0/10.0
- 1% rule +9.8/10.0
- ARV discount +7.5/15.0
- Appreciation +5.3/10.0
- Schools +3.6/10.0
- Livability +2.8/5.0
- Rent growth +2.5/5.0
- Condition / age +2.5/5.0
$125,000
🖨 Deal sheet 📄 Offer letter ✓ Due diligence
Listing remarks
Investment or renovation opportunity in a highly desirable location. Situated just minutes from Clayton and a short drive to Lake Burton, this property offers exceptional convenience and potential for the right buyer. The main structure includes two separate living units and has been used as rental housing in recent years. The second structure is now a shell with potential for an additional unit or open air studio. Existing improvements include shared well water and two septic systems servicing the current configuration. The structures are set on 1.16 acre and border a flowing creek along the back property line. This property is best suited for investors, builders, or buyers seeking a proje
Key facts
- 1.16 acre
- 1.16 acre lot
- Built 1958
Tags
Neighborhood map
What this means for you Summary
Snapshot
- This is a 3-bed/2.0-bath single-family listed at $125k.
Deal economics
- At list price, monthly cash flow is $721 ($9k/yr) — positive.
- The deal already cash-flows at list — no discount required.
- Meets the 1% rule at list price ($2k rent vs $125k).
- Cap rate 13.2% vs local median 1.7% in Tiger — top-decile yield for the area; either an underpriced asset or a hidden risk that comps aren't pricing in. Stress-test before assuming the spread holds.
Location & tenants
- Location reads 56/100 on livability (#494 in GA) — a working-class tenant base; expect higher turnover. Strengths: housing A; Watch: crime C-, cost of living C-, schools D+.
- Rabun County (rural): math 42% / reading 44% proficiency, ranked #37 of 174 in GA (top 21%) — families likely to look elsewhere, expect single-tenant / working-renter base with shorter leases.
- Market conditions: 256 active listings in the ZIP; 1 comparable units currently listed for rent nearby; 147 units permitted in Rabun County in 2024 (0 in 5+ unit buildings).
Forward outlook
- In year one you build about $2k of equity ($864 loan paydown + $847 appreciation (0.7% local appreciation)).
- Rabun County population projected at -14% by 2050 — secular population decline; favor cash flow + early exit over multi-decade hold.
- At projected returns (0.7% appreciation + 3.0% rent growth), your $35k cash investment doubles in ~4 years — after that, you're playing with house money.
Negotiation context
- Only 13 days on market — expect competitive offers; lowballing is unlikely to land.
- 3 sale attempts since 14y ago with the ask held roughly flat each time — persistent listings suggest the price (not the market) is what's stuck; bring a comps-based counter.
- Current owner paid $92k; 36% above their basis — modest negotiation headroom, anchor on the comps not their cost.
Risks & watch-outs
- Watch-outs: built in 1958 — expect roof / HVAC / electrical / plumbing capex.
Questions for the listing agent
- Built in 1958 — when were the roof, HVAC, electrical panel, plumbing, and water heater last replaced?
- Is there a deadline driving the sale (1031 exchange, divorce, estate, relocation)? That informs how much negotiation room exists.
- Schools are D-rated, which usually means shorter tenancies and higher turnover. Who's the typical renter profile here, and what's been the actual vacancy rate?
- What's the average days-on-market for RENTAL listings here right now (not sales)? A rising rental-DOM trend means longer vacancies and softer asking-rent achievability than the comps imply.
- What's the recent tenant-quality profile in this submarket — average credit score on applications, eviction rate, late-payment / NSF rate, and stable-employment percentage? A property-management company in the area should have these aggregated.
- How much new for-sale + rental construction is in the pipeline within 1–3 miles? Heavy new supply typically softens prices + rents 12–24 months out; constrained supply supports both.
Investment metrics
- 1% rule
- 1.48% ✓
- Cap rate
- 13.22%
- Cash-on-cash
- 24.73%
- DSCR
- 2.10
- GRM
- 5.6
CMA / ARV
No comps found within radius.
Projected returns pro-forma
0.68% appreciation · 3.0% rent growth · sell at horizon
- IRR
- 26.3%
- Equity multiple
- 2.32×
- Total profit
- $46,268
- Equity at exit
- $40,588
- IRR
- 29.3%
- Equity multiple
- 4.44×
- Total profit
- $120,340
- Equity at exit
- $52,361
Cash invested: $35,000 (down + closing). Projections, not guarantees.
Landlord ↔ Tenant lean methodology
- Overall (STATE)
- 90 Strongly Landlord-Friendly
- State Georgia
- 90 Strongly Landlord-Friendly · R+3
- County
- — inherits STATE
- City
- — inherits STATE
ZIP-level market 30525
- Home prices YoY
- 0.2%
- Active inventory
- 256
- Price-to-rent
- 5.6×
Monthly cashflow live
- Estimated rent
- $1,850 medium interval (Pro) →
- Mortgage (P&I)
- −$656
- Tax from tax record
- −$33 /mo · $392/yr
- Insurance
- −$52
- HOA
- −$0
- Vacancy / Maint / Mgmt
- −$388
- Net cashflow
- $721
Break-even live
UW: 25.0% down · 7.5% · 30yr · 1.5% tax · 5.0% vac · 8.0% maint · 8.0% mgmt
Financing live
Cash to close
- Down payment
- $31,250
- Closing costs
- $3,750
- Reserves months
- —
- Total cash needed
- —
Loan-product check · same deal, 3 products live
Conventional
25% down · 7.5% · 30yr
- Down + closing
- —
- Monthly P&I
- —
- Monthly cashflow
- —
- DSCR
- —
- Eligible?
- —
Personal DTI + credit; lowest rate.
DSCR
20% down · 8.5% · 30yr
- Down + closing
- —
- Monthly P&I
- —
- Monthly cashflow
- —
- DSCR
- —
- Eligible?
- —
No personal income docs; deal must DSCR.
Hard money
10% down · 12.0% · 12mo
- Down + closing
- —
- Monthly P&I
- —
- Monthly cashflow
- —
- DSCR
- —
- Eligible?
- —
Short-term bridge; refi at stabilization.
Rent comps 1 comps
| Address | Beds | Baths | Sqft | Rent | $/sqft | DOM | Units | Dist |
|---|---|---|---|---|---|---|---|---|
| 43 Davis Gap Rd Clayton, GA | 2.0 | 2.0 | 1296 | $1,850 | $1.43 | 43d | 1 | 0.07mi |
Listing history 7 events
-
2026-03-03status Under Contract
-
2026-02-17$125,000 New
-
2016-01-31historical
-
2014-07-30$75,000
-
2012-04-17historical
-
2012-01-18$169,500
-
2005-09-01soldstatus $92,000
ⓘ Source: listings_history table (triggers on properties + properties_extension) + one-shot
backfill from property_details.listing_events for pre-trigger history.
Tax reassessment forecast GA · Resets to sale price
- Current annual tax
- $392 · $33/mo
- Projected year-2 tax
- $1,150 · $96/mo
- Expected delta
- +$758/yr (+$63/mo · 193.7%)
ⓘ Screening estimate from a state-policy table — verify with the county assessor before closing.
Climate risk First Street
- Flood 1/10 Low FEMA zone X (unshaded) · 0% chance over 30 yrs
- Wildfire 4/10 Moderate
- Heat 3/10 Moderate 7 d/yr ≥98°F today · 20 d/yr by 30 yrs out
- Wind 2/10 Low
- Air quality 4/10 Moderate 5 unhealthy d/yr today · 5 by 30 yrs out
Nearby sold comps map
Loading sold comps map…
Walkable amenities ~0.75 mi
Loading nearby amenities…
Taxation est. · year 1
- Rental income
- $22,200
- − Mortgage interest
- −$7,002
- − Property taxes
- −$392
- − Insurance
- −$625
- − Repairs & maintenance
- −$1,776
- − Management
- −$1,776
- − Depreciation
- −$3,636
- Taxable income
- $6,993
- Est. tax owed @ 24.0%
- −$1,678
- After-tax cash flow
- $6,977/yr
For passive investors: Depreciation is non-cash, so a rental often shows a tax loss while cash-flowing — sheltering income. Rental losses are passive: they offset passive income freely, and up to $25,000/yr can offset ordinary (W-2) income if you actively participate and your MAGI is under $100k (phasing out to $0 by $150k); unused losses carry forward. On sale, claimed depreciation is recaptured at up to 25%, and gains may owe capital-gains tax (a 1031 exchange can defer both). Figures are a year-1 estimate at your 24.0% rate — not tax advice; consult a CPA.
Schools (NCES district)
- District
- Rabun County
- NCES district ID
- 1304320
- Math proficiency
- 42% ▼ -17.00%
- Reading proficiency
- 44% ▼ -4.00%
- Median HH income
- $35,980
- Composite
- 35.64/100
- National rank
- #4882
- State rank
- #37 of 174 in GA
Livability — Tiger
- Score
- 56/100
- State rank
- #494
- US rank
- #22820
Category grades
Schools grade is shown separately in the Schools card above.
Census & demographics
- Population (ZIP)
- 7,265
Population outlook (Rabun County) Hauer SSP2
- Today (2025)
- 16,227 people
- By 2030
- 16,000 · -1.4%
- By 2040
- 15,213 · -6.2%
- By 2050
- 13,974 · -13.9%
- By 2075
- 10,717 · -34.0%
- By 2100
- 7,824 · -51.8%
Race, ethnicity, and origin ACS 2023
- Neighborhood character
- Predominantly White (88%)
- Race & ethnicity
- White 88% Hispanic / Latino 8% Two or more races 8%
- Hispanic origin (detail)
- Mexican 7%
- Common ancestry
- Serbian 4% Slovak 3% Romanian 2%
- Foreign-born
- 5% · Canada
- Languages at home
- 91% English-only · Spanish 8% Other Indo-European 1%
Political lean MEDSL · Rabun
- 2024 margin
- Solid R (+56.9) · D 21.3% · R 78.2%
- 2008→2024 swing
- -11.0pp toward R · 2008: -45.9pp · 2024: -56.9pp
- All cycles
- 2024: R+56.9 2020: R+57.4 2016: R+60.9 2012: R+56.4 2008: R+45.9
Not yet ingested
- Civics
- —
Market trends
- HPI YoY
- ▲ 0.68%
- Current HPI
- 310.5456
- Rent YoY
- —
- Metro
- —
- State GDP YoY
- ▲ 2.66%
- F500 in state
- 28
Industry mix (Fortune 500 HQ in GA)
| Industry | F500 HQs | Revenue |
|---|---|---|
| Paper / Packaging | 2 | $29B |
|
||
| Retail | 1 | $160B |
|
||
| Transportation / Logistics | 1 | $91B |
|
||
| Airlines | 1 | $62B |
|
||
| Consumer Goods | 1 | $47B |
|
||
| Utilities | 1 | $25B |
|
||
Price history
+35.9% since first listed7 events — show timeline
- 2026-03-03 Pending — GAMLS
- 2026-02-17 Listed $125,000 GAMLS
- 2016-01-31 Listing Removed — GAMLS
- 2014-07-30 Listed $75,000 GAMLS
- 2012-04-17 Listing Removed — GAMLS
- 2012-01-18 Listed $169,500 GAMLS
- 2005-09-01 Sold (Public Records) $92,000 Public Records
Property tax history
+0.7%/yrLatest (2025): $392 · +0.0% YoY. Source: county tax records.
Cash-flow waterfall
monthlySold comps — $/sqft
last 12 mo · ≤1 miLoading sold comps…