 Duplex
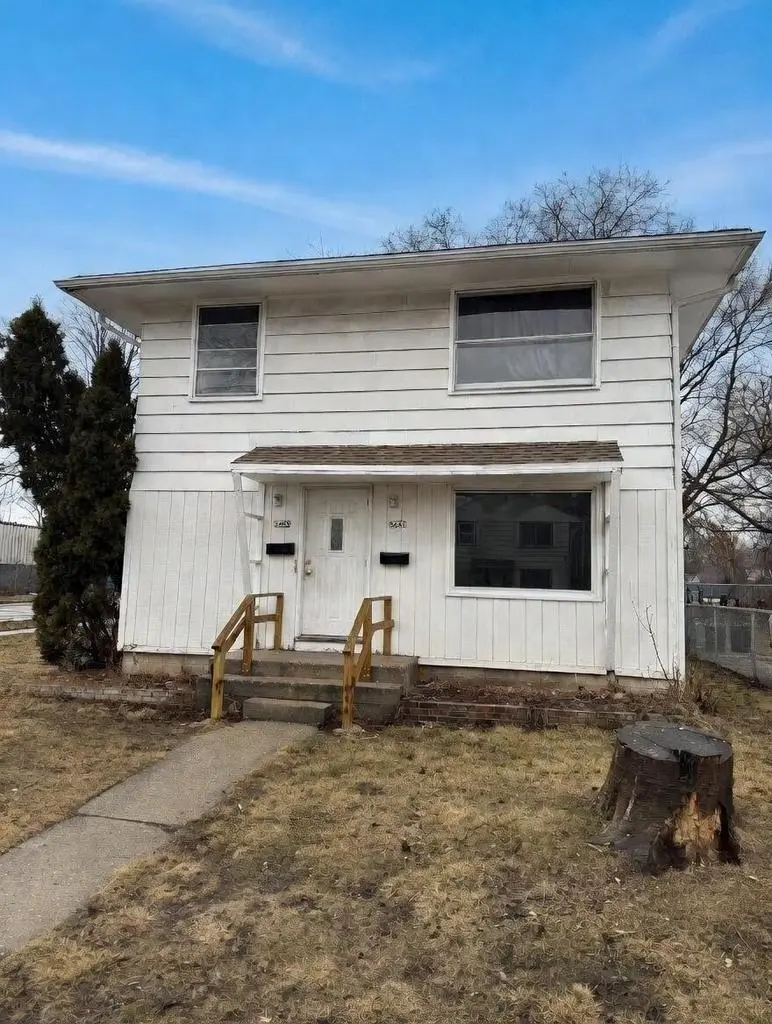
5641 N 61st St #5643 · Milwaukee, WI
Flood risk 6/10 · Moderate
- FEMA flood zone
- X (unshaded)
- Chance of flooding over 30 yrs
- 0.72%
- Est. flood insurance / yr
- $473 – $860
Fire risk 1/10 · Minimal
- Est. fire insurance / yr
- $636 – $1,182
Heat risk 2/10 · Minimal
- Hot days now (above 100°F)
- 7 days/yr
- Hot days in 30 yrs
- 13 days/yr
Wind risk 2/10 · Minimal
- Chance of severe wind over 30 yrs
- —
Air-quality risk 2/10 · Minimal
- Unhealthy air days now
- 2 days/yr
- Unhealthy air days in 30 yrs
- 2 days/yr
Risk factors via First Street. Map © Google.
Why this score? — see what drove the B- grade
The composite is a weighted blend of 9 inputs, each scored 0–100. Each bar is that input's sub-score; the figure is the points it added to the 100-point composite (weight × sub-score).
- Cash flow +30.0/30.0
- DSCR +10.0/10.0
- 1% rule +9.9/10.0
- ARV discount +8.7/15.0
- Livability +4.0/5.0
- Rent growth +3.8/5.0
- Condition / age +2.2/5.0
- Schools +1.2/10.0
- Appreciation +0.0/10.0
$164,900
🖨 Deal sheet 📄 Offer letter ✓ Due diligence
Multi-family units
County records classify this as Multi-Family (2-4 Unit). Listing-text estimate: 2 units. confirmed
Listing remarks MLS
Great investment opportunity in Milwaukee! This duplex features two 2-bedroom, 1-bath units, making it a perfect addition to any investor's portfolio. Each unit offers comfortable living space with strong rental potential. Ideal for owner-occupants looking to offset their mortgage or investors seeking steady income when both units rented. Convenient location with easy access to local amenities, shopping, and transportation. Don't miss this chance to own a solid income-producing property!
Key facts
- Convenient location
- 5,227 sq ft lot
- Garage
Tags
Neighborhood map
What this means for you Summary
Snapshot
- This is a 2 × 2-bed/1-bath units multifamily listed at $165k. Condition is rated fair.
Deal economics
- At list price, monthly cash flow is $801 ($10k/yr) — positive. Per door: $400/mo.
- The deal already cash-flows at list — no discount required.
- Meets the 1% rule at list price ($2k rent vs $165k).
- Recommended offer: $150k (9.0% below list) — sets the bar for market timing.
- Cap rate 12.1% vs local median 5.1% in Milwaukee — top-decile yield for the area; either an underpriced asset or a hidden risk that comps aren't pricing in. Stress-test before assuming the spread holds.
Location & tenants
- Location reads 81/100 on livability (#55 in WI, #1,534 nationally) — a professional / high-income tenant draw. Strengths: amenities A+, commute A+, cost of living A+; Watch: employment D+, schools F, crime F.
- Milwaukee School District (urban): math 10% / reading 18% proficiency, ranked #337 of 342 in WI (top 98%) — low school quality limits family demand, transient renter base, plan for 1-2y turnover; 77% free/reduced lunch — lower-income household profile, screen leases tightly.
- Market conditions: Rents rising fast (+5.3%/yr); 153 active listings in the ZIP; 13 comparable units currently listed for rent nearby; rentals at typical pace (median 24d on market — plan ~3-4 weeks tenant-placement turnaround); 1,017 units permitted in Milwaukee County in 2024 (803 in 5+ unit buildings).
- At $2,456/mo this rent would consume 65% of the median local household income ($46k/yr) (locally 2421% of renters already pay >50% of income on rent) — very limited rent-growth headroom before tenants either downsize or default.
Forward outlook
- Local home prices are declining (-3.0%/yr); year-one equity from $1k of loan paydown is wiped out by about $5k of value loss. Plan a longer hold.
- Milwaukee County population projected at +4% by 2050 — modest demand growth; plan on rents tracking national, not racing it.
- At projected returns (-3.0% appreciation + 5.3% rent growth), your $46k cash investment doubles in ~6 years — after that, you're playing with house money.
Negotiation context
- It's been on market 97 days — a 9% lower offer ($150k) is reasonable based on typical stale-listing flexibility.
- 8 sale attempts since 14y ago with the ask held roughly flat each time — persistent listings suggest the price (not the market) is what's stuck; bring a comps-based counter.
- Current owner paid $23k; list at $165k implies a 617% gain — meaningful room to come down on a strong offer.
Risks & watch-outs
- Watch-outs: built in 1954 — expect roof / HVAC / electrical / plumbing capex.
- Climate carrying-cost: major flood risk — expect insurance premiums to compound above CPI over the hold.
Questions for the listing agent
- It's been on market 97 days. Have you received any prior offers? Is the seller open to a 9% concession, seller financing, or rate buy-down credit?
- Can we see the unit-by-unit rent roll, current vacancy, and any below-market leases? What's the average tenancy length?
- What capital expenditures (roof, boiler, parking lot, exteriors) have been made in the last 5 years, and what's planned in the next 2?
- Have any recent inspections been done? Can we get a copy of the seller's disclosures and any deferred-maintenance estimates?
- Built in 1954 — when were the roof, HVAC, electrical panel, plumbing, and water heater last replaced?
- Why hasn't it sold? Are there any deal-killer items the seller is aware of (foundation, flood, title, zoning, code violations)?
- Is there a deadline driving the sale (1031 exchange, divorce, estate, relocation)? That informs how much negotiation room exists.
- Schools are F-rated, which usually means shorter tenancies and higher turnover. Who's the typical renter profile here, and what's been the actual vacancy rate?
- Crime grade is F in this area — have there been break-ins, vandalism, or insurance claims at this property in the last 3 years? What carrier currently insures it and at what premium?
- What's the average days-on-market for RENTAL listings here right now (not sales)? A rising rental-DOM trend means longer vacancies and softer asking-rent achievability than the comps imply.
- What's the recent tenant-quality profile in this submarket — average credit score on applications, eviction rate, late-payment / NSF rate, and stable-employment percentage? A property-management company in the area should have these aggregated.
- How much new apartment / multifamily construction is in the pipeline within 1–3 miles? Heavy new supply (>2% of stock underway) typically softens rents 12–24 months out; light construction supports rent growth.
Investment metrics
- 1% rule
- 1.49% ✓
- Cap rate
- 12.12%
- Cash-on-cash
- 20.81%
- DSCR
- 1.93
- GRM
- 5.6
CMA / ARV
- ARV (median comp)
- $169,599
- List price
- $164,900
- Delta
- -2.77%
- Verdict
- FAIR
- Comps
- 20 within 1.0 mi
Show comp detail 2 sales within ~0.75 mi
| Address | Dist | Beds/Ba | Sqft | Sold | Price | $/sf | Match |
|---|---|---|---|---|---|---|---|
| 6600 W Carmen Ave #6602 | 0.36mi | 4/2.0 | 1,536 (0%) | 14mo | $150,000 | $98 | 68 |
| 5908 N 65th St #5910 | 0.39mi | 4/2.0 | 1,536 (0%) | 21mo | $155,000 | $101 | 60 |
Match score weights: distance 35% · size 25% · config 20% · recency 20%. Top-matched comps best support the ARV.
Projected returns pro-forma
-3.0% appreciation · 5.29% rent growth · sell at horizon
- IRR
- 15.8%
- Equity multiple
- 1.65×
- Total profit
- $30,098
- Equity at exit
- $24,587
- IRR
- 26.0%
- Equity multiple
- 3.53×
- Total profit
- $116,914
- Equity at exit
- $14,258
Cash invested: $46,172 (down + closing). Projections, not guarantees.
Landlord ↔ Tenant lean methodology
- Overall (STATE)
- 73 Landlord-Friendly
- State Wisconsin
- 73 Landlord-Friendly · R+2
- County
- — inherits STATE
- City
- — inherits STATE
ZIP-level market 53218
- Home prices YoY
- -19.0%
- Rents YoY
- 5.3%
- Active inventory
- 153
- Price-to-rent
- 11.2×
Monthly cashflow live
- Estimated rent
- $2,456 high interval (Pro) →
- Mortgage (P&I)
- −$865
- Tax est. 1.5%
- −$206 /mo · $2,474/yr
- Insurance
- −$69
- HOA
- −$0
- Vacancy / Maint / Mgmt
- −$516
- Net cashflow
- $801
Break-even live
2-unit breakdown (identical units grouped — click to expand)
| Units | Beds | Baths | Est. rent |
|---|---|---|---|
| 2× units | 2 | 1 | $2,456 |
| #1 | 2 | 1 | $1,228 |
| #2 | 2 | 1 | $1,228 |
| Total (2 units) | $2,456 | ||
UW: 25.0% down · 7.5% · 30yr · 1.5% tax · 5.0% vac · 8.0% maint · 8.0% mgmt
Financing live
Cash to close
- Down payment
- $41,225
- Closing costs
- $4,947
- Reserves months
- —
- Total cash needed
- —
Loan-product check · same deal, 3 products live
Conventional
25% down · 7.5% · 30yr
- Down + closing
- —
- Monthly P&I
- —
- Monthly cashflow
- —
- DSCR
- —
- Eligible?
- —
Personal DTI + credit; lowest rate.
DSCR
20% down · 8.5% · 30yr
- Down + closing
- —
- Monthly P&I
- —
- Monthly cashflow
- —
- DSCR
- —
- Eligible?
- —
No personal income docs; deal must DSCR.
Hard money
10% down · 12.0% · 12mo
- Down + closing
- —
- Monthly P&I
- —
- Monthly cashflow
- —
- DSCR
- —
- Eligible?
- —
Short-term bridge; refi at stabilization.
Rent comps 13 comps
| Address | Beds | Baths | Sqft | Rent | $/sqft | DOM | Units | Dist |
|---|---|---|---|---|---|---|---|---|
| 6046 N 61st St Unit 1 Milwaukee, WI | 3.0 | 1.0 | 1200 | $1,345 | $1.12 | 23d | 1 | 0.47mi |
| 6046 N 61st St Unit 2 Milwaukee, WI | 3.0 | 1.0 | 1250 | $1,395 | $1.12 | 43d | 1 | 0.47mi |
| 5268 N 64th St Milwaukee, WI | 5.0 | 1.0 | 1672 | $1,850 | $1.11 | 10d | 1 | 0.53mi |
| 6921 W Herbert Ave Milwaukee, WI | 3.0 | 2.0 | 1414 | $1,620 | $1.15 | 4d | 1 | 0.60mi |
| 4900 N 58th St Milwaukee, WI | 3.0 | 1.0 | 1455 | $1,450 | $1.00 | 4d | 1 | 1.01mi |
| 6919-6921 W Brentwood Ave Unit 6919 Milwaukee, WI | 3.0 | 1.5 | 1200 | $1,699 | $1.42 | 4d | 1 | 1.07mi |
| 5073 N 48th St Milwaukee, WI | 4.0 | 1.0 | 1152 | $1,595 | $1.38 | 14d | 1 | 1.08mi |
| 5955 N 79th St Unit 1 Milwaukee, WI | 3.0 | 1.0 | 1100 | $1,650 | $1.50 | 43d | 1 | 1.17mi |
| 5908 N 80th St Milwaukee, WI | 3.0 | 1.0 | 1056 | $1,550 | $1.47 | 23d | 1 | 1.18mi |
| 6813 W Hampton Ave Unit Rear (Unit B) Milwaukee, WI | 3.0 | 2.0 | 1600 | $1,350 | $0.84 | 23d | 1 | 1.22mi |
| 4340 W Eggert Pl Milwaukee, WI | 4.0 | 1.0 | 1066 | $1,695 | $1.59 | 23d | 1 | 1.23mi |
| 4334 W Eggert Pl Milwaukee, WI | 4.0 | 1.0 | 1077 | $1,695 | $1.57 | 23d | 1 | 1.24mi |
| 3931 W Kaul Ave Milwaukee, WI | 3.0 | 1.0 | 1400 | $1,695 | $1.21 | 43d | 1 | 1.42mi |
Listing history 32 events
-
2026-06-18days on market $164,900 Active 97 DOM
-
2026-06-17days on market $164,900 Active 96 DOM
-
2026-06-16days on market $164,900 Active 95 DOM
-
2026-06-15days on market $164,900 Active 94 DOM
-
2026-06-13days on market $164,900 Active 92 DOM
-
2026-06-13days on market $164,900 Active 91 DOM
-
2026-06-09days on market $164,900 Active 88 DOM
-
2026-06-08days on market $164,900 Active 87 DOM
-
2026-06-07days on market $164,900 Active 86 DOM
-
2026-06-05days on market $164,900 Active 83 DOM
-
2026-06-03days on market $164,900 Active 82 DOM
-
2026-06-02days on market $164,900 Active 81 DOM
-
2026-06-01days on market $164,900 Active 80 DOM
-
2026-05-31days on market $164,900 Active 79 DOM
-
2026-03-13$164,900 Active 492-char remark
Show marketing remark (492 chars)
Great investment opportunity in Milwaukee! This duplex features two 2-bedroom, 1-bath units, making it a perfect addition to any investor's portfolio. Each unit offers comfortable living space with strong rental potential. Ideal for owner-occupants looking to offset their mortgage or investors seeking steady income when both units rented. Convenient location with easy access to local amenities, shopping, and transportation. Don't miss this chance to own a solid income-producing property!
-
2025-11-20historical $850
-
2025-10-10$850
-
2025-01-09historical $900
-
2024-11-09$900
-
2023-03-26status Pending 114-char remark
Show marketing remark (114 chars)
This duplex is fully vacant looking for the right investor to see the potential. This is been sold AS IS CONDITION
-
2023-03-25historical 114-char remark
Show marketing remark (114 chars)
This duplex is fully vacant looking for the right investor to see the potential. This is been sold AS IS CONDITION
-
2023-03-15$120,000 Active 114-char remark
Show marketing remark (114 chars)
This duplex is fully vacant looking for the right investor to see the potential. This is been sold AS IS CONDITION
-
2012-10-10$132,000
-
2012-10-10historical
-
2012-10-10$32,000
-
2012-10-10historical
-
2012-10-10$14,000
-
2012-10-10historical
-
2012-01-21historical
-
2012-01-21$39,000
-
2012-01-20soldstatus $23,000
-
2011-05-24soldstatus $9,500
ⓘ Source: listings_history table (triggers on properties + properties_extension) + one-shot
backfill from property_details.listing_events for pre-trigger history.
Climate risk First Street
- Flood 6/10 Major FEMA zone X (unshaded) · 72% chance over 30 yrs
- Wildfire 1/10 Low
- Heat 2/10 Low 7 d/yr ≥100°F today · 13 d/yr by 30 yrs out
- Wind 2/10 Low
- Air quality 2/10 Low 2 unhealthy d/yr today · 2 by 30 yrs out
Nearby sold comps map
Loading sold comps map…
Walkable amenities ~0.75 mi
Loading nearby amenities…
Taxation est. · year 1
- Rental income
- $29,472
- − Mortgage interest
- −$9,237
- − Property taxes
- −$2,474
- − Insurance
- −$824
- − Repairs & maintenance
- −$2,358
- − Management
- −$2,358
- − Depreciation
- −$4,797
- Taxable income
- $7,424
- Est. tax owed @ 24.0%
- −$1,782
- After-tax cash flow
- $7,826/yr
For passive investors: Depreciation is non-cash, so a rental often shows a tax loss while cash-flowing — sheltering income. Rental losses are passive: they offset passive income freely, and up to $25,000/yr can offset ordinary (W-2) income if you actively participate and your MAGI is under $100k (phasing out to $0 by $150k); unused losses carry forward. On sale, claimed depreciation is recaptured at up to 25%, and gains may owe capital-gains tax (a 1031 exchange can defer both). Figures are a year-1 estimate at your 24.0% rate — not tax advice; consult a CPA.
Condition & rehab AI · 10 photos
This two-unit property requires moderate renovations to improve its curb appeal and interior aesthetics, increasing its resale and rental value.
Repairs flagged
- Minor exterior siding — some discoloration
- Minor interior paint — some discoloration
- Minor landscaping — some overgrown areas
Value-add opportunities
- Both paint interior and exterior — enhances curb appeal and interior aesthetics
- Both landscaping — improves curb appeal and enhances property value
- Both replace carpet with hardwood or tile — increases both resale and rental value
- Both update kitchen and bathrooms — modernizes the property and enhances both resale and rental value
Renovation cost estimate screening
| Repair item | Severity | Est. cost |
|---|---|---|
| exterior siding · some discoloration | Minor | $500–3,000 |
| interior paint · some discoloration | Minor | $500–3,000 |
| landscaping · some overgrown areas | Minor | $500–3,000 |
| Total estimated repair cost · 3 items | $1,500–9,000 |
Value-add ROI direction
- Both paint interior and exterior — enhances curb appeal and interior aesthetics ↑
- Both landscaping — improves curb appeal and enhances property value ↑
- Both replace carpet with hardwood or tile — increases both resale and rental value ↑
- Both update kitchen and bathrooms — modernizes the property and enhances both resale and rental value ↑
ⓘ Cost ranges are severity-bucket heuristics (US national rule-of-thumb). Get contractor quotes + a written scope before underwriting a rehab budget.
Schools (NCES district)
- District
- Milwaukee School District
- NCES district ID
- 5509600
- Math proficiency
- 10% ▼ -5.00%
- Reading proficiency
- 18% ▬ 0.00%
- Median HH income
- $36,339
- Composite
- 11.61/100
- National rank
- #9696
- State rank
- #337 of 342 in WI
Livability — Milwaukee
- Score
- 81/100
- State rank
- #55
- US rank
- #1534
Category grades
Schools grade is shown separately in the Schools card above.
Census & demographics
- Census place
- Milwaukee, WI
- County
- Milwaukee County · 926,379 people
- City population
- 573,768
- Metro
- Milwaukee-Waukesha, WI
- Population (ZIP)
- 41,196
- Household income
- $45,642
- Rent vs Own
- Severe rent burden
- 2421.0
Population outlook (Milwaukee County) Hauer SSP2
- Today (2025)
- 995,758 people
- By 2030
- 1,009,124 · +1.3%
- By 2040
- 1,028,128 · +3.3%
- By 2050
- 1,040,066 · +4.4%
- By 2075
- 1,057,849 · +6.2%
- By 2100
- 1,039,774 · +4.4%
Race, ethnicity, and origin ACS 2023
- Neighborhood character
- Predominantly Black (72%)
- Race & ethnicity
- Black 72% Asian 10% White 10% Hispanic / Latino 5% Two or more races 3%
- Common ancestry
- Romanian 1% Lithuanian 1%
- Foreign-born
- 6% · Philippines, Canada
- Languages at home
- 89% English-only · Other Asian/Pacific 7% Spanish 3%
Political lean MEDSL · Milwaukee
- 2024 margin
- Solid D (+38.5) · D 68.3% · R 29.8% · Other 1.8%
- 2008→2024 swing
- +2.7pp toward D · 2008: 35.9pp · 2024: 38.5pp
- All cycles
- 2024: D+38.5 2020: D+39.9 2016: D+37.5 2012: D+34.6 2008: D+35.9
Not yet ingested
- Civics
- —
Market trends
- HPI YoY
- ▼ -76.44%
- Current HPI
- 325.1975
- Rent YoY
- ▲ 5.29%
- Metro
- Milwaukee-Waukesha, WI
- State GDP YoY
- ▲ 2.10%
- F500 in state
- 20
Industry mix (Fortune 500 HQ in WI)
| Industry | F500 HQs | Revenue |
|---|---|---|
| Industrial Machinery | 4 | $23B |
|
||
| Industrial Technology | 2 | $36B |
|
||
| Insurance | 1 | $36B |
|
||
| Professional Services | 1 | $19B |
|
||
| Utilities | 1 | $9B |
|
||
| Consumer Goods | 1 | $3B |
|
||
Price history
+1635.8% since first listed18 events — show timeline
- 2026-03-13 Listed $164,900 METROMLS
- 2025-11-20 Rental Removed $850 APPFOLIO
- 2025-10-10 Listed for Rent $850 APPFOLIO
- 2025-01-09 Rental Removed $900 APPFOLIO
- 2024-11-09 Listed for Rent $900 APPFOLIO
- 2023-03-26 Pending — METROMLS
- 2023-03-25 Listing Removed — METROMLS
- 2023-03-15 Listed $120,000 METROMLS
- 2012-10-10 Listing Removed — METROMLS
- 2012-10-10 Listed $132,000 METROMLS
- 2012-10-10 Listing Removed — METROMLS
- 2012-10-10 Listed $32,000 METROMLS
- 2012-10-10 Listing Removed — METROMLS
- 2012-10-10 Listed $14,000 METROMLS
- 2012-01-21 Listed $39,000 METROMLS
- 2012-01-21 Listing Removed — METROMLS
- 2012-01-20 Sold (MLS) $23,000 METROMLS
- 2011-05-24 Sold (MLS) $9,500 METROMLS
Cash-flow waterfall
monthlySold comps — $/sqft
last 12 mo · ≤1 miLoading sold comps…