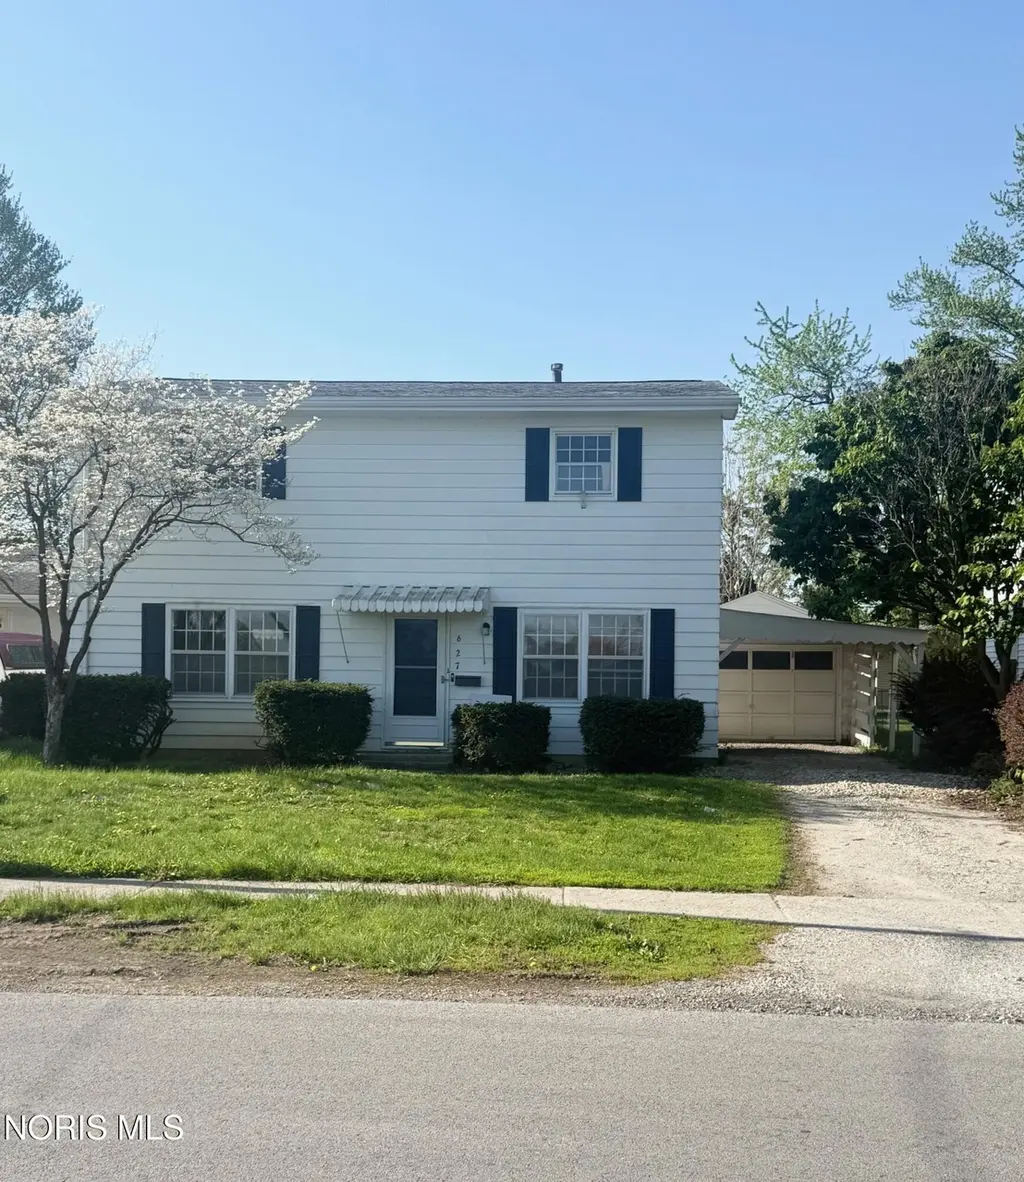
627 W Foulke Ave · Findlay, OH
Flood risk 1/10 · Minimal
- FEMA flood zone
- X (unshaded)
- Chance of flooding over 30 yrs
- 0.0%
- Est. flood insurance / yr
- $507 – $1,088
Fire risk 1/10 · Minimal
- Est. fire insurance / yr
- $713 – $1,323
Heat risk 3/10 · Minor
- Hot days now (above 98°F)
- 7 days/yr
- Hot days in 30 yrs
- 17 days/yr
Wind risk 2/10 · Minimal
- Chance of severe wind over 30 yrs
- —
Air-quality risk 2/10 · Minimal
- Unhealthy air days now
- 1 days/yr
- Unhealthy air days in 30 yrs
- 2 days/yr
Risk factors via First Street. Map © Google.
Why this score? — see what drove the C- grade
The composite is a weighted blend of 9 inputs, each scored 0–100. Each bar is that input's sub-score; the figure is the points it added to the 100-point composite (weight × sub-score).
- Cash flow +21.0/30.0
- DSCR +6.7/10.0
- 1% rule +4.9/10.0
- Schools +4.7/10.0
- Livability +4.0/5.0
- Rent growth +3.9/5.0
- ARV discount +2.8/15.0
- Condition / age +2.5/5.0
- Appreciation +0.0/10.0
$194,900
🖨 Deal sheet 📄 Offer letter ✓ Due diligence
Listing remarks
Northend 2 story with lots of room and storage. One car garage and a carport. Large fenced in yard close to restaurants, shopping and schools. Large rooms in this 4 bedroom, 1.5 bath, living room, dining room and kitchen. Laundry on the 1st floor. hardwood floors throughout.
Key facts
- One car garage
- Close to restaurants
- Carport
Tags
Property features AI
Exterior
- Parking: Attached carport (1 space); Detached garage (1 space); Driveway parking (gravel)
- Utilities: Public water; Public sewer; Electricity connected and available; Natural gas connected; Cable, internet and WiFi available
- Home design: Single-family house; Two levels (2-story); Not attached to other structures; Year built (public records)
- Construction: Aluminum siding; Asphalt roof; Block foundation with crawl space
- Exterior features: Fire pit; Chain link fence; Asphalt road frontage and driveway
Interior
- Kitchen: Dishwasher; Electric range; Microwave; Refrigerator; Water heater
- Bedrooms: Upper level bedrooms (multiple)
- Flooring: Carpet; Hardwood; Linoleum; Vinyl
- Bathrooms: 1 full bathroom; 1 half bathroom (1.5 total)
- Heating & cooling: Forced air heating (natural gas); Central air conditioning
- Interior features: Ceiling fans
- Laundry & utility: Main-level laundry with accessible utilities
Neighborhood map
What this means for you Summary
Snapshot
- This is a 4-bed/1.5-bath single-family listed at $195k.
Deal economics
- At list price, monthly cash flow is $275 ($3k/yr) — positive.
- The deal already cash-flows at list — no discount required.
- To meet the 1% rule (rent ≥ 1% of price), the offer needs to be $194k (0.5% below list).
- Recommended offer: $189k (3.0% below list) — sets the bar for market timing.
- Cap rate 8.0% vs local median 5.0% in Findlay — top-decile yield for the area; either an underpriced asset or a hidden risk that comps aren't pricing in. Stress-test before assuming the spread holds.
Location & tenants
- Location reads 81/100 on livability (#98 in OH, #1,496 nationally) — a professional / high-income tenant draw. Strengths: amenities A+, cost of living A+, housing A+; Watch: employment D+, commute F.
- Findlay City (town): math 56% / reading 56% proficiency, ranked #357 of 656 in OH (top 54%) — acceptable for families but not a draw, mixed tenant base, ~2y average lease.
- Zoned schools: Northview Primary School (math 57% / reading 57%, grade C+, #729 of 1,584 statewide, top 48%, 361 students, 54% FRL); Glenwood Middle School (math 47% / reading 41%, grade D, #484 of 654 statewide, top 74%, 535 students, 45% FRL); Findlay High School (math 51% / reading 60%, grade C, #296 of 781 statewide, top 39%, 1,915 students, 31% FRL).
- Market conditions: Rents rising fast (+5.7%/yr); 219 active listings in the ZIP; 1 comparable units currently listed for rent nearby; 257 units permitted in Hancock County in 2024 (150 in 5+ unit buildings).
- This rent runs 34% of the median local income ($68k/yr) — at the standard rent-burdened threshold; future hikes will face affordability resistance.
Forward outlook
- Local home prices are declining (-3.0%/yr); year-one equity from $1k of loan paydown is wiped out by about $6k of value loss. Plan a longer hold.
- Hancock County population projected to shrink 4% by 2050 — rents likely to lag national; underwrite the cash flow, not the appreciation.
Negotiation context
- It's been on market 56 days — a 3% lower offer ($189k) is reasonable based on typical stale-listing flexibility.
Questions for the listing agent
- It's been on market 56 days. Have you received any prior offers? Is the seller open to a 3% concession, seller financing, or rate buy-down credit?
- Built in 1967 — when were the roof, HVAC, electrical panel, plumbing, and water heater last replaced?
- Is there a deadline driving the sale (1031 exchange, divorce, estate, relocation)? That informs how much negotiation room exists.
- Schools are B-rated — typically a magnet for longer-tenancy family renters. What's the average tenant stay here, and is there a school-zone premium baked into asking?
- What's the average days-on-market for RENTAL listings here right now (not sales)? A rising rental-DOM trend means longer vacancies and softer asking-rent achievability than the comps imply.
- What's the recent tenant-quality profile in this submarket — average credit score on applications, eviction rate, late-payment / NSF rate, and stable-employment percentage? A property-management company in the area should have these aggregated.
- How much new for-sale + rental construction is in the pipeline within 1–3 miles? Heavy new supply typically softens prices + rents 12–24 months out; constrained supply supports both.
Investment metrics
- 1% rule
- 0.99% ✗
- Cap rate
- 7.99%
- Cash-on-cash
- 6.04%
- DSCR
- 1.27
- GRM
- 8.4
CMA / ARV
- ARV (median comp)
- $176,434
- List price
- $194,900
- Delta
- 13.30%
- Verdict
- OVERPRICED
- Comps
- 20 within 1.0 mi
Show comp detail 12 sales within ~0.75 mi
| Address | Dist | Beds/Ba | Sqft | Sold | Price | $/sf | Match |
|---|---|---|---|---|---|---|---|
| 701 W Melrose Ave | 0.56mi | 3/1.5 (-1) | 1,520 (-1%) | 2mo | $238,500 | $157 | 66 |
| 142 Clifton Ave | 0.53mi | 3/1.5 (-1) | 1,494 (-3%) | 1mo | $156,277 | $105 | 65 |
| 315 W Melrose Ave | 0.65mi | 3/1.0 (-1) | 1,542 (+0%) | 2mo | $204,500 | $133 | 61 |
| 1934 Geffs Ave | 0.63mi | 4/1.5 | 1,643 (+7%) | 0mo | $213,500 | $130 | 58 |
| 2318 Anna St | 0.71mi | 3/1.0 (-1) | 1,548 (+1%) | 2mo | $194,970 | $126 | 57 |
| 137 Allen Ave | 0.67mi | 4/2.0 | 1,624 (+6%) | 1mo | $181,500 | $112 | 57 |
| 524 Defiance Ave | 0.46mi | 4/2.0 | 1,397 (-9%) | 6mo | $150,000 | $107 | 56 |
| 706 N Cory St | 0.72mi | 5/2.5 (+1) | 1,532 (-0%) | 3mo | $175,000 | $114 | 54 |
| 115 George St | 0.66mi | 4/3.0 | 1,597 (+4%) | 5mo | $150,000 | $94 | 52 |
| 1005 Broad Ave | 0.36mi | 4/4.0 | 1,750 (+14%) | 3mo | $185,000 | $106 | 48 |
| 925 W Melrose Ave | 0.67mi | 3/2.0 (-1) | 1,671 (+9%) | 2mo | $280,000 | $168 | 45 |
| 224 Defiance Ave | 0.74mi | 4/2.0 | 1,716 (+12%) | 4mo | $199,900 | $116 | 40 |
Match score weights: distance 35% · size 25% · config 20% · recency 20%. Top-matched comps best support the ARV.
Projected returns pro-forma
-3.0% appreciation · 5.68% rent growth · sell at horizon
- IRR
- -4.2%
- Equity multiple
- 0.84×
- Total profit
- $-8,733
- Equity at exit
- $29,060
- IRR
- 8.2%
- Equity multiple
- 1.70×
- Total profit
- $38,104
- Equity at exit
- $16,851
Cash invested: $54,572 (down + closing). Projections, not guarantees.
Landlord ↔ Tenant lean methodology
- Overall (STATE)
- 73 Landlord-Friendly
- State Ohio
- 73 Landlord-Friendly · R+6
- County
- — inherits STATE
- City
- — inherits STATE
ZIP-level market 45840
- Rents YoY
- 5.7%
- Active inventory
- 219
- Price-to-rent
- 8.4×
Monthly cashflow live
- Estimated rent
- $1,939 medium interval (Pro) →
- Mortgage (P&I)
- −$1,022
- Tax from tax record
- −$153 /mo · $1,840/yr
- Insurance
- −$81
- HOA
- −$0
- Vacancy / Maint / Mgmt
- −$407
- Net cashflow
- $275
Break-even live
UW: 25.0% down · 7.5% · 30yr · 1.5% tax · 5.0% vac · 8.0% maint · 8.0% mgmt
Financing live
Cash to close
- Down payment
- $48,725
- Closing costs
- $5,847
- Reserves months
- —
- Total cash needed
- —
Loan-product check · same deal, 3 products live
Conventional
25% down · 7.5% · 30yr
- Down + closing
- —
- Monthly P&I
- —
- Monthly cashflow
- —
- DSCR
- —
- Eligible?
- —
Personal DTI + credit; lowest rate.
DSCR
20% down · 8.5% · 30yr
- Down + closing
- —
- Monthly P&I
- —
- Monthly cashflow
- —
- DSCR
- —
- Eligible?
- —
No personal income docs; deal must DSCR.
Hard money
10% down · 12.0% · 12mo
- Down + closing
- —
- Monthly P&I
- —
- Monthly cashflow
- —
- DSCR
- —
- Eligible?
- —
Short-term bridge; refi at stabilization.
Rent comps 1 comps
| Address | Beds | Baths | Sqft | Rent | $/sqft | DOM | Units | Dist |
|---|---|---|---|---|---|---|---|---|
| 220 Potomac Dr Bldg 6 Findlay, OH | 3.0 | 2.5 | 1365 | $1,995 | $1.46 | 43d | 1 | 1.45mi |
Listing history 18 events
-
2026-06-19days on market $194,900 Active 56 DOM
-
2026-06-18days on market $194,900 Active 55 DOM
-
2026-06-17price $194,900 Active 54 DOM
-
2026-06-17days on market $199,900 Active 54 DOM
-
2026-06-16days on market $199,900 Active 53 DOM
-
2026-06-15days on market $199,900 Active 52 DOM
-
2026-06-14days on market $199,900 Active 50 DOM
-
2026-06-12days on market $199,900 Active 49 DOM
-
2026-06-09days on market $199,900 Active 46 DOM
-
2026-06-08days on market $199,900 Active 45 DOM
-
2026-06-07days on market $199,900 Active 44 DOM
-
2026-06-05days on market $199,900 Active 41 DOM
-
2026-06-02days on market $199,900 Active 39 DOM
-
2026-06-01days on market $199,900 Active 38 DOM
-
2026-05-31days on market $199,900 Active 37 DOM
-
2026-05-30days on market $199,900 Active 36 DOM
-
2026-04-22$204,900 Active 275-char remark
-
2022-03-31price $1,200
ⓘ Source: listings_history table (triggers on properties + properties_extension) + one-shot
backfill from property_details.listing_events for pre-trigger history.
Tax reassessment forecast OH · Partial reset (capped growth)
- Current annual tax
- $1,840 · $153/mo
- Projected year-2 tax
- $2,440 · $203/mo
- Expected delta
- +$600/yr (+$50/mo · 32.6%)
ⓘ Screening estimate from a state-policy table — verify with the county assessor before closing.
Climate risk First Street
- Flood 1/10 Low FEMA zone X (unshaded) · 0% chance over 30 yrs
- Wildfire 1/10 Low
- Heat 3/10 Moderate 7 d/yr ≥98°F today · 17 d/yr by 30 yrs out
- Wind 2/10 Low
- Air quality 2/10 Low 1 unhealthy d/yr today · 2 by 30 yrs out
Nearby sold comps map
Loading sold comps map…
Walkable amenities ~0.75 mi
Loading nearby amenities…
Taxation est. · year 1
- Rental income
- $23,263
- − Mortgage interest
- −$10,917
- − Property taxes
- −$1,840
- − Insurance
- −$974
- − Repairs & maintenance
- −$1,861
- − Management
- −$1,861
- − Depreciation
- −$5,670
- Taxable income
- $140
- Est. tax owed @ 24.0%
- −$33
- After-tax cash flow
- $3,265/yr
For passive investors: Depreciation is non-cash, so a rental often shows a tax loss while cash-flowing — sheltering income. Rental losses are passive: they offset passive income freely, and up to $25,000/yr can offset ordinary (W-2) income if you actively participate and your MAGI is under $100k (phasing out to $0 by $150k); unused losses carry forward. On sale, claimed depreciation is recaptured at up to 25%, and gains may owe capital-gains tax (a 1031 exchange can defer both). Figures are a year-1 estimate at your 24.0% rate — not tax advice; consult a CPA.
Schools (NCES district)
- District
- Findlay City
- NCES district ID
- 3910000
- Math proficiency
- 56% ▼ -11.00%
- Reading proficiency
- 56% ▼ -9.00%
- Median HH income
- $45,261
- Composite
- 47.31/100
- National rank
- #2300
- State rank
- #357 of 656 in OH
Livability — Findlay
- Score
- 81/100
- State rank
- #98
- US rank
- #1496
Category grades
Schools grade is shown separately in the Schools card above.
Census & demographics
- Census place
- Findlay, OH
- County
- Hancock County · 54,559 people
- City population
- 54,559
- Metro
- Findlay, OH
- Population (ZIP)
- 54,559
- Household income
- $68,083
- Rent vs Own
- Severe rent burden
- 1540.0
Population outlook (Hancock County) Hauer SSP2
- Today (2025)
- 77,526 people
- By 2030
- 77,777 · +0.3%
- By 2040
- 76,976 · -0.7%
- By 2050
- 74,479 · -3.9%
- By 2075
- 65,741 · -15.2%
- By 2100
- 52,942 · -31.7%
Race, ethnicity, and origin ACS 2023
- Neighborhood character
- Predominantly White (85%)
- Race & ethnicity
- White 85% Hispanic / Latino 6% Two or more races 5% Asian 2% Black 2%
- Hispanic origin (detail)
- Mexican 5%
- Common ancestry
- Romanian 3% Italian 2% Lithuanian 2%
- Foreign-born
- 4% · Canada, China
- Languages at home
- 94% English-only · Spanish 3% Other Asian/Pacific 1% Arabic 1%
Political lean MEDSL · Hancock
- 2024 margin
- Solid R (+38.4) · D 30.2% · R 68.7% · Other 1.1%
- 2008→2024 swing
- -15.3pp toward R · 2008: -23.1pp · 2024: -38.4pp
- All cycles
- 2024: R+38.4 2020: R+37.5 2016: R+40.8 2012: R+28.3 2008: R+23.1
Not yet ingested
- Civics
- —
Market trends
- HPI YoY
- ▼ -250.43%
- Current HPI
- 194.9132
- Rent YoY
- ▲ 5.68%
- Metro
- Findlay, OH
- State GDP YoY
- ▲ 1.98%
- F500 in state
- 48
Industry mix (Fortune 500 HQ in OH)
| Industry | F500 HQs | Revenue |
|---|---|---|
| Insurance | 3 | $145B |
|
||
| Industrial Machinery | 3 | $49B |
|
||
| Financial Services | 3 | $24B |
|
||
| Consumer Goods | 2 | $93B |
|
||
| Aerospace / Defense | 2 | $47B |
|
||
| Utilities | 2 | $33B |
|
||
Price history
+16141.7% since first listed4 events — show timeline
- 2026-06-17 Price Changed $194,900 NORIS
- 2026-05-20 Price Changed $199,900 NORIS
- 2026-04-22 Listed $204,900 NORIS
- 2022-03-31 Price Changed $1,200 RENT.
Property tax history
+5.7%/yrLatest (2025): $1,840 · +10.6% YoY. Source: county tax records.
Cash-flow waterfall
monthlySold comps — $/sqft
last 12 mo · ≤1 miLoading sold comps…