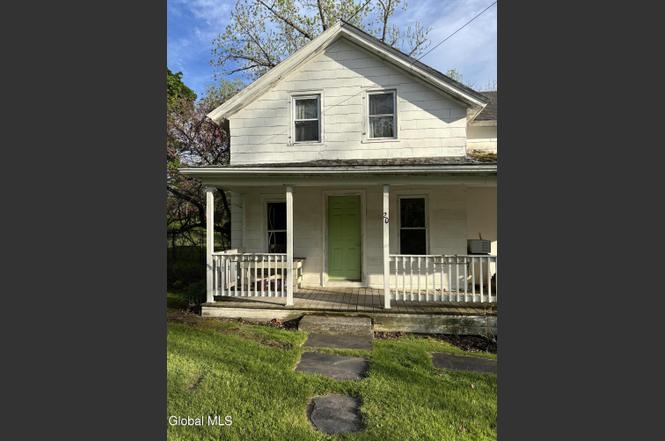
20 Dublin Hill Rd · Aurora, NY
Flood risk 1/10 · Minimal
- FEMA flood zone
- X (unshaded)
- Chance of flooding over 30 yrs
- 0.0%
- Est. flood insurance / yr
- $473 – $860
Fire risk 1/10 · Minimal
- Est. fire insurance / yr
- $691 – $1,283
Heat risk 3/10 · Minor
- Hot days now (above 96°F)
- 7 days/yr
- Hot days in 30 yrs
- 15 days/yr
Wind risk 1/10 · Minimal
- Chance of severe wind over 30 yrs
- 0.0%
Air-quality risk 2/10 · Minimal
- Unhealthy air days now
- 0 days/yr
- Unhealthy air days in 30 yrs
- 1 days/yr
Risk factors via First Street. Map © Google.
Why this score? — see what drove the B+ grade
The composite is a weighted blend of 9 inputs, each scored 0–100. Each bar is that input's sub-score; the figure is the points it added to the 100-point composite (weight × sub-score).
- Cash flow +30.0/30.0
- DSCR +10.0/10.0
- Appreciation +10.0/10.0
- 1% rule +9.6/10.0
- Schools +5.3/10.0
- Livability +3.4/5.0
- Rent growth +2.5/5.0
- Condition / age +2.5/5.0
- ARV discount +2.2/15.0
$180,000
🖨 Deal sheet 📄 Offer letter ✓ Due diligence
Listing remarks
Don't miss this opportunity to own a 2 bedroom/ 2 bathroom home very close to the eastern shoreline of Cayuga Lake at an affordable price! 20 Dublin Hill Road offers an opportunity to own a home in one of the Finger Lakes' most picturesque and sought-after destinations. Located in the historic village of Aurora, the property enjoys a peaceful setting with easy access to the lake, local attractions, and renowned wine country. While the home would benefit from some updating, it presents tremendous potential as a comfortable year-round residence, a weekend getaway, or a profitable short-term rental (if zoning allows). Whether you're looking for a home away from home or an investment property
Key facts
- Easy access to lake
- Local attractions
- 0.26 acre lot
Tags
Property features AI
Finance
- Other: Lot size about 0.26 acres (approx. 70 x 162 feet)
Exterior
- Parking: Detached or attached not specified — total 2 parking spaces, 2 garage spaces
- Utilities: Public water; Public sewer
- Home design: Single-family residence; Lot is level and cleared; Main road frontage about 70 feet
- Construction: Stone foundation; Construction materials: Other; Living area reported as 978
- Exterior features: Front porch
Interior
- Kitchen: Range; Refrigerator
- Bedrooms: Two bedrooms on the second floor
- Flooring: Wood flooring
- Bathrooms: Two full bathrooms (one on the first floor, one on the second floor)
- Heating & cooling: Has heating (type: Other)
- Interior features: Partial basement; Five total rooms
Neighborhood map
What this means for you Summary
Snapshot
- This is a 2-bed/2.0-bath single-family listed at $180k.
Deal economics
- At list price, monthly cash flow is $821 ($10k/yr) — positive.
- The deal already cash-flows at list — no discount required.
- Meets the 1% rule at list price ($3k rent vs $180k).
Location & tenants
- Location reads 68/100 on livability (#530 in NY) — a middle-class / working-renter tenant base. Strengths: employment A+, housing A+, schools B; Watch: cost of living D+, health & safety D, crime F.
- Southern Cayuga Central School District (rural): math 61% / reading 61% proficiency, ranked #214 of 590 in NY (top 36%) — acceptable for families but not a draw, mixed tenant base, ~2y average lease.
- Market conditions: 20 active listings in the ZIP; 161 units permitted in Cayuga County in 2024 (65 in 5+ unit buildings).
Forward outlook
- In year one you build about $19k of equity ($1k loan paydown + $18k appreciation (10.0% local appreciation)).
- Cayuga County population projected at -18% by 2050 — secular population decline; favor cash flow + early exit over multi-decade hold.
- At projected returns (10.0% appreciation + 3.0% rent growth), your $50k cash investment doubles in ~2 years — after that, you're playing with house money.
- By year 2, paydown + projected appreciation supports a ~$31k cash-out refi (75% LTV) — recoverable capital for the next deal without selling this one.
Negotiation context
- Only 3 days on market — expect competitive offers; lowballing is unlikely to land.
- Current owner paid $72k; list at $180k implies a 152% gain — meaningful room to come down on a strong offer.
Risks & watch-outs
- Watch-outs: built in 1850 — expect roof / HVAC / electrical / plumbing capex.
Questions for the listing agent
- Built in 1850 — when were the roof, HVAC, electrical panel, plumbing, and water heater last replaced?
- Is there a deadline driving the sale (1031 exchange, divorce, estate, relocation)? That informs how much negotiation room exists.
- Schools are B-rated — typically a magnet for longer-tenancy family renters. What's the average tenant stay here, and is there a school-zone premium baked into asking?
- Crime grade is F in this area — have there been break-ins, vandalism, or insurance claims at this property in the last 3 years? What carrier currently insures it and at what premium?
- What's the average days-on-market for RENTAL listings here right now (not sales)? A rising rental-DOM trend means longer vacancies and softer asking-rent achievability than the comps imply.
- What's the recent tenant-quality profile in this submarket — average credit score on applications, eviction rate, late-payment / NSF rate, and stable-employment percentage? A property-management company in the area should have these aggregated.
- How much new for-sale + rental construction is in the pipeline within 1–3 miles? Heavy new supply typically softens prices + rents 12–24 months out; constrained supply supports both.
Investment metrics
- 1% rule
- 1.46% ✓
- Cap rate
- 11.77%
- Cash-on-cash
- 19.54%
- DSCR
- 1.87
- GRM
- 5.7
CMA / ARV
- ARV (on-the-fly)
- $161,040
- Comps found
- 1
Show comp detail 1 sale within ~0.75 mi
| Address | Dist | Beds/Ba | Sqft | Sold | Price | $/sf | Match |
|---|---|---|---|---|---|---|---|
| 30 Wells Rd | 0.24mi | 2/1.0 | 908 (-7%) | 0mo | $150,000 | $165 | 73 |
Match score weights: distance 35% · size 25% · config 20% · recency 20%. Top-matched comps best support the ARV.
Projected returns pro-forma
10.0% appreciation · 3.0% rent growth · sell at horizon
- IRR
- 38.9%
- Equity multiple
- 3.98×
- Total profit
- $150,363
- Equity at exit
- $162,158
- IRR
- 33.5%
- Equity multiple
- 8.97×
- Total profit
- $401,783
- Equity at exit
- $349,700
Cash invested: $50,400 (down + closing). Projections, not guarantees.
Landlord ↔ Tenant lean methodology
- Overall (STATE)
- 15 Strongly Tenant-Friendly
- State New York
- 15 Strongly Tenant-Friendly · D+10
- County
- — inherits STATE
- City
- — inherits STATE
ZIP-level market 13026
- Home prices YoY
- 3.2%
- Active inventory
- 20
- Price-to-rent
- 5.7×
Monthly cashflow live
- Estimated rent
- $2,635 medium interval (Pro) →
- Mortgage (P&I)
- −$944
- Tax from tax record
- −$242 /mo · $2,905/yr
- Insurance
- −$75
- HOA
- −$0
- Vacancy / Maint / Mgmt
- −$553
- Net cashflow
- $821
Break-even live
UW: 25.0% down · 7.5% · 30yr · 1.5% tax · 5.0% vac · 8.0% maint · 8.0% mgmt
Financing live
Cash to close
- Down payment
- $45,000
- Closing costs
- $5,400
- Reserves months
- —
- Total cash needed
- —
Loan-product check · same deal, 3 products live
Conventional
25% down · 7.5% · 30yr
- Down + closing
- —
- Monthly P&I
- —
- Monthly cashflow
- —
- DSCR
- —
- Eligible?
- —
Personal DTI + credit; lowest rate.
DSCR
20% down · 8.5% · 30yr
- Down + closing
- —
- Monthly P&I
- —
- Monthly cashflow
- —
- DSCR
- —
- Eligible?
- —
No personal income docs; deal must DSCR.
Hard money
10% down · 12.0% · 12mo
- Down + closing
- —
- Monthly P&I
- —
- Monthly cashflow
- —
- DSCR
- —
- Eligible?
- —
Short-term bridge; refi at stabilization.
Listing history 4 events
-
2026-06-19days on market $180,000 Active 3 DOM
-
2026-06-18days on market $180,000 Active 2 DOM
-
2026-06-17remarks 699-char remark
-
2026-06-17$180,000 Active 1 DOM
ⓘ Source: listings_history table (triggers on properties + properties_extension) + one-shot
backfill from property_details.listing_events for pre-trigger history.
Tax reassessment forecast NY · Partial reset (capped growth)
- Current annual tax
- $2,905 · $242/mo
- Projected year-2 tax
- $2,974 · $248/mo
- Expected delta
- +$68/yr (+$6/mo · 2.4%)
ⓘ Screening estimate from a state-policy table — verify with the county assessor before closing.
Climate risk First Street
- Flood 1/10 Low FEMA zone X (unshaded) · 0% chance over 30 yrs
- Wildfire 1/10 Low
- Heat 3/10 Moderate 7 d/yr ≥96°F today · 15 d/yr by 30 yrs out
- Wind 1/10 Low 0% chance of damaging wind over 30 yrs
- Air quality 2/10 Low 0 unhealthy d/yr today · 1 by 30 yrs out
Nearby sold comps map
Loading sold comps map…
Walkable amenities ~0.75 mi
Loading nearby amenities…
Taxation est. · year 1
- Rental income
- $31,624
- − Mortgage interest
- −$10,083
- − Property taxes
- −$2,905
- − Insurance
- −$900
- − Repairs & maintenance
- −$2,530
- − Management
- −$2,530
- − Depreciation
- −$5,236
- Taxable income
- $7,440
- Est. tax owed @ 24.0%
- −$1,785
- After-tax cash flow
- $8,065/yr
For passive investors: Depreciation is non-cash, so a rental often shows a tax loss while cash-flowing — sheltering income. Rental losses are passive: they offset passive income freely, and up to $25,000/yr can offset ordinary (W-2) income if you actively participate and your MAGI is under $100k (phasing out to $0 by $150k); unused losses carry forward. On sale, claimed depreciation is recaptured at up to 25%, and gains may owe capital-gains tax (a 1031 exchange can defer both). Figures are a year-1 estimate at your 24.0% rate — not tax advice; consult a CPA.
Schools (NCES district)
- District
- Southern Cayuga Central School District
- NCES district ID
- 3627570
- Math proficiency
- 61% ▬ 0.00%
- Reading proficiency
- 61% ▲ 7.00%
- Median HH income
- $61,177
- Composite
- 52.98/100
- National rank
- #1524
- State rank
- #214 of 590 in NY
Livability — Aurora
- Score
- 68/100
- State rank
- #530
- US rank
- #9549
Category grades
Schools grade is shown separately in the Schools card above.
Census & demographics
- Census place
- Aurora, NY
- Population (ZIP)
- 1,703
Population outlook (Cayuga County) Hauer SSP2
- Today (2025)
- 74,820 people
- By 2030
- 72,402 · -3.2%
- By 2040
- 66,917 · -10.6%
- By 2050
- 61,007 · -18.5%
- By 2075
- 48,047 · -35.8%
- By 2100
- 34,512 · -53.9%
Race, ethnicity, and origin ACS 2023
- Neighborhood character
- Predominantly White (89%)
- Race & ethnicity
- White 89% Hispanic / Latino 6% Two or more races 4%
- Hispanic origin (detail)
- Mexican 1%
- Common ancestry
- Romanian 3% Lithuanian 3% Subsaharan African 2%
- Foreign-born
- 2% · Canada, Jamaica
- Languages at home
- 95% English-only · Spanish 4% Other Indo-European 1%
Political lean MEDSL · Cayuga
- 2024 margin
- R (+13.0) · D 43.5% · R 56.5%
- 2008→2024 swing
- -21.5pp toward R · 2008: 8.5pp · 2024: -13.0pp
- All cycles
- 2024: R+13.0 2020: R+9.2 2016: R+13.2 2012: D+10.8 2008: D+8.5
Not yet ingested
- Civics
- —
Market trends
- HPI YoY
- ▲ 12.77%
- Current HPI
- 410.3875
- Rent YoY
- —
- Metro
- —
- State GDP YoY
- ▲ 2.60%
- F500 in state
- 92
Industry mix (Fortune 500 HQ in NY)
| Industry | F500 HQs | Revenue |
|---|---|---|
| Financial Services | 10 | $950B |
|
||
| Consumer Goods | 9 | $162B |
|
||
| Insurance | 4 | $225B |
|
||
| Telecommunications | 2 | $144B |
|
||
| Pharmaceuticals | 2 | $112B |
|
||
| Media / Entertainment | 2 | $69B |
|
||
Price history
+400.0% since first listed3 events — show timeline
- 2026-06-15 Listed $180,000 Global MLS
- 2002-10-18 Sold (Public Records) $71,500 Public Records
- 1994-04-14 Sold (Public Records) $36,000 Public Records
Property tax history
+3.1%/yrLatest (2025): $2,905 · +3.3% YoY. Source: county tax records.
Cash-flow waterfall
monthlySold comps — $/sqft
last 12 mo · ≤1 miLoading sold comps…