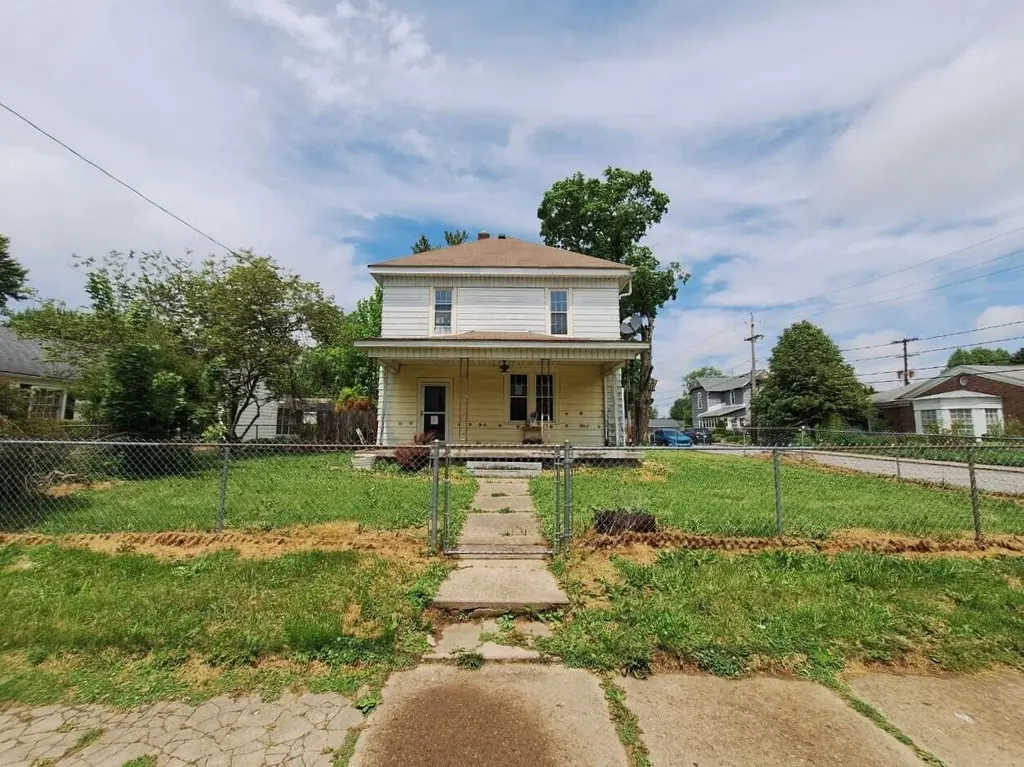
804 High St · Middletown, IN
Flood risk 1/10 · Minimal
- FEMA flood zone
- X (unshaded)
- Chance of flooding over 30 yrs
- 0.0%
- Est. flood insurance / yr
- $473 – $860
Fire risk 1/10 · Minimal
- Est. fire insurance / yr
- $717 – $1,331
Heat risk 3/10 · Minor
- Hot days now (above 99°F)
- 7 days/yr
- Hot days in 30 yrs
- 18 days/yr
Wind risk 2/10 · Minimal
- Chance of severe wind over 30 yrs
- 1.0%
Air-quality risk 3/10 · Minor
- Unhealthy air days now
- 2 days/yr
- Unhealthy air days in 30 yrs
- 4 days/yr
Risk factors via First Street. Map © Google.
Why this score? — see what drove the B- grade
The composite is a weighted blend of 9 inputs, each scored 0–100. Each bar is that input's sub-score; the figure is the points it added to the 100-point composite (weight × sub-score).
- Cash flow +30.0/30.0
- 1% rule +10.0/10.0
- DSCR +10.0/10.0
- ARV discount +7.5/15.0
- Schools +3.6/10.0
- Livability +3.4/5.0
- Rent growth +2.5/5.0
- Condition / age +2.5/5.0
- Appreciation +0.0/10.0
$59,900
🖨 Deal sheet 📄 Offer letter ✓ Due diligence
Listing remarks
Expand or jumpstart your real estate portfolio with this prime investment opportunity where the true value lies in the land with no Major work needed. Centrally located in Middletown, this property features a spacious footprint originally configured as a 2 story, 3-bedroom, 2-bathroom home. This is a true blank canvas for ambitious renovators looking to create a custom masterpiece from the ground up. Future residents will love the convenience of this location, with easy access to local shopping, diverse restaurants, medical and civic facilities, public transportation, and major highways.
Key facts
- Spacious footprint
- Diverse restaurants
- Major highways
Tags
Property features AI
Finance
- Other: Living area estimated at 1,792 (above grade finished area); Main and upper levels each approx. 896 finished
- Financial info: Occupant status: Vacant
- HOA & community: No HOA information listed
Exterior
- Parking: Detached garage; 2 garage spaces
- Security: No security features listed
- Utilities: Public water; Public sewer
- Home design: Two-story house; Built in 1900; Property listed as fixer
- Construction: Has basement (unfinished)
- Exterior features: Neighborhood view; Public water; Public sewer
Interior
- Kitchen: No appliances listed
- Bedrooms: Primary bedroom; Bedroom 2; Bedroom 3
- Flooring: No flooring details listed
- Bathrooms: 2 full bathrooms
- Heating & cooling: Natural gas heating; No cooling
- Interior features: No notable interior features listed; Unfinished basement
- Laundry & utility: No laundry details listed
Neighborhood map
What this means for you Summary
Snapshot
- This is a 3-bed/2.0-bath single-family listed at $60k.
Deal economics
- At list price, monthly cash flow is $603 ($7k/yr) — positive.
- The deal already cash-flows at list — no discount required.
- Meets the 1% rule at list price ($1k rent vs $60k).
- Recommended offer: $59k (1.5% below list) — sets the bar for market timing.
- Cap rate 18.4% vs local median 5.2% in Middletown — top-decile yield for the area; either an underpriced asset or a hidden risk that comps aren't pricing in. Stress-test before assuming the spread holds.
Location & tenants
- Location reads 67/100 on livability (#235 in IN) — a middle-class / working-renter tenant base. Strengths: crime A+, cost of living A+, housing A+; Watch: schools C-, amenities F, commute F.
- Shenandoah School Corporation (rural): math 38% / reading 46% proficiency, ranked #118 of 301 in IN (top 39%) — families likely to look elsewhere, expect single-tenant / working-renter base with shorter leases.
- Market conditions: 35 active listings in the ZIP; 47 units permitted in Henry County in 2024 (0 in 5+ unit buildings).
Forward outlook
- Local home prices are declining (-3.0%/yr); year-one equity from $414 of loan paydown is wiped out by about $2k of value loss. Plan a longer hold.
- Henry County population projected at -12% by 2050 — secular population decline; favor cash flow + early exit over multi-decade hold.
- At projected returns (-3.0% appreciation + 3.0% rent growth), your $17k cash investment doubles in ~3 years — after that, you're playing with house money.
Negotiation context
- It's been on market 27 days — a 2% lower offer ($59k) is reasonable based on typical stale-listing flexibility.
Risks & watch-outs
- Watch-outs: built in 1900 — expect roof / HVAC / electrical / plumbing capex.
Questions for the listing agent
- Built in 1900 — when were the roof, HVAC, electrical panel, plumbing, and water heater last replaced?
- Is there a deadline driving the sale (1031 exchange, divorce, estate, relocation)? That informs how much negotiation room exists.
- What's the average days-on-market for RENTAL listings here right now (not sales)? A rising rental-DOM trend means longer vacancies and softer asking-rent achievability than the comps imply.
- What's the recent tenant-quality profile in this submarket — average credit score on applications, eviction rate, late-payment / NSF rate, and stable-employment percentage? A property-management company in the area should have these aggregated.
- How much new for-sale + rental construction is in the pipeline within 1–3 miles? Heavy new supply typically softens prices + rents 12–24 months out; constrained supply supports both.
Investment metrics
- 1% rule
- 2.21% ✓
- Cap rate
- 18.37%
- Cash-on-cash
- 43.12%
- DSCR
- 2.92
- GRM
- 3.8
CMA / ARV
- ARV (on-the-fly)
- $188,160
- Comps found
- 12
Show comp detail 12 sales within ~0.75 mi
| Address | Dist | Beds/Ba | Sqft | Sold | Price | $/sf | Match |
|---|---|---|---|---|---|---|---|
| 379 Locust St | 0.35mi | 3/1.0 | 1,796 (+0%) | 6mo | $134,900 | $75 | 75 |
| 309 N 8th St | 0.09mi | 3/1.0 | 1,615 (-10%) | 5mo | $55,000 | $34 | 72 |
| 511 N 12th St | 0.47mi | 3/2.0 | 1,764 (-2%) | 8mo | $254,900 | $145 | 68 |
| 127 N 8th St | 0.08mi | 2/1.0 (-1) | 1,678 (-6%) | 10mo | $165,000 | $98 | 68 |
| 482 N 7th St | 0.21mi | 3/1.0 | 1,913 (+7%) | 10mo | $179,900 | $94 | 67 |
| 1144 Cottage Ave | 0.33mi | 3/1.0 | 1,852 (+3%) | 10mo | $160,000 | $86 | 66 |
| 815 Maple St | 0.30mi | 3/2.0 | 2,010 (+12%) | 5mo | $220,000 | $109 | 61 |
| 975 Locust St | 0.27mi | 3/2.0 | 1,988 (+11%) | 10mo | $208,000 | $105 | 61 |
| 683 N 5th St | 0.45mi | 4/2.0 (+1) | 1,968 (+10%) | 2mo | $229,000 | $116 | 56 |
| 663 N 5th St | 0.42mi | 3/1.0 | 1,624 (-9%) | 10mo | $173,000 | $107 | 53 |
| 1485 Locust St | 0.66mi | 3/1.0 | 1,699 (-5%) | 7mo | $194,000 | $114 | 51 |
| 1256 Locust St | 0.44mi | 4/2.0 (+1) | 1,547 (-14%) | 10mo | $129,900 | $84 | 43 |
Match score weights: distance 35% · size 25% · config 20% · recency 20%. Top-matched comps best support the ARV.
Projected returns pro-forma
-3.0% appreciation · 3.0% rent growth · sell at horizon
- IRR
- 40.0%
- Equity multiple
- 2.71×
- Total profit
- $28,715
- Equity at exit
- $8,931
- IRR
- 46.3%
- Equity multiple
- 5.45×
- Total profit
- $74,580
- Equity at exit
- $5,179
Cash invested: $16,772 (down + closing). Projections, not guarantees.
Landlord ↔ Tenant lean methodology
- Overall (STATE)
- 90 Strongly Landlord-Friendly
- State Indiana
- 90 Strongly Landlord-Friendly · R+11
- County
- — inherits STATE
- City
- — inherits STATE
ZIP-level market 47356
- Home prices YoY
- -18.9%
- Active inventory
- 35
- Price-to-rent
- 3.8×
Monthly cashflow live
- Estimated rent
- $1,321 medium interval (Pro) →
- Mortgage (P&I)
- −$314
- Tax from tax record
- −$102 /mo · $1,223/yr
- Insurance
- −$25
- HOA
- −$0
- Vacancy / Maint / Mgmt
- −$277
- Net cashflow
- $603
Break-even live
UW: 25.0% down · 7.5% · 30yr · 1.5% tax · 5.0% vac · 8.0% maint · 8.0% mgmt
Financing live
Cash to close
- Down payment
- $14,975
- Closing costs
- $1,797
- Reserves months
- —
- Total cash needed
- —
Loan-product check · same deal, 3 products live
Conventional
25% down · 7.5% · 30yr
- Down + closing
- —
- Monthly P&I
- —
- Monthly cashflow
- —
- DSCR
- —
- Eligible?
- —
Personal DTI + credit; lowest rate.
DSCR
20% down · 8.5% · 30yr
- Down + closing
- —
- Monthly P&I
- —
- Monthly cashflow
- —
- DSCR
- —
- Eligible?
- —
No personal income docs; deal must DSCR.
Hard money
10% down · 12.0% · 12mo
- Down + closing
- —
- Monthly P&I
- —
- Monthly cashflow
- —
- DSCR
- —
- Eligible?
- —
Short-term bridge; refi at stabilization.
Listing history 18 events
-
2026-06-19days on market $59,900 Active 27 DOM
-
2026-06-18days on market $59,900 Active 26 DOM
-
2026-06-17days on market $59,900 Active 25 DOM
-
2026-06-16days on market $59,900 Active 24 DOM
-
2026-06-15days on market $59,900 Active 23 DOM
-
2026-06-14days on market $59,900 Active 21 DOM
-
2026-06-13price $59,900 Active 20 DOM
-
2026-06-12days on market $75,499 Active 20 DOM
-
2026-06-09days on market $75,499 Active 17 DOM
-
2026-06-08days on market $75,499 Active 16 DOM
-
2026-06-07pricedays on market $75,499 Active 15 DOM
-
2026-06-05days on market $82,499 Active 12 DOM
-
2026-06-03days on market $82,499 Active 11 DOM
-
2026-06-02pricedays on market $82,499 Active 10 DOM
-
2026-06-01days on market $92,499 Active 9 DOM
-
2026-05-31days on market $92,499 Active 8 DOM
-
2026-05-30days on market $92,499 Active 7 DOM
-
2026-05-23$92,499 Active
ⓘ Source: listings_history table (triggers on properties + properties_extension) + one-shot
backfill from property_details.listing_events for pre-trigger history.
Tax reassessment forecast IN · Partial reset (capped growth)
- Current annual tax
- $1,223 · $102/mo
- Projected year-2 tax
- $1,223 · $102/mo
- Expected delta
- $0/yr ($0/mo · 0.0%)
ⓘ Screening estimate from a state-policy table — verify with the county assessor before closing.
Climate risk First Street
- Flood 1/10 Low FEMA zone X (unshaded) · 0% chance over 30 yrs
- Wildfire 1/10 Low
- Heat 3/10 Moderate 7 d/yr ≥99°F today · 18 d/yr by 30 yrs out
- Wind 2/10 Low 100% chance of damaging wind over 30 yrs
- Air quality 3/10 Moderate 2 unhealthy d/yr today · 4 by 30 yrs out
Nearby sold comps map
Loading sold comps map…
Walkable amenities ~0.75 mi
Loading nearby amenities…
Taxation est. · year 1
- Rental income
- $15,853
- − Mortgage interest
- −$3,355
- − Property taxes
- −$1,223
- − Insurance
- −$300
- − Repairs & maintenance
- −$1,268
- − Management
- −$1,268
- − Depreciation
- −$1,743
- Taxable income
- $6,696
- Est. tax owed @ 24.0%
- −$1,607
- After-tax cash flow
- $5,625/yr
For passive investors: Depreciation is non-cash, so a rental often shows a tax loss while cash-flowing — sheltering income. Rental losses are passive: they offset passive income freely, and up to $25,000/yr can offset ordinary (W-2) income if you actively participate and your MAGI is under $100k (phasing out to $0 by $150k); unused losses carry forward. On sale, claimed depreciation is recaptured at up to 25%, and gains may owe capital-gains tax (a 1031 exchange can defer both). Figures are a year-1 estimate at your 24.0% rate — not tax advice; consult a CPA.
Schools (NCES district)
- District
- Shenandoah School Corporation
- NCES district ID
- 1808280
- Math proficiency
- 38% ▼ -15.00%
- Reading proficiency
- 46% ▼ -9.00%
- Median HH income
- $50,961
- Composite
- 36.22/100
- National rank
- #4723
- State rank
- #118 of 301 in IN
Livability — Middletown
- Score
- 67/100
- State rank
- #235
- US rank
- #10188
Category grades
Schools grade is shown separately in the Schools card above.
Census & demographics
- Census place
- Middletown, IN
- Population (ZIP)
- 5,508
Population outlook (Henry County) Hauer SSP2
- Today (2025)
- 48,028 people
- By 2030
- 47,125 · -1.9%
- By 2040
- 44,820 · -6.7%
- By 2050
- 42,207 · -12.1%
- By 2075
- 35,814 · -25.4%
- By 2100
- 26,779 · -44.2%
Race, ethnicity, and origin ACS 2023
- Neighborhood character
- Predominantly White (90%)
- Race & ethnicity
- White 90% Two or more races 5% Hispanic / Latino 3% Black 2%
- Common ancestry
- Serbian 3% Iranian 2% Slovak 2%
- Foreign-born
- 2%
- Languages at home
- 99% English-only · Spanish 1%
Political lean MEDSL · Henry
- 2024 margin
- Solid R (+47.7) · D 25.3% · R 73.0% · Other 1.7%
- 2008→2024 swing
- -43.8pp toward R · 2008: -3.9pp · 2024: -47.7pp
- All cycles
- 2024: R+47.7 2020: R+45.2 2016: R+43.7 2012: R+17.0 2008: R+3.9
Not yet ingested
- Civics
- —
Market trends
- HPI YoY
- ▼ -55.87%
- Current HPI
- 240.0691
- Rent YoY
- —
- Metro
- —
- State GDP YoY
- ▲ 2.90%
- F500 in state
- 18
Industry mix (Fortune 500 HQ in IN)
| Industry | F500 HQs | Revenue |
|---|---|---|
| Industrial Machinery | 2 | $37B |
|
||
| Healthcare | 1 | $177B |
|
||
| Pharmaceuticals | 1 | $45B |
|
||
| Metals / Steel | 1 | $18B |
|
||
| Agriculture | 1 | $17B |
|
||
| Packaging | 1 | $12B |
|
||
Price history
1 event — show timeline
- 2026-05-23 Listed $92,499 NIRA MLS as Distributed by MLS Grid
Property tax history
+4.9%/yrLatest (2024): $1,223 · +26.4% YoY. Source: county tax records.
Cash-flow waterfall
monthlySold comps — $/sqft
last 12 mo · ≤1 miLoading sold comps…