 🏷️ Likely Rental
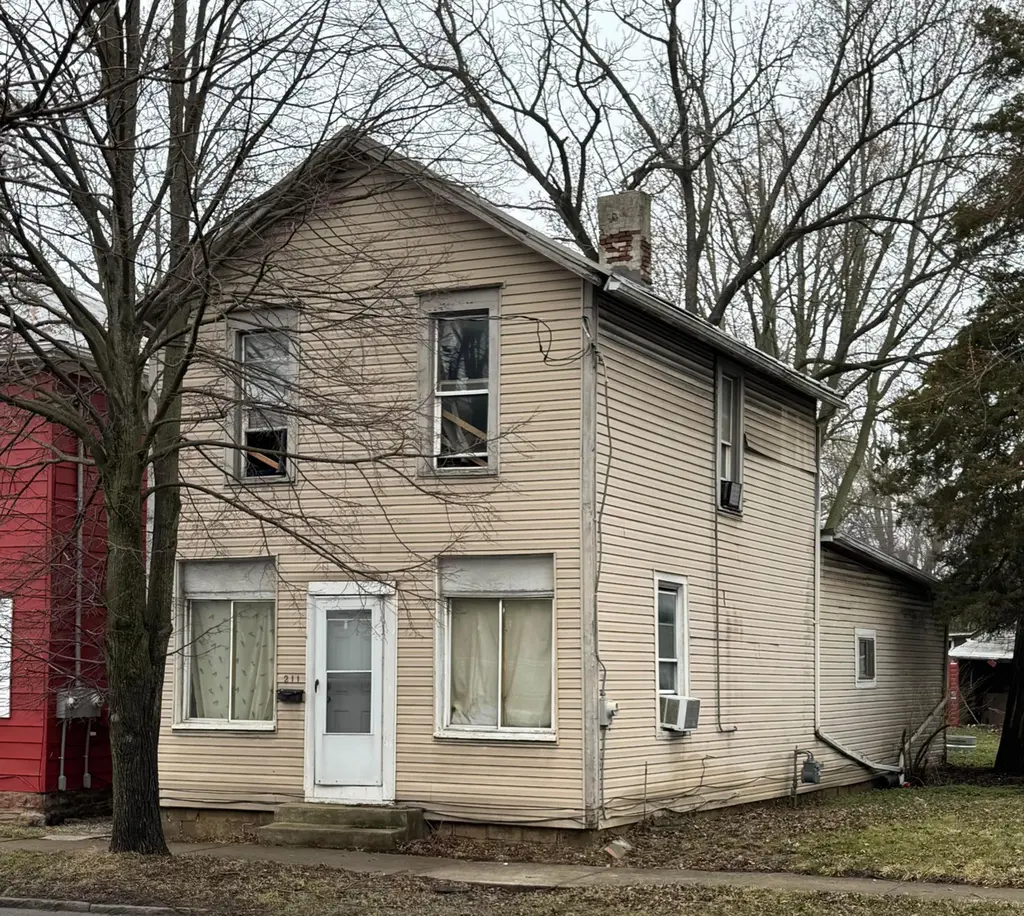
211 E Central Ave · Delaware, OH
Flood risk 1/10 · Minimal
- FEMA flood zone
- X (unshaded)
- Chance of flooding over 30 yrs
- 0.0%
- Est. flood insurance / yr
- $473 – $860
Fire risk 1/10 · Minimal
- Est. fire insurance / yr
- $713 – $1,323
Heat risk 3/10 · Minor
- Hot days now (above 100°F)
- 7 days/yr
- Hot days in 30 yrs
- 18 days/yr
Wind risk 2/10 · Minimal
- Chance of severe wind over 30 yrs
- 0.0%
Air-quality risk 2/10 · Minimal
- Unhealthy air days now
- 1 days/yr
- Unhealthy air days in 30 yrs
- 2 days/yr
Risk factors via First Street. Map © Google.
Why this score? — see what drove the B- grade
The composite is a weighted blend of 9 inputs, each scored 0–100. Each bar is that input's sub-score; the figure is the points it added to the 100-point composite (weight × sub-score).
- Cash flow +24.1/30.0
- ARV discount +15.0/15.0
- DSCR +7.8/10.0
- 1% rule +5.7/10.0
- Schools +4.7/10.0
- Livability +4.0/5.0
- Rent growth +2.9/5.0
- Condition / age +2.5/5.0
- Appreciation +0.0/10.0
$194,500
🖨 Deal sheet 📄 Offer letter ✓ Due diligence
Listing remarks MLS
Investor opportunity. This home is the be purchased in ''AS-IS' condtion. Tenant in place.
Key facts
- 3,049 sq ft lot
- Built 1901
- Listed 65 days
Neighborhood map
What this means for you Summary
Snapshot
- This is a 4-bed/1.5-bath single-family listed at $194k.
Deal economics
- At list price, monthly cash flow is $385 ($5k/yr) — positive.
- The deal already cash-flows at list — no discount required.
- Meets the 1% rule at list price ($2k rent vs $194k).
- Recommended offer: $183k (6.0% below list) — sets the bar for market timing.
- Cap rate 8.7% vs local median 2.5% in Delaware — top-decile yield for the area; either an underpriced asset or a hidden risk that comps aren't pricing in. Stress-test before assuming the spread holds.
Location & tenants
- Location reads 80/100 on livability (#116 in OH, #1,717 nationally) — a professional / high-income tenant draw. Strengths: cost of living A+, housing A+, schools A; Watch: amenities C-, commute F.
- Delaware City (suburban): math 47% / reading 63% proficiency, ranked #355 of 656 in OH (top 54%) — acceptable for families but not a draw, mixed tenant base, ~2y average lease.
- Market conditions: Rents rising (+1.4%/yr); 499 active listings in the ZIP; 6 comparable units currently listed for rent nearby; rentals at typical pace (median 17d on market — plan ~3-4 weeks tenant-placement turnaround); solid renter incomes; 2,233 units permitted in Delaware County in 2024 (304 in 5+ unit buildings).
Forward outlook
- Local home prices are declining (-3.0%/yr); year-one equity from $1k of loan paydown is wiped out by about $6k of value loss. Plan a longer hold.
- Delaware County population projected at +37% by 2050 — long-run rental-demand tailwind backs the buy-and-hold thesis.
Negotiation context
- It's been on market 65 days — a 6% lower offer ($183k) is reasonable based on typical stale-listing flexibility.
- 3 sale attempts since 29y ago; this cycle's ask has dropped $16k (7%) from the opening price — seller is motivated, your offer sets the floor, not the list.
- Current owner paid $125k; list at $194k implies a 56% gain — meaningful room to come down on a strong offer.
Risks & watch-outs
- Watch-outs: built in 1901 — expect roof / HVAC / electrical / plumbing capex.
Questions for the listing agent
- It's been on market 65 days. Have you received any prior offers? Is the seller open to a 6% concession, seller financing, or rate buy-down credit?
- Built in 1901 — when were the roof, HVAC, electrical panel, plumbing, and water heater last replaced?
- Why hasn't it sold? Are there any deal-killer items the seller is aware of (foundation, flood, title, zoning, code violations)?
- Is there a deadline driving the sale (1031 exchange, divorce, estate, relocation)? That informs how much negotiation room exists.
- Schools are A-rated — typically a magnet for longer-tenancy family renters. What's the average tenant stay here, and is there a school-zone premium baked into asking?
- What's the average days-on-market for RENTAL listings here right now (not sales)? A rising rental-DOM trend means longer vacancies and softer asking-rent achievability than the comps imply.
- What's the recent tenant-quality profile in this submarket — average credit score on applications, eviction rate, late-payment / NSF rate, and stable-employment percentage? A property-management company in the area should have these aggregated.
- How much new for-sale + rental construction is in the pipeline within 1–3 miles? Heavy new supply typically softens prices + rents 12–24 months out; constrained supply supports both.
Investment metrics
- 1% rule
- 1.07% ✓
- Cap rate
- 8.67%
- Cash-on-cash
- 8.48%
- DSCR
- 1.38
- GRM
- 7.8
CMA / ARV
- ARV (median comp)
- $254,267
- List price
- $194,500
- Delta
- -23.51%
- Verdict
- UNDERPRICED
- Comps
- 20 within 1.0 mi
Show comp detail 12 sales within ~0.75 mi
| Address | Dist | Beds/Ba | Sqft | Sold | Price | $/sf | Match |
|---|---|---|---|---|---|---|---|
| 224 E Central Ave | 0.05mi | 3/1.5 (-1) | 1,350 (-1%) | 9mo | $288,000 | $213 | 83 |
| 229 E William St | 0.15mi | 3/1.0 (-1) | 1,425 (+4%) | 7mo | $225,000 | $158 | 73 |
| 213 Lake St | 0.31mi | 3/1.0 (-1) | 1,364 (-0%) | 7mo | $220,000 | $161 | 72 |
| 356 E Central Ave | 0.30mi | 3/2.0 (-1) | 1,320 (-4%) | 8mo | $265,000 | $201 | 67 |
| 66 Joy Ave | 0.46mi | 3/1.0 (-1) | 1,392 (+2%) | 3mo | $255,000 | $183 | 66 |
| 51 Reid St | 0.23mi | 3/2.0 (-1) | 1,296 (-5%) | 9mo | $275,000 | $212 | 66 |
| 63 Joy Ave | 0.49mi | 3/1.5 (-1) | 1,384 (+1%) | 6mo | $215,000 | $155 | 65 |
| 6 Wade St | 0.30mi | 3/1.5 (-1) | 1,242 (-9%) | 2mo | $190,000 | $153 | 64 |
| 10 Delta St | 0.26mi | 3/1.5 (-1) | 1,280 (-6%) | 10mo | $200,000 | $156 | 64 |
| 126 Wilder St | 0.43mi | 3/2.0 (-1) | 1,440 (+5%) | 3mo | $381,500 | $265 | 62 |
| 85 Blymer St | 0.63mi | 3/2.0 (-1) | 1,454 (+6%) | 5mo | $284,900 | $196 | 49 |
| 353 N Union St | 0.74mi | 3/2.5 (-1) | 1,569 (+15%) | 1mo | $341,000 | $217 | 31 |
Match score weights: distance 35% · size 25% · config 20% · recency 20%. Top-matched comps best support the ARV.
Projected returns pro-forma
-3.0% appreciation · 1.42% rent growth · sell at horizon
- IRR
- -5.1%
- Equity multiple
- 0.81×
- Total profit
- $-10,287
- Equity at exit
- $29,001
- IRR
- 2.6%
- Equity multiple
- 1.18×
- Total profit
- $9,575
- Equity at exit
- $16,817
Cash invested: $54,460 (down + closing). Projections, not guarantees.
Landlord ↔ Tenant lean methodology
- Overall (STATE)
- 73 Landlord-Friendly
- State Ohio
- 73 Landlord-Friendly · R+6
- County
- — inherits STATE
- City
- — inherits STATE
ZIP-level market 43015
- Rents YoY
- 1.4%
- Active inventory
- 499
- Price-to-rent
- 7.8×
Monthly cashflow live
- Estimated rent
- $2,079 high interval (Pro) →
- Mortgage (P&I)
- −$1,020
- Tax from tax record
- −$157 /mo · $1,881/yr
- Insurance
- −$81
- HOA
- −$0
- Vacancy / Maint / Mgmt
- −$437
- Net cashflow
- $385
Break-even live
UW: 25.0% down · 7.5% · 30yr · 1.5% tax · 5.0% vac · 8.0% maint · 8.0% mgmt
Financing live
Cash to close
- Down payment
- $48,625
- Closing costs
- $5,835
- Reserves months
- —
- Total cash needed
- —
Loan-product check · same deal, 3 products live
Conventional
25% down · 7.5% · 30yr
- Down + closing
- —
- Monthly P&I
- —
- Monthly cashflow
- —
- DSCR
- —
- Eligible?
- —
Personal DTI + credit; lowest rate.
DSCR
20% down · 8.5% · 30yr
- Down + closing
- —
- Monthly P&I
- —
- Monthly cashflow
- —
- DSCR
- —
- Eligible?
- —
No personal income docs; deal must DSCR.
Hard money
10% down · 12.0% · 12mo
- Down + closing
- —
- Monthly P&I
- —
- Monthly cashflow
- —
- DSCR
- —
- Eligible?
- —
Short-term bridge; refi at stabilization.
Rent comps 6 comps
| Address | Beds | Baths | Sqft | Rent | $/sqft | DOM | Units | Dist |
|---|---|---|---|---|---|---|---|---|
| 22 Estelle St Delaware, OH | 3.0 | 1.0 | 1150 | $1,650 | $1.43 | 10d | 1 | 0.25mi |
| 6 Wade St Delaware, OH | 3.0 | 1.5 | 1242 | $2,100 | $1.69 | 7d | 1 | 0.32mi |
| 1 Mossy Grove LN Delaware, OH | 1.0–3.0 | 1.0–2.5 | 1022 | $2,250 | $2.20 | 1d | 47 | 0.50mi |
| 253 S Liberty St Unit 8 Delaware, OH | 3.0 | 1.5 | 1200 | $1,475 | $1.23 | 23d | 1 | 1.10mi |
| 253 S Liberty St Delaware, OH | 3.0 | 1.0 | 1200 | $1,475 | $1.23 | 23d | 1 | 1.10mi |
| 526 Rochdale Run Delaware, OH | 3.0 | 2.5 | 1600 | $2,299 | $1.44 | 17d | 1 | 1.13mi |
Listing history 23 events
-
2026-06-18days on market $194,500 Active 65 DOM
-
2026-06-17days on market $194,500 Active 64 DOM
-
2026-06-16days on market $194,500 Active 63 DOM
-
2026-06-15days on market $194,500 Active 62 DOM
-
2026-06-13days on market $194,500 Active 60 DOM
-
2026-06-09days on market $194,500 Active 56 DOM
-
2026-06-08days on market $194,500 Active 55 DOM
-
2026-06-07days on market $194,500 Active 54 DOM
-
2026-06-03days on market $194,500 Active 50 DOM
-
2026-06-02days on market $194,500 Active 49 DOM
-
2026-06-01days on market $194,500 Active 48 DOM
-
2026-05-31days on market $194,500 Active 47 DOM
-
2026-05-15price $194,500 90-char remark
Show marketing remark (90 chars)
Investor opportunity. This home is the be purchased in ''AS-IS' condtion. Tenant in place.
-
2026-04-24status Active 90-char remark
Show marketing remark (90 chars)
Investor opportunity. This home is the be purchased in ''AS-IS' condtion. Tenant in place.
-
2026-04-24price $199,500 90-char remark
Show marketing remark (90 chars)
Investor opportunity. This home is the be purchased in ''AS-IS' condtion. Tenant in place.
-
2026-03-16historical 90-char remark
Show marketing remark (90 chars)
Investor opportunity. This home is the be purchased in ''AS-IS' condtion. Tenant in place.
-
2026-03-06$210,000 Active 90-char remark
Show marketing remark (90 chars)
Investor opportunity. This home is the be purchased in ''AS-IS' condtion. Tenant in place.
-
2007-04-19soldstatus $125,000
-
1998-01-08soldstatus $23,000
-
1997-12-01soldstatus $23,000 235-char remark
Show marketing remark (235 chars)
THIS HOME TO BE PURCHASED IN ''AS IS'' CONDITION. HOME HAS BEEN USED AS ARENTAL FOR THE PAST EIGHT YEARS. $410 A MONTH. FURNACE - HOT WATER TANK AREEIGHT YEARS OLD. LOTS OF POTENTIAL. THIS WILL GO FAST - - - DON'T HESITATE. CALL TODAY!
-
1997-11-19historical 235-char remark
Show marketing remark (235 chars)
THIS HOME TO BE PURCHASED IN ''AS IS'' CONDITION. HOME HAS BEEN USED AS ARENTAL FOR THE PAST EIGHT YEARS. $410 A MONTH. FURNACE - HOT WATER TANK AREEIGHT YEARS OLD. LOTS OF POTENTIAL. THIS WILL GO FAST - - - DON'T HESITATE. CALL TODAY!
-
1997-05-20$39,500 235-char remark
Show marketing remark (235 chars)
THIS HOME TO BE PURCHASED IN ''AS IS'' CONDITION. HOME HAS BEEN USED AS ARENTAL FOR THE PAST EIGHT YEARS. $410 A MONTH. FURNACE - HOT WATER TANK AREEIGHT YEARS OLD. LOTS OF POTENTIAL. THIS WILL GO FAST - - - DON'T HESITATE. CALL TODAY!
-
1988-10-06soldstatus $14,500
ⓘ Source: listings_history table (triggers on properties + properties_extension) + one-shot
backfill from property_details.listing_events for pre-trigger history.
Tax reassessment forecast OH · Partial reset (capped growth)
- Current annual tax
- $1,881 · $157/mo
- Projected year-2 tax
- $2,457 · $205/mo
- Expected delta
- +$577/yr (+$48/mo · 30.7%)
ⓘ Screening estimate from a state-policy table — verify with the county assessor before closing.
Climate risk First Street
- Flood 1/10 Low FEMA zone X (unshaded) · 0% chance over 30 yrs
- Wildfire 1/10 Low
- Heat 3/10 Moderate 7 d/yr ≥100°F today · 18 d/yr by 30 yrs out
- Wind 2/10 Low 0% chance of damaging wind over 30 yrs
- Air quality 2/10 Low 1 unhealthy d/yr today · 2 by 30 yrs out
Nearby sold comps map
Loading sold comps map…
Walkable amenities ~0.75 mi
Loading nearby amenities…
Taxation est. · year 1
- Rental income
- $24,950
- − Mortgage interest
- −$10,895
- − Property taxes
- −$1,881
- − Insurance
- −$972
- − Repairs & maintenance
- −$1,996
- − Management
- −$1,996
- − Depreciation
- −$5,658
- Taxable income
- $1,551
- Est. tax owed @ 24.0%
- −$372
- After-tax cash flow
- $4,245/yr
For passive investors: Depreciation is non-cash, so a rental often shows a tax loss while cash-flowing — sheltering income. Rental losses are passive: they offset passive income freely, and up to $25,000/yr can offset ordinary (W-2) income if you actively participate and your MAGI is under $100k (phasing out to $0 by $150k); unused losses carry forward. On sale, claimed depreciation is recaptured at up to 25%, and gains may owe capital-gains tax (a 1031 exchange can defer both). Figures are a year-1 estimate at your 24.0% rate — not tax advice; consult a CPA.
Schools (NCES district)
- District
- Delaware City
- NCES district ID
- 3904387
- Math proficiency
- 47% ▼ -24.00%
- Reading proficiency
- 63% ▼ -7.00%
- Median HH income
- $55,434
- Composite
- 47.39/100
- National rank
- #2288
- State rank
- #355 of 656 in OH
Livability — Delaware
- Score
- 80/100
- State rank
- #116
- US rank
- #1717
Category grades
Schools grade is shown separately in the Schools card above.
Census & demographics
- Census place
- Delaware, OH
- County
- Delaware County · 203,207 people
- City population
- 61,401
- Metro
- Columbus, OH
- Population (ZIP)
- 61,401
- Household income
- $105,322
- Rent vs Own
- Severe rent burden
- 965.0
Population outlook (Delaware County) Hauer SSP2
- Today (2025)
- 230,854 people
- By 2030
- 249,294 · +8.0%
- By 2040
- 284,223 · +23.1%
- By 2050
- 315,314 · +36.6%
- By 2075
- 379,462 · +64.4%
- By 2100
- 403,158 · +74.6%
Race, ethnicity, and origin ACS 2023
- Neighborhood character
- Predominantly White (82%)
- Race & ethnicity
- White 82% Two or more races 7% Hispanic / Latino 5% Asian 5% Black 4%
- Common ancestry
- Italian 3% Slovak 3% Romanian 2%
- Foreign-born
- 5% · Canada, China, Vietnam
- Languages at home
- 93% English-only · Spanish 2% Other Asian/Pacific 1% Other Indo-European 1%
Political lean MEDSL · Delaware
- 2024 margin
- Lean R (+6.6) · D 46.2% · R 52.8%
- 2008→2024 swing
- +13.0pp toward D · 2008: -19.6pp · 2024: -6.6pp
- All cycles
- 2024: R+6.6 2020: R+6.8 2016: R+16.1 2012: R+23.7 2008: R+19.6
Not yet ingested
- Civics
- —
Market trends
- HPI YoY
- ▼ -398.47%
- Current HPI
- 233.0634
- Rent YoY
- ▲ 1.42%
- Metro
- Columbus, OH
- State GDP YoY
- ▲ 1.98%
- F500 in state
- 48
Industry mix (Fortune 500 HQ in OH)
| Industry | F500 HQs | Revenue |
|---|---|---|
| Insurance | 3 | $145B |
|
||
| Industrial Machinery | 3 | $49B |
|
||
| Financial Services | 3 | $24B |
|
||
| Consumer Goods | 2 | $93B |
|
||
| Aerospace / Defense | 2 | $47B |
|
||
| Utilities | 2 | $33B |
|
||
Price history
+1241.4% since first listed11 events — show timeline
- 2026-05-15 Price Changed $194,500 CBRMLS
- 2026-04-24 Relisted — CBRMLS
- 2026-04-24 Price Changed $199,500 CBRMLS
- 2026-03-16 Listing Removed — CBRMLS
- 2026-03-06 Listed $210,000 CBRMLS
- 2007-04-19 Sold (Public Records) $125,000 Public Records
- 1998-01-08 Sold (Public Records) $23,000 Public Records
- 1997-12-01 Sold (MLS) $23,000 CBRMLS
- 1997-11-19 Listing Removed — CBRMLS
- 1997-05-20 Listed $39,500 CBRMLS
- 1988-10-06 Sold (Public Records) $14,500 Public Records
Property tax history
+4.4%/yrLatest (2025): $1,881 · +5.1% YoY. Source: county tax records.
Cash-flow waterfall
monthlySold comps — $/sqft
last 12 mo · ≤1 miLoading sold comps…