2118 French Rose · San Antonio, TX
Flood risk No data
- FEMA flood zone
- —
- Chance of flooding over 30 yrs
- —
- Est. flood insurance / yr
- —
Fire risk No data
- Est. fire insurance / yr
- —
Heat risk No data
- Hot days now (above threshold)
- —
- Hot days in 30 yrs
- —
Wind risk No data
- Chance of severe wind over 30 yrs
- —
Air-quality risk No data
- Unhealthy air days now
- —
- Unhealthy air days in 30 yrs
- —
Risk factors via First Street. Map © Google.
Why this score? — see what drove the C grade
The composite is a weighted blend of 9 inputs, each scored 0–100. Each bar is that input's sub-score; the figure is the points it added to the 100-point composite (weight × sub-score).
- Cash flow +18.8/30.0
- ARV discount +15.0/15.0
- DSCR +5.9/10.0
- 1% rule +5.5/10.0
- Livability +4.0/5.0
- Condition / age +4.0/5.0
- Rent growth +2.2/5.0
- Schools +1.9/10.0
- Appreciation +0.0/10.0
$165,349
🖨 Deal sheet 📄 Offer letter ✓ Due diligence
Listing remarks MLS
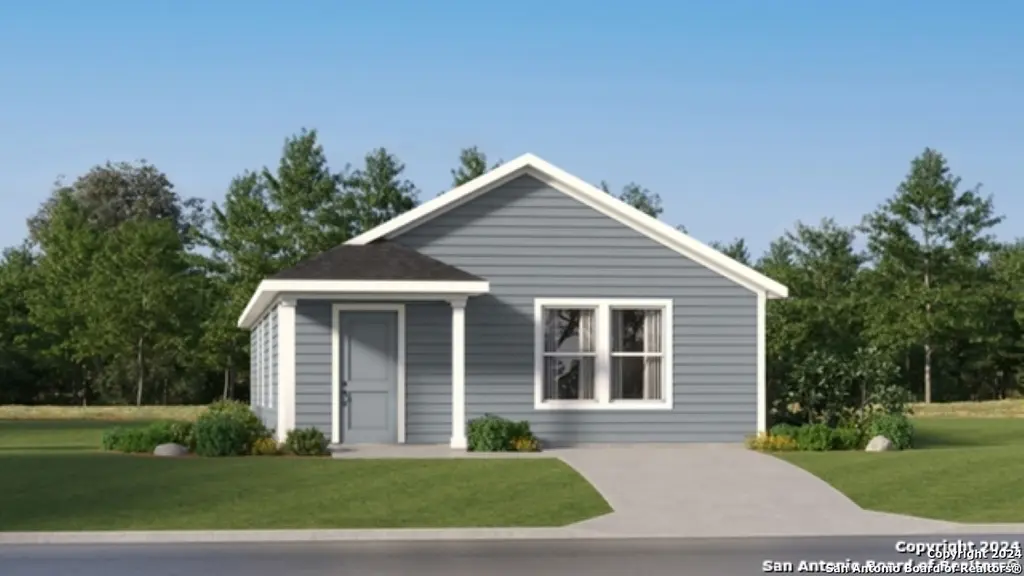
This single-level home showcases a spacious open floorplan shared between the kitchen, dining area and family room for easy entertaining. An owner's suite enjoys a private location in a rear corner of the home, complemented by an en-suite bathroom and walk-in closet. There are two secondary bedrooms at the front of the home, which are comfortable spaces for household members and overnight guests.
Key facts
- Walk-in closet
- Open floorplan
- En-suite bathroom
Tags
Neighborhood map
What this means for you Summary
Snapshot
- This is a 3-bed/2.0-bath single-family listed at $165k. Condition is rated good.
Deal economics
- At list price, monthly cash flow is $166 ($2k/yr) — positive.
- The deal already cash-flows at list — no discount required.
- Meets the 1% rule at list price ($2k rent vs $165k).
- Recommended offer: $155k (6.0% below list) — sets the bar for market timing.
- Cap rate 7.5% vs local median 3.8% in San Antonio — top-decile yield for the area; either an underpriced asset or a hidden risk that comps aren't pricing in. Stress-test before assuming the spread holds.
Location & tenants
- Location reads 80/100 on livability (#31 in TX, #1,616 nationally) — a professional / high-income tenant draw. Strengths: amenities A+, commute A+, cost of living A+; Watch: schools C-, crime F.
- East Central ISD (rural): math 16% / reading 25% proficiency, ranked #758 of 826 in TX (top 92%) — low school quality limits family demand, transient renter base, plan for 1-2y turnover; 61% free/reduced lunch — lower-income household profile, screen leases tightly.
- Market conditions: Rents soft (-1.1%/yr); 1152 active listings in the ZIP; 21 comparable units currently listed for rent nearby; rentals at typical pace (median 22d on market — plan ~3-4 weeks tenant-placement turnaround); solid renter incomes; 8,308 units permitted in Bexar County in 2024 (2,506 in 5+ unit buildings).
Forward outlook
- Local home prices are declining (-3.0%/yr); year-one equity from $1k of loan paydown is wiped out by about $5k of value loss. Plan a longer hold.
- Bexar County population projected at +50% by 2050 — long-run rental-demand tailwind backs the buy-and-hold thesis.
Negotiation context
- It's been on market 65 days — a 6% lower offer ($155k) is reasonable based on typical stale-listing flexibility.
- 2 sale attempts; this cycle's ask has dropped $25k (13%) from the opening price — seller is motivated, your offer sets the floor, not the list.
Questions for the listing agent
- It's been on market 65 days. Have you received any prior offers? Is the seller open to a 6% concession, seller financing, or rate buy-down credit?
- What does the HOA fee cover, when was the last increase, and are there any pending special assessments or reserve-fund shortfalls?
- Why hasn't it sold? Are there any deal-killer items the seller is aware of (foundation, flood, title, zoning, code violations)?
- Is there a deadline driving the sale (1031 exchange, divorce, estate, relocation)? That informs how much negotiation room exists.
- Crime grade is F in this area — have there been break-ins, vandalism, or insurance claims at this property in the last 3 years? What carrier currently insures it and at what premium?
- What's the average days-on-market for RENTAL listings here right now (not sales)? A rising rental-DOM trend means longer vacancies and softer asking-rent achievability than the comps imply.
- What's the recent tenant-quality profile in this submarket — average credit score on applications, eviction rate, late-payment / NSF rate, and stable-employment percentage? A property-management company in the area should have these aggregated.
- How much new for-sale + rental construction is in the pipeline within 1–3 miles? Heavy new supply typically softens prices + rents 12–24 months out; constrained supply supports both.
Investment metrics
- 1% rule
- 1.05% ✓
- Cap rate
- 7.50%
- Cash-on-cash
- 4.31%
- DSCR
- 1.19
- GRM
- 7.9
CMA / ARV
- ARV (median comp)
- $210,460
- List price
- $165,349
- Delta
- -21.43%
- Verdict
- UNDERPRICED
- Comps
- 20 within 1.0 mi
Show comp detail 12 sales within ~0.75 mi
| Address | Dist | Beds/Ba | Sqft | Sold | Price | $/sf | Match |
|---|---|---|---|---|---|---|---|
| 11553 Cinnamon Rose | 0.08mi | 3/2.0 | 1,380 (0%) | 1mo | $164,999 | $120 | 96 |
| 11533 Cinnamon Rose | 0.11mi | 3/2.0 | 1,354 (-2%) | 2mo | $196,999 | $145 | 90 |
| 11513 Cinnamon Rose | 0.14mi | 3/2.0 | 1,354 (-2%) | 2mo | $198,999 | $147 | 89 |
| 11516 Chestnut Rose | 0.13mi | 3/2.0 | 1,354 (-2%) | 7mo | $225,999 | $167 | 85 |
| 1863 Musk Rose | 0.26mi | 3/2.0 | 1,402 (+2%) | 7mo | $205,999 | $147 | 80 |
| 11525 Cinnamon Rose | 0.12mi | 4/2.0 (+1) | 1,483 (+8%) | 2mo | $208,999 | $141 | 75 |
| 11545 Cinnamon Rose | 0.09mi | 4/2.0 (+1) | 1,500 (+9%) | 2mo | $169,999 | $113 | 75 |
| 11557 Cinnamon Rose | 0.07mi | 3/2.0 | 1,200 (-13%) | 2mo | $160,999 | $134 | 73 |
| 11537 Chestnut Rose | 0.12mi | 4/2.0 (+1) | 1,500 (+9%) | 5mo | $185,499 | $124 | 71 |
| 11521 Cinnamon Rose | 0.13mi | 3/2.0 | 1,200 (-13%) | 2mo | $156,999 | $131 | 70 |
| 1814 Musk Rose | 0.26mi | 3/2.0 | 1,266 (-8%) | 7mo | $211,999 | $167 | 68 |
| 1906 Musk Rose | 0.25mi | 4/2.0 (+1) | 1,575 (+14%) | 7mo | $231,849 | $147 | 54 |
Match score weights: distance 35% · size 25% · config 20% · recency 20%. Top-matched comps best support the ARV.
Projected returns pro-forma
-3.0% appreciation · 0.0% rent growth · sell at horizon
- IRR
- -13.2%
- Equity multiple
- 0.54×
- Total profit
- $-21,257
- Equity at exit
- $24,654
- IRR
- -10.0%
- Equity multiple
- 0.47×
- Total profit
- $-24,362
- Equity at exit
- $14,296
Cash invested: $46,298 (down + closing). Projections, not guarantees.
Landlord ↔ Tenant lean methodology
- Overall (STATE)
- 87 Strongly Landlord-Friendly
- State Texas
- 87 Strongly Landlord-Friendly · R+5
- County
- — inherits STATE
- City
- — inherits STATE
ZIP-level market 78109
- Home prices YoY
- -17.8%
- Rents YoY
- -1.1%
- Active inventory
- 1152
- Price-to-rent
- 7.9×
Monthly cashflow live
- Estimated rent
- $1,744 high interval (Pro) →
- Mortgage (P&I)
- −$867
- Tax est. 1.5%
- −$207 /mo · $2,480/yr
- Insurance
- −$69
- HOA
- −$69
- Vacancy / Maint / Mgmt
- −$366
- Net cashflow
- $166
Break-even live
UW: 25.0% down · 7.5% · 30yr · 1.5% tax · 5.0% vac · 8.0% maint · 8.0% mgmt
Financing live
Cash to close
- Down payment
- $41,337
- Closing costs
- $4,960
- Reserves months
- —
- Total cash needed
- —
Loan-product check · same deal, 3 products live
Conventional
25% down · 7.5% · 30yr
- Down + closing
- —
- Monthly P&I
- —
- Monthly cashflow
- —
- DSCR
- —
- Eligible?
- —
Personal DTI + credit; lowest rate.
DSCR
20% down · 8.5% · 30yr
- Down + closing
- —
- Monthly P&I
- —
- Monthly cashflow
- —
- DSCR
- —
- Eligible?
- —
No personal income docs; deal must DSCR.
Hard money
10% down · 12.0% · 12mo
- Down + closing
- —
- Monthly P&I
- —
- Monthly cashflow
- —
- DSCR
- —
- Eligible?
- —
Short-term bridge; refi at stabilization.
Rent comps 21 comps
| Address | Beds | Baths | Sqft | Rent | $/sqft | DOM | Units | Dist |
|---|---|---|---|---|---|---|---|---|
| 11602 Dog Rose Converse, TX | 3.0 | 2.0 | 1354 | $1,650 | $1.22 | 23d | 1 | 0.22mi |
| 4611 E 1604 N Converse, TX | 2.0–4.0 | 2.0 | 1112 | $1,229 | $1.11 | 1d | 1 | 0.68mi |
| 11151 Hollinger Cir Converse, TX | 4.0 | 2.5 | 1859 | $1,705 | $0.92 | 23d | 1 | 0.92mi |
| 11130 Hollinger Cir Converse, TX | 3.0 | 2.5 | 1709 | $1,950 | $1.14 | 21d | 1 | 0.93mi |
| 11130 Hollinger Cir Converse, TX | 3.0 | 2.5 | 1689 | $1,950 | $1.15 | 2d | 1 | 0.93mi |
| 3106 Drayton Ests Converse, TX | 2.0–5.0 | 2.0–3.5 | 1733 | $2,102 | $1.21 | 1d | 1 | 0.99mi |
| 11046 Eyelet Hbr Converse, TX | 3.0 | 2.0 | 1525 | $1,750 | $1.15 | 23d | 1 | 1.00mi |
| 2822 Praline Fry Converse, TX | 3.0 | 2.0 | 1525 | $1,645 | $1.08 | 2d | 1 | 1.00mi |
| 11030 Yonder Flts Converse, TX | 3.0 | 2.5 | 1428 | $1,500 | $1.05 | 4d | 1 | 1.05mi |
| 11026 Yonder Flts Converse, TX | 3.0 | 2.0 | 1525 | $1,645 | $1.08 | 3d | 1 | 1.06mi |
| 11019 Chatham Ct Converse, TX | 3.0 | 2.5 | 1428 | $1,425 | $1.00 | 43d | 1 | 1.07mi |
| 10922 Chatham Ct Converse, TX | 3.0 | 2.0 | 1525 | $1,645 | $1.08 | 23d | 1 | 1.16mi |
| 2939 Gastonian Ml Converse, TX | 3.0 | 2.0 | 1525 | $1,495 | $0.98 | 43d | 1 | 1.17mi |
| 2815 Armaan WAY Converse, TX | 3.0 | 2.5 | 1401 | $1,495 | $1.07 | 1d | 1 | 1.28mi |
| 3130 Jackson Smt Converse, TX | 3.0 | 2.5 | 1428 | $1,885 | $1.32 | 4d | 1 | 1.37mi |
| 3055 Jackson Smt Converse, TX | 3.0 | 2.0 | 1525 | $1,595 | $1.05 | 43d | 1 | 1.38mi |
| 3318 Carducci Dr Converse, TX | 3.0 | 2.0 | 1276 | $1,800 | $1.41 | 43d | 1 | 1.38mi |
| 10803 Prusiner Dr Converse, TX | 3.0 | 2.0 | 1450 | $1,410 | $0.97 | 23d | 1 | 1.43mi |
| 10803 Prusiner Dr Converse, TX | 3.0 | 2.0 | 1440 | $1,476 | $1.02 | 21d | 1 | 1.43mi |
| 10690 Pablo Way Converse, TX | 3.0 | 2.0 | 1207 | $1,650 | $1.37 | 43d | 1 | 1.45mi |
| 2802 Stigler Dr Converse, TX | 4.0 | 2.0 | 1627 | $1,495 | $0.92 | 4d | 1 | 1.46mi |
HOA detail
- Monthly dues
- $69 · $828/yr
Listing history 23 events
-
2026-06-18status $165,349 Pending 65 DOM
-
2026-06-18days on market $165,349 Price Change 65 DOM
-
2026-06-17days on market $165,349 Price Change 64 DOM
-
2026-06-16days on market $165,349 Price Change 63 DOM
-
2026-06-15days on market $165,349 Price Change 62 DOM
-
2026-06-13pricedays on market $165,349 Price Change 60 DOM
-
2026-06-09days on market $164,999 Price Change 56 DOM
-
2026-06-08days on market $164,999 Price Change 55 DOM
-
2026-06-07days on market $164,999 Price Change 54 DOM
-
2026-06-04days on market $164,999 Price Change 51 DOM
-
2026-06-03days on market $164,999 Price Change 50 DOM
-
2026-06-02days on market $164,999 Price Change 49 DOM
-
2026-06-02pricestatus $164,999 Price Change 48 DOM
-
2026-06-01days on market $169,999 Active 48 DOM
-
2026-05-31days on market $169,999 Active 47 DOM
-
2026-05-01price $169,999 399-char remark
Show marketing remark (399 chars)
This single-level home showcases a spacious open floorplan shared between the kitchen, dining area and family room for easy entertaining. An owner's suite enjoys a private location in a rear corner of the home, complemented by an en-suite bathroom and walk-in closet. There are two secondary bedrooms at the front of the home, which are comfortable spaces for household members and overnight guests.
-
2026-04-30price $169,999 525-char remark
Show marketing remark (525 chars)
The Avas - This single-level home showcases a spacious open floorplan shared between the kitchen, dining area and family room for easy entertaining. An owner's suite enjoys a private location in a rear corner of the home, complemented by an en-suite bathroom and walk-in closet. There are two secondary bedrooms at the front of the home. Estimated Completion June 2026. The completion date, prices and features may vary and are subject to change. Please verify with Lennar directly. Photos are for illustrative purposes only.
-
2026-04-28price $175,999 525-char remark
Show marketing remark (525 chars)
The Avas - This single-level home showcases a spacious open floorplan shared between the kitchen, dining area and family room for easy entertaining. An owner's suite enjoys a private location in a rear corner of the home, complemented by an en-suite bathroom and walk-in closet. There are two secondary bedrooms at the front of the home. Estimated Completion June 2026. The completion date, prices and features may vary and are subject to change. Please verify with Lennar directly. Photos are for illustrative purposes only.
-
2026-04-27price $175,999 399-char remark
Show marketing remark (399 chars)
This single-level home showcases a spacious open floorplan shared between the kitchen, dining area and family room for easy entertaining. An owner's suite enjoys a private location in a rear corner of the home, complemented by an en-suite bathroom and walk-in closet. There are two secondary bedrooms at the front of the home, which are comfortable spaces for household members and overnight guests.
-
2026-04-17price $177,999 399-char remark
Show marketing remark (525 chars)
The Avas - This single-level home showcases a spacious open floorplan shared between the kitchen, dining area and family room for easy entertaining. An owner's suite enjoys a private location in a rear corner of the home, complemented by an en-suite bathroom and walk-in closet. There are two secondary bedrooms at the front of the home. Estimated Completion June 2026. The completion date, prices and features may vary and are subject to change. Please verify with Lennar directly. Photos are for illustrative purposes only.
-
2026-04-17price $177,999 525-char remark
Show marketing remark (525 chars)
The Avas - This single-level home showcases a spacious open floorplan shared between the kitchen, dining area and family room for easy entertaining. An owner's suite enjoys a private location in a rear corner of the home, complemented by an en-suite bathroom and walk-in closet. There are two secondary bedrooms at the front of the home. Estimated Completion June 2026. The completion date, prices and features may vary and are subject to change. Please verify with Lennar directly. Photos are for illustrative purposes only.
-
2026-04-14$189,999 New 525-char remark
Show marketing remark (525 chars)
The Avas - This single-level home showcases a spacious open floorplan shared between the kitchen, dining area and family room for easy entertaining. An owner's suite enjoys a private location in a rear corner of the home, complemented by an en-suite bathroom and walk-in closet. There are two secondary bedrooms at the front of the home. Estimated Completion June 2026. The completion date, prices and features may vary and are subject to change. Please verify with Lennar directly. Photos are for illustrative purposes only.
-
2026-04-13$189,999 Active 399-char remark
Show marketing remark (399 chars)
This single-level home showcases a spacious open floorplan shared between the kitchen, dining area and family room for easy entertaining. An owner's suite enjoys a private location in a rear corner of the home, complemented by an en-suite bathroom and walk-in closet. There are two secondary bedrooms at the front of the home, which are comfortable spaces for household members and overnight guests.
ⓘ Source: listings_history table (triggers on properties + properties_extension) + one-shot
backfill from property_details.listing_events for pre-trigger history.
Nearby sold comps map
Loading sold comps map…
Walkable amenities ~0.75 mi
Loading nearby amenities…
Taxation est. · year 1
- Rental income
- $20,928
- − Mortgage interest
- −$9,262
- − Property taxes
- −$2,480
- − Insurance
- −$827
- − Repairs & maintenance
- −$1,674
- − Management
- −$1,674
- − HOA
- −$828
- − Depreciation
- −$4,810
- Taxable loss
- −$627
- Est. tax savings @ 24.0%
- +$151
- After-tax cash flow
- $2,144/yr
For passive investors: Depreciation is non-cash, so a rental often shows a tax loss while cash-flowing — sheltering income. Rental losses are passive: they offset passive income freely, and up to $25,000/yr can offset ordinary (W-2) income if you actively participate and your MAGI is under $100k (phasing out to $0 by $150k); unused losses carry forward. On sale, claimed depreciation is recaptured at up to 25%, and gains may owe capital-gains tax (a 1031 exchange can defer both). Figures are a year-1 estimate at your 24.0% rate — not tax advice; consult a CPA.
Condition & rehab AI · 12 photos
This single-level home showcases a spacious open floorplan with modern finishes and a well-maintained exterior. It is move-in ready and ready for minor updates to enhance its curb appeal and value.
Value-add opportunities
- Both Painting the exterior and interior walls — Fresh paint can enhance curb appeal and interior aesthetics
- Both Landscaping improvements — Enhanced landscaping can increase curb appeal and property value
- Both Adding smart home features — Modern technology can improve convenience and attract buyers/renters
Renovation cost estimate screening
Value-add ROI direction
- Both Painting the exterior and interior walls — Fresh paint can enhance curb appeal and interior aesthetics ↑
- Both Landscaping improvements — Enhanced landscaping can increase curb appeal and property value ↑
- Both Adding smart home features — Modern technology can improve convenience and attract buyers/renters ↑
ⓘ Cost ranges are severity-bucket heuristics (US national rule-of-thumb). Get contractor quotes + a written scope before underwriting a rehab budget.
Schools (NCES district)
- District
- East Central ISD
- NCES district ID
- 4817850
- Math proficiency
- 16% ▼ -12.00%
- Reading proficiency
- 25% ▼ -6.00%
- Median HH income
- $53,941
- Composite
- 18.67/100
- National rank
- #8887
- State rank
- #758 of 826 in TX
Livability — San Antonio
- Score
- 80/100
- State rank
- #31
- US rank
- #1616
Category grades
Schools grade is shown separately in the Schools card above.
Census & demographics
- County
- Bexar County · 1,990,555 people
- City population
- 1,806,925
- Metro
- San Antonio-New Braunfels, TX
- Population (ZIP)
- 63,067
- Household income
- $91,320
- Rent vs Own
- Severe rent burden
- 1732.0
Population outlook (Bexar County) Hauer SSP2
- Today (2025)
- 2,336,851 people
- By 2030
- 2,560,728 · +9.6%
- By 2040
- 3,020,569 · +29.3%
- By 2050
- 3,493,522 · +49.5%
- By 2075
- 4,668,459 · +99.8%
- By 2100
- 5,533,242 · +136.8%
Race, ethnicity, and origin ACS 2023
- Neighborhood character
- Diverse neighborhood (Simpson 0.69)
- Race & ethnicity
- Hispanic / Latino 44% White 27% Two or more races 21% Black 21% Asian 3%
- Hispanic origin (detail)
- Mexican 29% Puerto Rican 4%
- Common ancestry
- Lithuanian 1% Romanian 1% Italian 1%
- Foreign-born
- 11% · Canada, Vietnam, South Korea
- Languages at home
- 71% English-only · Spanish 23% Tagalog/Filipino 1% Other Asian/Pacific 1%
Political lean MEDSL · Bexar
- 2024 margin
- Lean D (+9.8) · D 54.3% · R 44.6% · Other 1.1%
- 2008→2024 swing
- +4.2pp toward D · 2008: 5.6pp · 2024: 9.8pp
- All cycles
- 2024: D+9.8 2020: D+18.2 2016: D+13.5 2012: D+4.6 2008: D+5.6
Not yet ingested
- Civics
- —
Market trends
- HPI YoY
- ▼ -51.02%
- Current HPI
- 236.4923
- Rent YoY
- ▼ -1.08%
- Metro
- San Antonio-New Braunfels, TX
- State GDP YoY
- ▲ 3.95%
- F500 in state
- 110
Industry mix (Fortune 500 HQ in TX)
| Industry | F500 HQs | Revenue |
|---|---|---|
| Energy | 16 | $1,198B |
|
||
| Technology | 5 | $198B |
|
||
| Engineering / Construction | 4 | $72B |
|
||
| Energy Services | 3 | $60B |
|
||
| Utilities | 3 | $41B |
|
||
| Healthcare | 2 | $330B |
|
||
Price history
-10.5% since first listed8 events — show timeline
- 2026-05-01 Price Changed $169,999 Zillow
- 2026-04-30 Price Changed $169,999 LERA
- 2026-04-28 Price Changed $175,999 LERA
- 2026-04-27 Price Changed $175,999 Zillow
- 2026-04-17 Price Changed $177,999 Zillow
- 2026-04-17 Price Changed $177,999 LERA
- 2026-04-14 Listed $189,999 LERA
- 2026-04-13 Listed $189,999 Zillow
Cash-flow waterfall
monthlySold comps — $/sqft
last 12 mo · ≤1 miLoading sold comps…